INTRODUCTION
Illegal resource use can detrimentally affect affiliated species and habitats, reduce biodiversity and jeopardize the success of protected areas (Pitcher et al. Reference Pitcher, Watson, Forrest, Valtysson and Guenette2002; Turpie et al. Reference Turpie, Heydenrych and Lamberth2003; Mak et al. Reference Mak, Yanase and Renneberg2005; New Zealand Ministry of Fisheries 2006; Faasen & Watts Reference Faasen and Watts2007). Furthermore, non-compliance can also have social impacts, creating tension in communities, threatening the livelihoods of law-abiding resource users and encouraging crime (Tarr Reference Tarr2000; Pitcher et al. Reference Pitcher, Watson, Forrest, Valtysson and Guenette2002; Turpie et al. Reference Turpie, Heydenrych and Lamberth2003; Faasen & Watts Reference Faasen and Watts2007). A broad array of different management tools might be employed for reducing illegal activities, but conservation managers must first be able to assess and later monitor the extent of non-compliance (Davies Reference Davies1996; Hockings et al. Reference Hockings, Stolton and Dudley2000; Hughey et al. Reference Hughey, Cullen and Moran2003). Certain resource users may be more prone to illegal activities, and certain conservation regulations may be more regularly violated than others. The development of a monitoring tool that estimates which regulations are experiencing the highest proportions of non-compliance and also provides reliable information about who is acting illegally, would allow managers to assess the effectiveness of regulatory measures for protecting resources and set more efficient enforcement and outreach priorities.
Owing to the severity and diversity of illegal resource use impacts, managers worldwide have developed a wide range of techniques to estimate non-compliance, but the effectiveness of these methodologies is limited by inherent biases and management resource constraints. Direct monitoring of stock numbers, via techniques such as aerial surveys, can assess the health of animal populations and watch for signs of poaching impacts (Burton Reference Burton1999; CDFG [California Department of Fish and Game] 2005; McCluskey & Lewison Reference McCluskey and Lewison2008). However, periodic and comprehensive direct monitoring is costly, and many ecosystems have high natural variability, making it difficult to determine the proportion of stock changes caused by illegal activities (Spencer & Collie Reference Spencer and Collie1997; Tarr Reference Tarr2000; CDFG 2005). Illegal activity can also be analysed based on law enforcement records of citations, but this technique underestimates illegal activity because law enforcement officers catch an unknown proportion of total violators (CDFG 2005). Self-reporting methods (such as logbooks) may be unreliable due to frequently falsified records (Harris Reference Harris1998; McCluskey & Lewison Reference McCluskey and Lewison2008). Economic modelling can estimate illegal take, but these models require extensive information about market streams, which may not be available for illegal markets (Patterson et al. Reference Patterson, Castello, Santos and Barcia1990; Tarr Reference Tarr2000). Economic methods are also difficult to employ with recreational resource users, who may consume resources for personal use only and not interact with the market at all (Hauck & Sweijd Reference Hauck and Sweijd1999; Pitcher et al. Reference Pitcher, Watson, Forrest, Valtysson and Guenette2002; CDFG 2005). Methods based on direct questioning of resource users and related informants generally suffer from bias due to the perception of risk among respondents asked to confess or report illegal behaviour (Fox & Tracy Reference Fox and Tracy1986; Pitcher et al. Reference Pitcher, Watson, Forrest, Valtysson and Guenette2002).
The randomized response technique (RRT) is an underused, but reliable and cost-effective method that has the potential to overcome the biases of other techniques used for analysing illegal resource use (Wahl Reference Wahl1995; Solomon et al. Reference Solomon, Jacobson, Wald and Gavin2007). RRT estimates a greater proportion of sensitive behaviour than standard survey and interview methods (Warner Reference Warner1965; I-Cheng et al. Reference I-Cheng, Chow and Rider1972; Dowling & Shachtman Reference Dowling and Shachtman1975; Goodstadt & Gruson Reference Goodstadt and Gruson1975; Chaloupka Reference Chaloupka1985; Berrens et al. Reference Berrens, Bohara and Kerkvliet1997; Lensvelt-Mulders et al. Reference Lensvelt-Mulders, Hox, van der Heijden and Maas2005). The success of RRT is due to the method's design, which reduces the perceived costs of honesty. Respondents replying ‘yes’ may be answering either a sensitive question or an unrelated innocuous question (Fox & Tracy Reference Fox and Tracy1986). The interviewers know the probability of answering the sensitive question, but they do not know which specific question is being answered by a given respondent (Buchman & Tracy Reference Buchman and Tracy1982; Fox & Tracy Reference Fox and Tracy1986). Thus, the interviewee responds with information that gives the researcher data only on a probability basis (Warner Reference Warner1965). This method has been used in a variety of studies of sensitive issues ranging from abortion rates to tax evasion and, more recently, illegal resource use (I-Cheng et al. Reference I-Cheng, Chow and Rider1972; Chaloupka Reference Chaloupka1985; Schill & Kline Reference Schill and Kline1995; Lensvelt-Mulders et al. Reference Lensvelt-Mulders, Hox, van der Heijden and Maas2005; Solomon et al. Reference Solomon, Jacobson, Wald and Gavin2007). While RRT has been shown to be more effective than other methods for estimating rates of compliance (for example see Solomon et al. Reference Solomon, Jacobson, Wald and Gavin2007), and Chaloupka (Reference Chaloupka1985) used the method to study illegal marine shell collection, the technique has never been applied to marine fisheries management.
We use a case study of illegal recreational abalone fishing in Northern California to examine how RRT can assess non-compliance in marine fisheries. Our RRT results allow comparison of non-compliance rates among different abalone recreational fishing regulations, which has not been possible with the current monitoring methods employed in the fishery. In addition, this research is the first to demonstrate how RRT might determine characteristics of illegal resource users. Sociodemographic variables have been found in other studies to influence the decisions of resource users relating to compliance (Furlong Reference Furlong1991; Sutinen & Kuperan Reference Sutinen and Kuperan1999; Hatcher et al. Reference Hatcher, Jaffry, Thebaud and Bennett2000; Sumaila et al. Reference Sumaila, Alder and Keith2006). For example, Furlong (Reference Furlong1991) found that older fishers were generally more compliant than younger fishers, as younger fishers were more prepared to risk getting caught. Furthermore, years of fishing experience, levels of awareness of regulations, present economic status and potential gains from poaching have all been identified as possible determinants of illegal behaviour (Sutinen & Kuperan Reference Sutinen and Kuperan1999; Hatcher et al. Reference Hatcher, Jaffry, Thebaud and Bennett2000; Sumaila et al. Reference Sumaila, Alder and Keith2006). Several case studies have shown that low income individuals are more likely to engage in illegal resource use behaviour, because the marginal benefit they would gain from violation is higher than that of someone with a high income (Furlong Reference Furlong1991; Faasen & Watts Reference Faasen and Watts2007). Understanding the regulations that are most heavily violated and the characteristics of illegal fishers can help fishery managers to better target conservation actions.
METHODS
Case study: the Northern California recreational red abalone fishery
One example of a fishery that continues to combat illegal fishing, despite years of evolving management measures, is the North American red abalone (Haliotis rufescens) fishery. Red abalone extend from Mexico to Oregon, but due to overharvest and the reintroduction of the sea otter, their abundance in central and southern California has declined (Karpov et al. Reference Karpov, Haaker, Taniguchi and Rogers-Bennett2000; CDFG 2005). At present, the only officially designated red abalone fishery in California is the recreational fishery north of San Francisco, but non-compliance with management measures may be adversely affecting the sustainability of the resource (CDFG 2005). Serial depletion throughout the last century has already wiped out populations of several species of abalone in California (CDFG 2005), and heavily used red abalone sites in Northern California are showing signs of depletion (Karpov et al. Reference Karpov, Haaker, Taniguchi and Rogers-Bennett2000; CDFG 2007). As a result of increasing fishing pressure, legal take limits have been reduced several times (CDFG 2005). When combined with a high global market price for abalone meat, these changes have increased the incentive to poach (Karpov et al. Reference Karpov, Haaker, Taniguchi and Rogers-Bennett2000; CDFG 2005). As the Abalone Recovery and Management Plan (ARMP) states, ‘abalone poaching has been a serious concern in California for decades and continues to have a major impact on stocks’ (CDFG 2005, p. 3–9). As a result, enforcement effort has been increased in Northern California, and the Department of Fish and Game, ‘expends considerable funding and effort towards enforcement of fishing regulations, including abalone fishing’ (CDFG 2005, p. 3–10). However, prior to this study no comparable estimates of non-compliance rates for different regulations existed for this fishery.
The red abalone fishery is currently managed by a series of regulations limiting fisher extraction, gear type and fishing season. These measures include a daily take limit of three abalone, which is intended to reduce point source fishing impacts. An annual take limit of twenty-four abalone per fisher has also been set in accordance with the total allowable catch (TAC) levels for the fishery (CDFG 2005). Furthermore, a minimum legal shell length limit of seven inches (178 mm) has been introduced to allow abalone to reach sexual maturity and reproduce prior to being subjected to fishing mortality (CDFG 2005). In addition to a Californian fishing license, all abalone fishers are also required to purchase an abalone permit report card each season. The card provides managers with basic information on the number of recreational fishers using the resource, and the date, time and location of every abalone taken. The punch-card must be filled in by fishers immediately upon landing the abalone, and sent back to managers at the end of the season (CDFG 2005). The penalties for illegal activity range from citations and gear confiscation for minor infractions, such as landing an abalone slightly under the size limit, to heavy fines with the possibility of jail time for large or repeat offences.
Wardens from the CDFG are primarily responsible for monitoring the 35 000 licensed abalone fishers in Northern California, and they patrol the tidal areas in uniform (CDFG 2005, p. 8–1; Kalvass Reference Kalvass2007). Video cameras, aircraft, boat patrols and undercover wardens are also used to detect violators (CDFG 2005). In addition to game wardens, some regional, state, and national park personnel may also monitor abalone fishing activity within their area, and report illegal activity to the CDFG. The public has also become involved in enforcement via the CalTIP (Turn In Poachers) programme, which encourages them to report violations via a telephone hotline (CDFG 2005).
Unfortunately, the methods currently used to gather information on the level of illegal abalone harvest in Northern California are insufficient to provide any estimates of compliance rates across different regulations. Monitoring of illegal activity is accomplished using a range of different data sources: enforcement records (from patrols, citations and roadblocks), self-reporting via report cards, direct questioning via telephone surveys and direct monitoring with transect surveys. Enforcement data are insufficient because red abalone may be legally collected from approximately 640 km (400 miles) of coastline, requiring individual wardens to monitor large distances and potentially reducing encounter rates with violators. Additionally, warden citation reports from this fishery are sent to the main CDFG office. At the time of our study, these citation reports were not available to us or to local managers for use in estimating non-compliance or illegal take. Vehicle search roadblock data also underestimate non-compliance because roadblocks are pre-notified in local newspapers and only occur a few times a year during peak fishing season (Riske Reference Riske2006). The roadblock reports describe the number of citations given and abalone seized, but do not contain specific data on non-compliance rates for different regulations or any indication of the characteristics of violators (Riske Reference Riske2003, Reference Riske2006).
The abalone report card system is also an insufficient tool for estimating non-compliance. Despite being required by law, individuals are usually wary of confessing illegal behaviour via self-reporting methods and are likely to under-report illegal catch or multiple daily visits (Warner Reference Warner1965; Riske Reference Riske2006). Estimates of illegal take from report cards and telephone surveys are virtually zero (Kalvass & Geibel Reference Kalvass and Geibel2006). For example, in 2002, fishers returned 15 004 (42.7%) of the report cards issued (Kalvass & Geibel Reference Kalvass and Geibel2006), but each year only 1–3 cards report illegal activity (P.E. Kalvass, personal communication 2007). Furthermore, this tool does not provide any information which would help managers identify potential violators. Red abalone managers in Northern California also employ biological monitoring tools. The health of the abalone population and the TAC for the entire recreational fishery are estimated from transect surveys conducted at only eight sites (Kashiwada & Taniguchi Reference Kashiwada and Taniguchi2007). Management and enforcement assume that ‘the impact of poaching, like all forms of mortality, would be evident in declining population densities during dive surveys’ (CDFG 2005, p. F-12), but these transects do not produce any estimate of compliance rates or indicate what types of violations occur.
Each of the methods currently in use for monitoring illegal fishing of abalone in Northern California has been shown in the literature to underestimate actual illegal activity (Buchman & Tracy Reference Buchman and Tracy1982; Fox & Tracy Reference Fox and Tracy1986; Solomon et al. Reference Solomon, Jacobson, Wald and Gavin2007). Local managers have little accurate baseline information about non-compliance in the red abalone recreational fishery, and no data exist which allow for comparisons of compliance across different regulations or permit the identification of violator characteristics (Buchman & Tracy Reference Buchman and Tracy1982; Fox & Tracy Reference Fox and Tracy1986; Kalvass & Geibel Reference Kalvass and Geibel2006). We used RRT to fill this void.
Sample design
Four sites were sampled in Mendocino County and four in Sonoma County, California. The survey area began 144 km (90 miles) north of San Francisco, and extended another 150 km (93 miles) north to Van Damme State Park. Mendocino and Sonoma counties were chosen because they represent 96% of the annual red abalone effort and, owing to the steep and rocky shoreline, abalone take is largely point source (CDFG 2005). Point source fishing in the region allows for easy recognition of coastal access points by both fishers and researchers, and provides facilities, such as parking lots, where fishers congregate and surveys can easily be administered.
In order to get a reasonable cross section of the abalone fishing community, it was important to sample from both more accessible ‘high take’ sites, as well as ‘low take’ areas. Four of the top ten abalone take sites, from 56 included on the abalone permit report card, were selected randomly and designated ‘high take’. Three randomly selected sites ranked 11th to 25th for take were labelled ‘low take’. An additional random selection of ‘miscellaneous small’ Mendocino sites (rated 26th to 35th), all six of which could be surveyed in a single day, composed the fourth ‘low take’ site (Kalvass & Geibel Reference Kalvass and Geibel2006). The sites were assigned specific survey dates in advance by multi-strata semi-random selection. Surveys were collected over a five-week period during August–September 2007. Weekends experience higher fishing effort than weekdays, so these days needed to be equitably distributed among low and high take sites. This was accomplished by randomly assigning each site one of the eight weekend sampling days. Fridays were considered medium traffic days, and were randomly split between high and low take sites. Mondays through Thursdays are characterized by low fishing effort, and sites were randomly assigned for those days.
Respondents were selected randomly on-site. The first person to exit their vehicle and be identified as an abalone fisher was approached for the survey. If the car contained more than three abalone divers, every third person was also approached. Fishers were identified by their clothing (for example wetsuits) or by their possession of abalone fishing gear (such as pry irons or inner-tubes). The respondents had no prior knowledge of the survey and no identifying information was recorded.
Survey administration
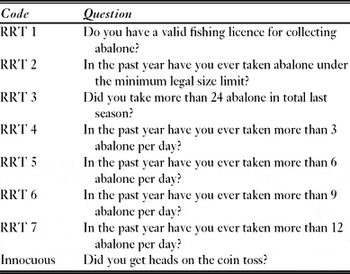
The survey was composed of three sections: randomized response technique (RRT) questions about illegal abalone fishing behaviour; questions related to the respondent's awareness of regulations and abalone collecting experience; and sociodemographic and economic questions. Once verbal consent to participate was attained, the respondent was given a copy of the survey form on a clipboard, a coin (US$ 0.25), a pencil with eraser and seven numbered envelopes containing the RRT and innocuous questions (see Table 1). The respondent was first told how to complete the RRT section, because piloting showed that respondents were less inclined to complete the RRT section if it was not administered first. The survey method was explained with a set protocol to ensure all respondents were given the same information about how to self-administer the survey. Prior to answering each RRT survey question, the respondent performed the same randomizing process (i.e. they flipped a coin but did not reveal the result to anyone). They then randomly selected one of two question cards from an envelope without revealing to anyone else which question was chosen. Each of the seven envelopes contained one card with the sensitive question (RRT 1–7, Table 1) and one with the unrelated innocuous question pertaining to the outcome of the coin toss (see Table 1). The respondent then recorded their reply of ‘yes’ or ‘no’ on the survey form. Once the respondent had answered all seven RRT questions, they were asked to fill in the sociodemographic and fishing experience sections of the survey form. Finally, the respondent deposited their survey form with the others in a clear ballot box.
Randomized response technique survey questions.

The RRT questions on size, daily and annual limits were designed to estimate non-compliance with three of the most common violation types encountered by enforcement. As all unlicensed take is illegal take, RRT 1 was an important question to include. RRT questions 5–7 were designed to illustrate the severity of daily take limit violation among non-compliant fishers.
Survey data analysis
After data collection, a simple probability equation (Fox & Tracy Reference Fox and Tracy1986) was used to determine the proportion of users Xx who answered ‘yes’ to the sensitive question:

where πy = known proportion of non-sensitive behaviour (=0.5, i.e. flipping heads in the coin toss), λ = recorded proportion of ‘yes’ responses and p = probability of selecting the sensitive question (=0.5).
We then estimated variance Var(Xx) for the general population surveyed and for local fishers versus visitors with 95% confidence intervals:

where n = number of respondents.
Using data from all three sections of the survey, an estimate of the proportion of violators was analysed against regulation awareness and demographic questions to ascertain whether certain sectors of the fisher population were more prone to violating regulations. To determine if a certain sector of the fishing community engaged in illegal take at a significantly higher rate than other sectors, we used Mann-Whitney U tests to compare the age, fishing experience (number of years fishing) and frequency of fishing trips the previous season between those who gave ‘yes’ responses and those who responded ‘no’ in the RRT portion of the survey. A backwards stepwise likelihood ratio binary logistic regression was used to attempt to model ‘yes’ responses to the RRT survey question using the following sociodemographic variables as independent variables: fisher age, income, seasons fishing, times fishing in 2006 and county of residence.
We also examined the relationship between fisher awareness of each regulation and their response to the RRT question for the same regulation. We used a Mann-Whitney U test to explore for any significant differences in the mean regulation awareness of fishers who replied ‘yes’ versus ‘no’ to the RRT questions, to determine if awareness of laws differed among compliant and non-compliant fishers. A cross-tabulation was also used to look for relationships between answering incorrectly to the regulation awareness questions and the likelihood of answering with the target response (‘yes’) to the RRT questions. This information would reveal whether ignorance of regulations increased the likelihood of non-compliance.
RESULTS
We approached 340 fishers to participate in this survey; the final response rate was 82% (279 of 340) and 92% of respondents were male. Caucasian fishers were the majority (74%), followed by fishers of Asian decent (10% Chinese, 5% Japanese, 5% other Asian), Hispanics (4%) and Native Americans (2%). Response rates for the survey were affected by the ability of the respondent to speak and read English, and 8% of the abalone fishers who were approached, primarily those of Asian descent, did not participate for this reason. On average, the survey took respondents eight minutes to complete. The average annual income (US$ 51 000–75 000), fishing experience (13 seasons fished) and age (43.5) of the fishers surveyed were representative of the total fishing population (Kalvass Reference Kalvass2007).
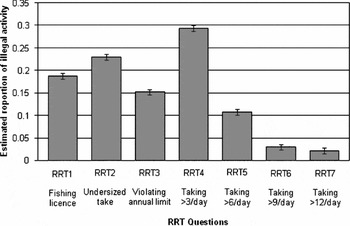
RRT results for the entire sample illustrate where non-compliance is greatest overall (see Fig. 1). This information can help prioritize violations in order of concern for management of the general population. Daily violations are proportionally the most common, with 29% of fishers estimated to have violated daily take limits in 2006, followed by size limits (23%), licensing laws (19%) and annual limits (15%).
Estimated proportion (± 0.05) of non-compliance with different abalone recreational fishing regulations (see Table 1 for list of questions).

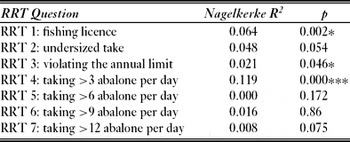
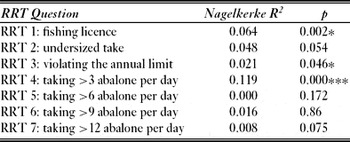
Using the backward stepwise likelihood ratio logistic regression analysis, we found no sociodemographic variables that were consistently good predictors of violation across all RRT questions (see Table 2). No statistically significant predictors were identified for RRT 2 and RRTs 5–7. Overall, the regression models for RRT 1, 3 and 4 are significant, however the strength of fit of the models (R2 range from 0.02 to 0.12) indicates that they are unable to describe much of the variance in RRT responses.
Backward stepwise (likelihood ratio) logistic regression of RRT variables. *p < 0.05, **p < 0.01, ***p < 0.001.
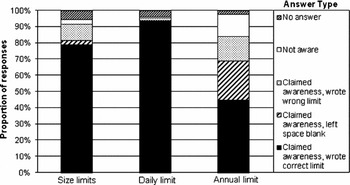
In comparing those who gave ‘yes’ responses with those who said ‘no’ in the RRT portion of the survey, we found no significant difference in age, income, fishing experience (number of years fishing), frequency of fishing trips the previous season or awareness of regulations. Both local and non-local fishers demonstrated high awareness of abalone regulations with over 80% acknowledging there were limits pertaining to all three categories (Fig. 3). Additionally, with the exception of the annual limit question, over 75% were able to correctly recite limit numbers from memory. Furthermore, a cross-tabulation of the data revealed no significant relationship between answering incorrectly to the regulation awareness questions and the likelihood of responding ‘yes’ to the survey questions.
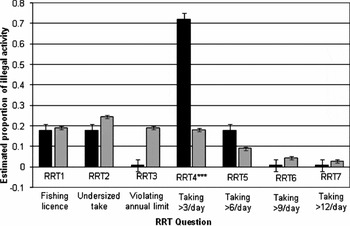
However, county of residence was significant when comparing ‘yes’ and ‘no’ respondents for RRT questions 3 (annual take limit) and 4 (daily take limit). The 59 surveys that identified their county of residence as Sonoma or Mendocino were termed ‘locals’, and compared to the 220 responses from ‘visitors’, living outside these counties. The number of locals to visitors was representative of the overall abalone fisher population according to punch card data (Kalvass Reference Kalvass2006; Kalvass & Geibel Reference Kalvass and Geibel2006), with locals making up 21% of abalone fishers surveyed (CDFG 2005). However, owing to the smaller sample size of surveys identified as locals, the RRT estimates for that group have broader confidence intervals. We estimate that less than 1% of locals violated the annual limit of 24 abalone (RRT 3) in the 2006 season, as opposed to 19% of non-locals (Fig. 2). Conversely, cross-tabulation shows locals (estimated as 72% violating) are significantly more likely than non-locals (estimated as 18% violating) to take more than three abalone per day (RRT 4; Φ = 0.225, p < 0.001).
Comparison of estimated violation rates (± 0.05) for ‘local’ versus ‘visitor’ abalone fishers in Northern California (see Table 1 for list of questions). Black bars = locals, grey bars = visitors; *** difference between bars p < 0.001.

DISCUSSION
Previous estimates of illegal activity in the Northern California red abalone fishery have not provided managers with information about non-compliance rates for specific regulations, or data regarding which sociodemographic variables may affect violation behaviour (L. Rogers-Bennett, personal communication 2007). In a relatively short period of time, and with limited human resources, we were able to use RRT to produce comparable estimates of non-compliance for four fishery regulations. The results of this study provide critical baseline estimates of non-compliance which can help set priorities for conservation action and may be compared against future studies to monitor the effectiveness of management interventions.
The red abalone managers in northern California have used many different management tools, such as biological monitoring of the abalone stocks, mandatory abalone permit report cards, fishing seasons, gear restrictions and take limits. These tools are intended to protect the species from detrimental harvesting effects, but without assessing the success of individual regulations, managers cannot be sure they are managing efficiently. The general results of the RRT survey, unlike the previous methods employed in the fishery, can be used to rank violation types and illustrate compliance problems. The regulations in order of decreasing estimated violation rate are: daily limit (29% estimated to take more than three abalone per day, 11% had taken more than six, 3% had taken more than nine and 2% had taken over 12), minimum size limit (23% non-compliance), fishing licensing laws (19%) and annual take limit of 24 abalone per year (15%). Managers can use these baseline violation rates, in combination with estimates of the relative biological impacts of different violation types, the costs of different kinds of interventions and the potential effectiveness of those interventions, in order to prioritize conservation action (Mittermeier et al. Reference Mittermeier, Myers, Thomsen, da Fonseca and Olivier1998)
In addition, information about the regulatory awareness and sociodemographics of a typical violator can aid managers with priority setting by illustrating which sectors are the least compliant and allowing them to focus resources on encouraging compliance within those groups (Hønneland Reference Hønneland1999; Sumaila et al. Reference Sumaila, Alder and Keith2006). For example, the fishers we surveyed generally possessed very high levels of knowledge regarding abalone fishing regulations (Fig. 3), indicating that abalone control measures are being successfully conveyed by managers. We also found no significant relationship between regulation awareness and RRT responses, indicating that those fishers who knew abalone regulations were just as likely to admit to illegal behaviour as those who did not know the regulations. This is an important finding in terms of management priority setting, because it implies that awareness-building alone is not the solution, and suggests that managers are succeeding in communicating regulations to English-speaking fishers.
Fisher awareness of regulations.

Our results also point to some critical differences between local and visiting fishers in relation to certain violation types. Local fishers violate the daily limit to a greater extent than visiting fishers, but locals are proportionally more compliant with other regulations. This is a surprising result because locals have easier access to abalone, and, therefore, we might expect them to take more animals throughout the year. However, the difference in local versus non-local compliance could reflect different normative and economic drivers operating between locals and visitors (Sumaila et al. Reference Sumaila, Alder and Keith2006; Stern Reference Stern2008). Locals may have a greater interest in sustainability, a heightened awareness of the likelihood of being caught violating by government and community-based enforcement, or a greater knowledge of the penalties than visiting fishers, albeit knowledge of fishing regulations is identical between these groups.
Our results identify priority areas of non-compliance that red abalone managers should address. Firstly, they should improve compliance with the daily take limit, especially amongst local fishers. Many fishers exceed the daily take limit and red abalone populations may suffer from point source depletion; reduced adult densities could result in poor abalone recruitment in those areas for years to come (Karpov et al. Reference Karpov, Haaker, Taniguchi and Rogers-Bennett2000). The general RRT estimate and the conservation goals discussed in the Abalone Recovery and Management Plan suggest that management should also focus more effort on improving compliance with the annual take limit (CDFG 2005). Furthermore, the estimate that only 1% of local fishers violate the annual limit implies that managers should prioritize efforts on reducing non-compliance among visiting fishers, which may involve shifting resources to target this group.
The results suggest red abalone managers in Northern California continue to use RRT to estimate non-compliance in the fishery. This method has resulted in estimates of proportional violation rates for four regulation types, allowing management priorities to emerge. Previous enforcement data, self-reporting techniques, direct questioning and biological surveys failed to achieve reliable non-compliance estimates for individual violation types (L. Rogers-Bennett, personal communication 2007; Kalvass, Reference Kalvass2007). The shortage of non-compliance data for this fishery made it impossible to directly compare RRT estimates with estimates from other monitoring tools, but this study demonstrates that RRT can provide rapid baseline data against which future estimates may be compared. Future comparisons could provide managers with a reliable way to assess the impact of new measures on compliance, and may therefore aid in monitoring compliance levels for adaptive management.
RRT is well suited to studies investigating non-compliance with natural resource protection measures because it reduces evasive responses, resulting in more accurate estimates of illegal behaviour than other methods, and is cost effective, allowing for estimation on site with few materials required (Wahl Reference Wahl1995; Solomon et al. Reference Solomon, Jacobson, Wald and Gavin2007). Furthermore, the format of the survey is technically simple and can be taught quickly to research assistants. RRT can also be easily adapted for areas with low literacy rates by replacing written question cards, responded to on self-administered questionnaire forms, with photos of illegal and innocuous behaviours, administered with face-to-face questionnaires (Solomon et al. Reference Solomon, Jacobson, Wald and Gavin2007). However, using RRT to estimate illegal resource use does have some limitations. RRT is best suited for scenarios with a large number of resource users (such as recreational instead of commercial fisheries), where resource users are aggregated and easily contacted (Fox & Tracy Reference Fox and Tracy1986). RRT results are still likely to be underestimates of actual illegal take, because the assumption is that there will still be participants who give evasive responses regardless of the survey instrument (Chaloupka Reference Chaloupka1985). Additionally, because RRT uses probability, it is characterized by larger variance than direct questioning or observation (Fox & Tracy Reference Fox and Tracy1986). While mechanical error and the belief of trickery by respondents can hinder the effectiveness of RRT, both of these issues can be reduced if interviewers are well trained at explaining the method and the tools used are culturally appropriate (I-Cheng et al. Reference I-Cheng, Chow and Rider1972; Lensvelt-Mulders et al. Reference Lensvelt-Mulders, Hox, van der Heijden and Maas2005; Solomon et al. Reference Solomon, Jacobson, Wald and Gavin2007).
Natural resource managers should explore several other potential uses of RRT. Future research with RRT could tie violation proportions to specific locations and dates, in order to determine the sites with the greatest level of violations on a given survey day. These data would allow managers to target non-compliance more efficiently, and would provide additional information about which areas could be suffering over use or point source depletion. Future studies could also use RRT to investigate the degree to which compliance may be affected by normative influences, such as social norms and peer pressure (Hønneland Reference Hønneland1999; Sumaila et al. Reference Sumaila, Alder and Keith2006). RRT methods have already been developed which could quantify illegal take, and they could be readily adapted to analyse both marine and terrestrial natural resource exploitation (Fox & Tracy Reference Fox and Tracy1986). In the case of fisheries, an illegal take estimate generated with RRT could be used to assess the TAC and monitor sustainability. RRT is a powerful method for analysing illegal resource use and setting priorities for conservation, and should be added to the toolbox of natural resource managers, including those involved with fisheries’ management.
ACKNOWLEDGEMENTS
We thank the staff of the California Department of Fish and Game who gave of their time and expertise. Additionally, we thank J.R. Radecki and K. Thomasson for their field assistance. We gratefully acknowledge funding from the Faculty of Science, Victoria University of Wellington, New Zealand. Finally, we thank our three anonymous reviewers for helpful input on the manuscript.