


Introduction – domestication of pea
Pea (Pisum sativum L.) is one of the world's oldest domesticated crops. It is the third most widely grown legume, as its seeds serve as a protein-rich food for humans and livestock alike. Domesticated about 10,000 years ago (Ambrose, Reference Ambrose1995; Zohary and Hopf, Reference Zohary and Hopf2000), pea is currently cultivated in temperate zones worldwide. Centuries of selection and breeding have resulted in thousands of pea varieties many of which are maintained in numerous germplasm collections worldwide (Smýkal et al., Reference Smýkal, Coyne, Ford, Redden, Flavell, Hýbl, Warkentin, Burstin, Duc, Ambrose and Ellis2008b). Pea (P. sativum L.) was used in the earliest of genetic studies, most famously by Mendel (Reference Mendel1866) and previously by Knight (Reference Knight1799). However, owing to its large genome size (4000 Mb) and the high occurrence of repetitive sequences (Macas et al., Reference Macas, Neumann and Navrátilová2007), much of the recent progress in molecular genetics and genomics has not been conducted on pea.
Pisum within tribe Fabeae
Reconstructing the phylogenetic relationship of the Leguminosae is essential to understanding the origin and diversification of this economically and ecologically important family. The monophyly of the family (Leguminosae/Fabaceae) as a natural group has never been in doubt, but it was not until the phylogenetic analyses of groups such as Kass and Wink (1996, Reference Kass and Wink1997) and Doyle et al. (Reference Doyle, Doyle, Ballenger, Dickson, Kajita and Ohashi1997) that the group's monophyly was demonstrated through molecular DNA sequence data. Since then, molecular phylogenetic research has provided a solid understanding of relationships at all levels in the family (Lewis et al., Reference Lewis, Schrirer, Mackinder and Lock2005). Tribe Fabeae (syn. Vicieae) is considered one of the most advanced groups in the legumes (Kupicha, Reference Kupicha, Polhill and Raven1981; Steele and Wojciechowski, Reference Steele, Wojciechowski, Klitgaard and Bruneau2003; Wojciechowski et al., Reference Wojciechowski, Lavin and Sanderson2004; Lock and Maxted, Reference Lock, Maxted, Lewis, Schrire, Mackinder and Lock2005), and one of the most recently evolved. Estimates based on rates of evolution in the maturase K (matK) chloroplast gene place the age of the crown clade at 17.5 Mya in the mid-Miocene (Lavin et al., Reference Lavin, Herendeen and Wojciechowski2005). The centre of diversity and posited area of origin is the Eastern Mediterranean (Kupicha, Reference Kupicha, Polhill and Raven1981; Kenicer, Reference Kenicer2007). The tribe contains five genera, including Vicia with most of the ancient Old-World grain legume crops: Lathyrus (grass pea/sweet pea; about 160 species); Lens (lentils; 4 species); Pisum (peas; 3 species); Vicia (vetches; about 140 species) (Steele and Wojciechowski, Reference Steele, Wojciechowski, Klitgaard and Bruneau2003; Lock and Maxted, Reference Lock, Maxted, Lewis, Schrire, Mackinder and Lock2005; Endo et al., Reference Endo, Choi, Ohashi and Delgado-Salinas2008; Kenicer et al., Reference Kenicer, Smýkal and Mikič2008; Smýkal et al., Reference Smýkal, Kenicer and Mikič2009a) (Fig. 1).
Phylogeny of Fabeae tribe, based on chloroplast and ITS DNA sequence data.

Morphology-based classifications of Pisum
The classification of Pisum L. based on morphology and karyology has changed over time from a genus with five species (Govorov, Reference Govorov1937) to a monotypic genus (Lamprecht, Reference Lamprecht1966; Marx, Reference Marx, Sutcliffe and Pate1977). While Davis (Reference Davis and Davis1970) recognized two species, P. fulvum Sibth. & Sm. and P. sativum L., both native to Turkey, he did not consider the third putative species P. abyssinicum A. Br., which is endemic to Yemen and Ethiopia. Subsequently, the nomenclature of the group is complex, and numerous names have been proposed for wild representatives of P. sativum. However, only three have been used to denote taxa of subspecies or species rank: P. elatius Bieb. (Bieberstein, Reference Bieberstein1808), P. humile Boiss. & Noe and P. syriacum Boiss. & Noe. (Makasheva, Reference Makasheva and Korovina1979). P. elatius was classified as a subspecies first by Schmalhausen (Reference Schmalhausen1895), although many authors ascribe this to Ascherson and Graebner (Reference Ascheron and Graebner1910). P. humile was described by Boissier and Noe (Reference Boissier1856) and given a name used earlier by Miller (Reference Miller1768) for a form of cultivated pea. Berger (Reference Berger and Hedrick1928) downgraded the rank to subspecies and gave it a new name: P. sativum subsp. syriacum (Boissier and Noe) Berger. Its status was again raised to species by Lehmann (Reference Lehmann1954), though this remained unsupported. Crossing experiments undertaken by Ben-Ze'ev and Zohary (Reference Ben-Ze'ev and Zohary1973) partially clarified relationships among four species recognized by Boissier (Reference Boissier1856) – sativum, elatius, humile and fulvum – while wider hybridization experiments between Lathyrus and Pisum species have shown cross-incompatibility (Ochatt et al., Reference Ochatt, Benabdelmouna, Marget, Aubert, Moussy, Pontecaille and Jacas2004). The domestication of cultivated pea from northern populations of ‘humile’ was proposed by Ben-Ze'ev and Zohary (Reference Ben-Ze'ev and Zohary1973), but the source could just as likely be the ‘northern elatius’ (Kosterin et al., Reference Kosterin, Zaytseva, Bogdanova and Ambrose2010). A thorough description of the genus was performed by Makasheva (Reference Makasheva and Korovina1979) based on morphological, ecological and some biochemical data. This placed Pisum together with Vicia and Lathyrus. The ancestor of Vavilovia formosa was placed as the last common ancestor for all three genera, from which an extinct perennial and later an annual Pisum ancestor evolved (Fig. 2). The more recent and most used classification of Maxted and Ambrose (Reference Maxted, Ambrose, Maxted and Bennett2000) adopted three species:
● P. sativum L.
● Subsp. sativum (includes var. sativum and var. arvense)
● Subsp. elatius (Bieb.) Aschers. & Graebn (includes var. elatius, var. brevipedunculatum and var. pumilio)
● P. fulvum Sibth. & Sm.
● P. abyssinicum A. Br.
Hypothetical origin of Pisum, according to Makasheva (Reference Makasheva and Korovina1979).
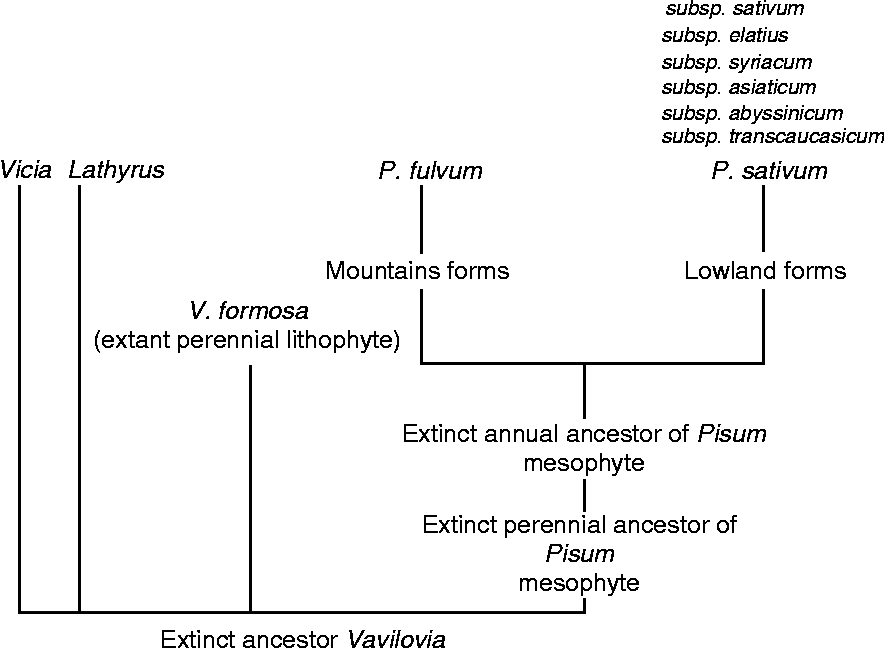
This classification is accepted in this paper.
The taxonomic position of P. abyssinicum is often discussed, namely whether this lineage has diverged sufficiently from other taxa to be considered a separate species or whether it should be placed within P. sativum as a subgroup (Maxted and Ambrose, Reference Maxted, Ambrose, Maxted and Bennett2000). Based on morphological characteristics, Govorov (Reference Govorov1937) labelled it a separate cultivated species, while Makasheva (Reference Makasheva and Korovina1979) regarded it as a subspecies. A serious karyologic barrier for crossing to P. sativum (Ben-Ze'ev and Zohary, Reference Ben-Ze'ev and Zohary1973) and clear-cut phenotypic differences support the view of its species status (Lamprecht, Reference Lamprecht1963). Although its origin is not fully understood, it has been proposed that it was domesticated independently 4000–5000 years ago in Early or Middle-Kingdom Egypt (Vershinin et al., Reference Vershinin, Allnutt, Knox, Ambrose and Ellis2003; Jing et al., Reference Jing, Vershinin, Grzebyta, Shaw, Smýkal, Marshall, Ambrose, Ellis and Flavell2010).
Pisum classification based on molecular data
Early data from electrophoretic patterns of albumin and globulin (Waines, 1975) and chloroplast DNA polymorphism (Palmer et al., Reference Palmer, Jorgensen and Thompson1985) have separated P. fulvum as a distinct species and P. sativum as an aggregate of ‘humile’, P. elatius and P. sativum. Recent phylogenetic studies based on retrotransposon insertion markers support the model of P. elatius as a paraphyletic group, within which all P. sativum is nested (Vershinin et al., Reference Vershinin, Allnutt, Knox, Ambrose and Ellis2003; Jing et al., Reference Jing, Knox, Lee, Vershinin, Ambrose, Ellis and Flavell2005, Reference Jing, Vershinin, Grzebyta, Shaw, Smýkal, Marshall, Ambrose, Ellis and Flavell2010). The study by Hoey et al. (Reference Hoey, Crowe, Jones and Polans1996) using morphological, allozyme and random amplification of polymorphic DNA (RAPD) characteristics on a set of Ben-Ze'ev and Zohary (Reference Ben-Ze'ev and Zohary1973) accessions resulted in separation of P. fulvum and ‘southern’ humile, while cultivated peas were grouped among P. elatius accessions. The position of ‘northern’ humile varied between a sister group to cultivated peas and P. elatius. More recently, studies of internal transcribed spacer (ITS) sequence variation have supported this (Saar and Polans, Reference Saar and Polans2000; Polans and Saar, Reference Polans and Saar2002). Extensive phylogenetic relationships between pea forms were reconstructed by Ellis et al. (Reference Ellis, Poyser, Knox, Vershinin and Ambrose1998), Pearce et al. (Reference Pearce, Knox, Ellis, Flavell and Kumar2000) and Vershinin et al. (Reference Vershinin, Allnutt, Knox, Ambrose and Ellis2003) using both amplified fragment length polymorphism (AFLP) and its derived retrotransposon insertion-based marker method, sequence-specific amplification polymorphisms (SSAP). Using these approaches, P. fulvum and P. abyssinicum formed neighbouring but separate branches, a subset of P. elatius was positioned between P. fulvum and P. abyssinicum, and further branches were found within cultivated pea. The most recent studies of P. abyssinicum place it between P. fulvum and a subset of P. elatius (Vershinin et al., Reference Vershinin, Allnutt, Knox, Ambrose and Ellis2003; Jing et al., Reference Jing, Vershinin, Grzebyta, Shaw, Smýkal, Marshall, Ambrose, Ellis and Flavell2010) and showed very low diversity in molecular analyses, which could be explained by passage through a bottleneck. A general feature of molecular phylogenetic analysis of Pisum has been the impact of introgression on pea diversity and evolution (Jing et al., Reference Jing, Johnson, Seres, Kiss, Ambrose, Knox, Ellis and Flavell2007). Moreover, good conservation between SSAP (Vershinin et al., Reference Vershinin, Allnutt, Knox, Ambrose and Ellis2003), retrotransposon insertions (Jing et al., Reference Jing, Knox, Lee, Vershinin, Ambrose, Ellis and Flavell2005) and gene-based derived (Jing et al., Reference Jing, Johnson, Seres, Kiss, Ambrose, Knox, Ellis and Flavell2007) trees was observed, in spite of the fact that they derive from different genomic components. The gene-based study showed that Pisum is a diverse genus with one polymorphic site every 15 bp on average. Linkage disequilibrium (LD) analysis has suggested that, owing to recombination, different genetic loci display very different pictures of genetic diversity. Another study on relationships among wild Pisum forms used a combination of mitochondrial, chloroplast and nuclear genome markers (Kosterin and Bogdanova, Reference Kosterin and Bogdanova2008; Kosterin et al., Reference Kosterin, Zaytseva, Bogdanova and Ambrose2010), separating P. fulvum and P. abyssinicum accessions and about half of those of wild P. sativum from the rest of the wild and all cultivated P. sativum . The distinction within P. sativum coincided with the cytogenetic classes of Zohary and Ben-Ze'ev (1973). However, a comparison of results between different phylogenetic analyses is limited and difficult due to differences in studied accessions as well as markers. Moreover, incomplete information on taxonomic attribution and the origin of wild accessions hinder such studies.
Phylogeography of the Pisum genus
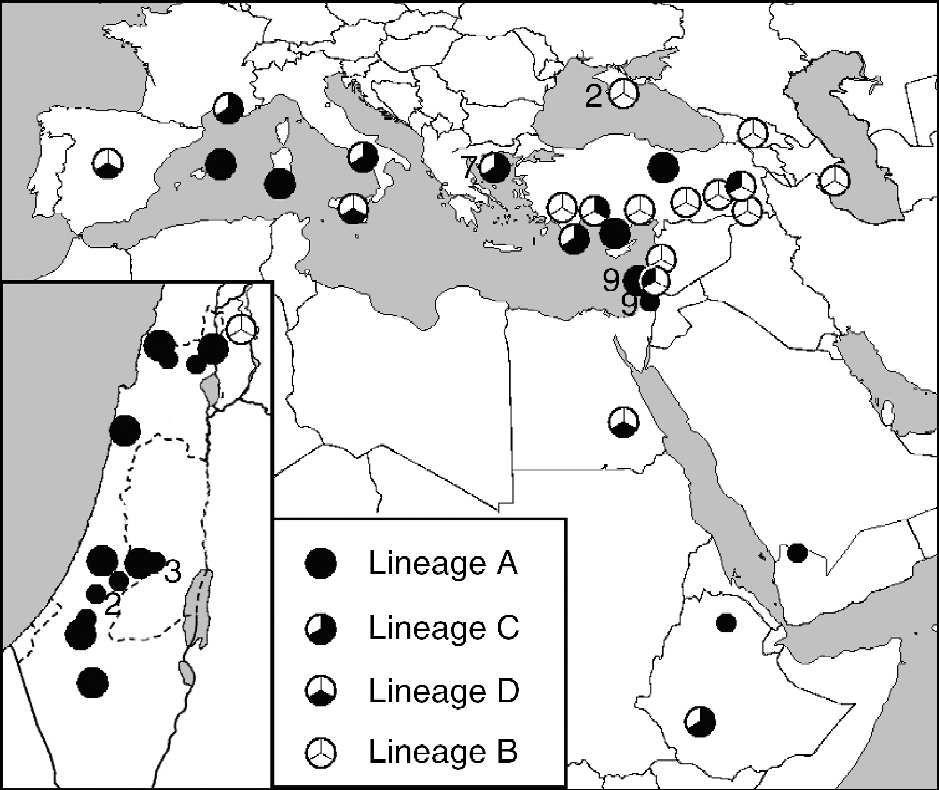
The geographical range of wild representatives of P. sativum extends from Iran and Turkmenistan through Anterior Asia, northern Africa and southern Europe (Makasheva, Reference Makasheva and Korovina1979; Maxted and Ambrose, Reference Maxted, Ambrose, Maxted and Bennett2001; Maxted et al., Reference Maxted, Hargreaves, Kell, Amri, Street, Shehadeh, Piggin and Konopka2010). However, due to their early cultivation, it is often difficult to identify the precise location of the centre of diversity, especially considering that large parts of the Mediterranean region and Middle East have been substantially modified by human activities and changing climatic conditions. Moreover, reliable and thorough passport data are often missing or incomplete, especially for valuable older acquisitions gained through expeditions. Thus, some so-called ‘wild accessions’ may simply have escaped cultivation. Furthermore, as in other crops, wild species are often found in secondary habitats as weeds and in direct contact with domesticated pea (sympatric), resulting in spontaneous hybridizations between cultivars and wild forms (Ben Ze'ev and Zohary, Reference Ben-Ze'ev and Zohary1973). As stated earlier, it is widely accepted that the genus Pisum contains the clear-cut and rather homogenous wild species P. fulvum Sibth. et Smith. found in Jordan, Syria, Lebanon and Israel. It also contains cultivated subspecies P. sativum subsp. abyssinicum A. Br. from Yemen and Ethiopia (Westphal, Reference Westphal1974), which was domesticated independently of P. sativum (Jing et al., Reference Jing, Vershinin, Grzebyta, Shaw, Smýkal, Marshall, Ambrose, Ellis and Flavell2010). Lastly, the Pisum genus contains a large and loose aggregate of both wild (P. sativum subsp. elatius) and cultivated forms that comprise the wild species P. sativum L. in a broad sense. Both P. fulvum and P. abyssinicum differ from P. sativum by several chromosomal rearrangements, which make them nearly incompatible with P. sativum. Hybridization between them is also hampered by nuclear–cytoplasmic conflict (Bogdanova, Reference Bogdanova2007; Bogdanova et al., Reference Bogdanova, Galieva and Kosterin2009). Analysis using three dimorphic nuclear, plastid or mitochondrial markers was performed, and four contrasting combinations of alleles (lineages A to D) were introduced (Kosterin and Bogdanova, Reference Kosterin and Bogdanova2008; Kosterin et al., Reference Kosterin, Zaytseva, Bogdanova and Ambrose2010). These authors proposed a scenario for the evolution of wild P. sativum and its domestication in which the ancestral state of the genus (combination A) originated in the eastern Mediterranean, based on the present area of this lineage in Israel, Lebanon, Syria and southern Turkey. Here, P. sativum grows often sympatrically with P. fulvum, which also has combination A. P. abyssinicum, another taxon with exclusively combination A, occurs in Yemen and Ethiopia. It was proposed that the westward spread of lineage A occurred during the Pleistocene, when the sea occupied less area. The accessions with combination A found on Sardinia and Menorca are thought to represent island refugia of early spread. During this westward dispersal, lineage C appeared and spread over the central and western Mediterranean areas and northeastern Africa. The representatives of lineage D were found in Egypt (cultivated), Sicily and Turkey (wild), while the lineage B was located near the Black Sea (Kosterin et al., Reference Kosterin, Zaytseva, Bogdanova and Ambrose2010) (Fig. 3). Thus, Asia Minor was an area affected by two opposite spreading waves of peas: that of lineage A from the south and that of lineage B from the north. It was suggested that it was in the West and/or Central Mediterranean where the transition between lineages A and B took place, and that this transition left intermediate descendants (Kosterin et al., Reference Kosterin, Zaytseva, Bogdanova and Ambrose2010). Jing et al. (Reference Jing, Vershinin, Grzebyta, Shaw, Smýkal, Marshall, Ambrose, Ellis and Flavell2010), using retrotransposon markers, proposed a related model whereby a subset of P. elatius was selected by early farmers in the Fertile Crescent and grown extensively, thus broadening its distribution across Southern Eurasia and additionally differentiating in two opposite directions. The first of these was an expansion eastwards into the Indian subcontinent and the Himalayan regions, subsequently giving rise to the diverged Afghan P. sativum ecotypes found today. A second proposed diversification of another strand of P. elatius-derived primitive P. sativum was the main domestication route that gave rise to the mainstream of modern cultivated Pisum. Jing et al. (Reference Jing, Vershinin, Grzebyta, Shaw, Smýkal, Marshall, Ambrose, Ellis and Flavell2010) further concluded that P. abyssinicum derived from a cross between P. fulvum and a third subset of the diverse P. elatius species in the western half of the Fertile Crescent. A small sample was then transferred by humans to northeastern Africa (introducing the bottleneck mentioned above), where it was developed into the modern P. abyssinicum.
Phylogeography of P. fulvum, P. abyssinicum (small circles) and wild P. sativum subsp. elatius) accessions with indication of alleles of the three markers studied (taken from Kosterin et al., Reference Kosterin, Zaytseva, Bogdanova and Ambrose2010). Lineage A, Anterior Asia, islands (cox1+, rbcL+ and SCA f); lineage B, Tauro-Caucasian area, Turkey (cox1-, rbcL- and SCA s); lineage C, Mediterranean (France and Greece), Ethiopia (cox1-, rbcL+ and SCA f); lineage D, Egypt, Sicily, Spain (cox1-, rbcL- and SCA f).
Genetic diversity of Pisum germplasm collections
Accessions of pea have been collected and maintained within several major collections worldwide (Smýkal et al., Reference Smýkal, Coyne, Ford, Redden, Flavell, Hýbl, Warkentin, Burstin, Duc, Ambrose and Ellis2008b). These include the John Innes Centre (JIC), UK (3557 accessions); the Nordic GeneBank, Sweden (2724 accessions); the United States Department of Agriculture (USDA), USA (5404 accessions); the International Center for Agricultural Research in the Dry Areas (ICARDA), Syria (6105 accessions); Instituto del Germoplasma, Bari, Italy (4297 accessions); Leibnitz Institute of Plant Genetics and Crop Plant Research, Germany (5336 accessions); the Australian Temperate Field Crops Collection (ATFC), Australia (6567 accessions); the Vavilov Institute of Plant Breeding, Russia (6790 accessions); and the National Genebank of China, China (3837 accessions). Simple sequence repeats (SSRs or microsatellites) have been popular for assessing Pisum diversity because of their high polymorphism and information content, co-dominance and reproducibility (Burstin et al., Reference Burstin, Deniot, Potier, Weinachter, Aubert and Baranger2001; Ford et al., Reference Ford, Le Roux, Itman, Brouwer and Taylor2002; Baranger et al., Reference Baranger, Aubert, Arnau, Lainé, Deniot, Potier, Weinachter, Lejeune-Hénaut, Lallemand and Burstin2004; Loridon et al., 2005; Ta'ran et al., Reference Tar'an, Zhang, Warkentin, Tullu and Vandenberg2005; Smýkal et al., Reference Smýkal, Hýbl, Corander, Jarkovský, Flavell and Griga2008a; Zong et al., Reference Zong, Redden, Liu, Wang, Guan, Liu, Xu, Liu, Gu, Yan, Ades and Ford2009; Nasiri et al., Reference Nasiri, Haghnazari and Saba2009). On the other hand, microsatellites have high mutation rates (Vigouroux et al., Reference Vigouroux, Jaqueth, Matsuoka, Smith, Beavis, Smith and Doebley2002; Raquin et al., Reference Raquin, Depaulis, Lambert, Galic, Brabant and Goldringer2008) and suffer from homoplasy (Bhargava and Fuentes, Reference Bhargava and Fuentes2010), e.g. a state in which alleles are identical, but not identical by descent. Also, SSR primers are often difficult to transfer for assessing the relationships among related taxa, as previously shown between P. sativum and P. fulvum (Ford et al., Reference Ford, Le Roux, Itman, Brouwer and Taylor2002). As the Pisum genus is very diverse, this suggests that the risk of homoplasy in wide surveys of pea germplasm using microsatellites is high. Other marker types used for diversity studies include retrotransposon-based methods, such as SSAP (Ellis et al., Reference Ellis, Poyser, Knox, Vershinin and Ambrose1998) and inter-retrotransposon amplified polymorphism (Kalendar and Schulman, Reference Kalendar and Schulman2006; Smýkal, Reference Smýkal2006). Both suffer from a dominant nature and show band intensity variation, leading to reproducibility problems. Alternatively, insertion site polymorphism of the PDR1 Ty1-copia group retrotransposon (Lee et al., Reference Lee, Ellis, Turner, Hellens and Cleary1990) has been investigated by SSAP linkage and diversity analysis (Ellis et al., Reference Ellis, Poyser, Knox, Vershinin and Ambrose1998; Pearce et al., Reference Pearce, Knox, Ellis, Flavell and Kumar2000). Ellis et al. (Reference Ellis, Poyser, Knox, Vershinin and Ambrose1998) found that AFLP and SSAP methods were in strong agreement, but AFLP overestimated variation. An alternative marker system based on scoring presence and absence of individual retrotransposon insertions (RBIP) gives greater power for phylogeny and genetic relationship studies in pea and is suitable for in-depth phylogeny and germplasm diversity studies (Jing et al., Reference Jing, Knox, Lee, Vershinin, Ambrose, Ellis and Flavell2005, Reference Jing, Vershinin, Grzebyta, Shaw, Smýkal, Marshall, Ambrose, Ellis and Flavell2010). Jing et al. (Reference Jing, Johnson, Seres, Kiss, Ambrose, Knox, Ellis and Flavell2007) showed good correlation among SSAP (Vershinin et al., Reference Vershinin, Allnutt, Knox, Ambrose and Ellis2003) and RBIP (Jing et al., Reference Jing, Knox, Lee, Vershinin, Ambrose, Ellis and Flavell2005) studies by assessing single nucleotide polymorphisms (SNPs) in 49 genes. All of the mentioned markers and trait loci were used to develop and integrate genetic maps (Ellis and Poyser, Reference Ellis and Poyser2002; Loridon et al., 2005). Recently, opportunities have arisen through advances in the sequencing of model legumes Medicago truncatula and Lotus japonica. The synteny between these genomes and that of Pisum has been demonstrated by functional mapping (Aubert et al., Reference Aubert, Morin, Jacquin, Loridon, Quillet, Petit, Rameau, Lejeune-He'naut, Huguet and Burstin2006). Many molecular studies have indicated that Pisum is very diverse and that the structured diversity reflects taxonomic identifiers, ecogeography and breeding gene pools. These studies show the pattern of diversity within which Pisum is consistent with the taxonomic scheme of Maxted and Ambrose (Reference Maxted, Ambrose, Maxted and Bennett2001), with the exception of ‘elatius’ ranked as a subspecies of P. sativum, rather than of equal rank. P. elatius in either sense includes a greater diversity than P. sativum subsp. sativum, likely due to the fact that P. sativum subsp. sativum is the cultigen, domesticated from a wild ancestor, probably a type (or types) of P. elatius. It would seem more reasonable to position P. sativum subsp. sativum subordinate to P. elatius. Moreover, Pisum is capable of genetic exchange (Maxted and Ambrose, Reference Maxted, Ambrose, Maxted and Bennett2001), as supported by studies of Jing et al. (Reference Jing, Knox, Lee, Vershinin, Ambrose, Ellis and Flavell2005, Reference Jing, Vershinin, Grzebyta, Shaw, Smýkal, Marshall, Ambrose, Ellis and Flavell2010) and Vershinin et al. (Reference Vershinin, Allnutt, Knox, Ambrose and Ellis2003), which showed that allelic introgression between very diverse material occurs, suggesting the view of Pisum as one species.
Using the molecular methods, several major world pea germplasm collections have been analyzed and core collections were formed. In summary, over 2000 accessions of the Chinese collection have been analyzed by 21 SSR loci (Zong et al., Reference Zong, Redden, Liu, Wang, Guan, Liu, Xu, Liu, Gu, Yan, Ades and Ford2009); 310 USDA pea accessions have been assessed by 37 RAPD and 15 SSR markers (Coyne et al., Reference Coyne, Brown, Timmerman-Vaughan, McPhee and Grusak2005 and unpublished). Similarly, The French National Institute for Agricultural Research used 121 protein and SSR markers to genotype 148 accessions (Baranger et al., Reference Baranger, Aubert, Arnau, Lainé, Deniot, Potier, Weinachter, Lejeune-Hénaut, Lallemand and Burstin2004; Loridon et al., 2005), and the Crop Development Centre Canada pea collection (~100 accessions) was studied by RAPD, Inter simple sequence repeats and SSR (Ta'ran et al., Reference Tar'an, Zhang, Warkentin, Tullu and Vandenberg2005). Almost the entire JIC pea germplasm (3029 accessions), consisting of a broad balance of cultivars (33%), landraces (19%), wild accessions (13%) and genetic stocks (26%), was analyzed using 45 RBIP markers (Jing et al., Reference Jing, Vershinin, Grzebyta, Shaw, Smýkal, Marshall, Ambrose, Ellis and Flavell2010); and 1283 pea accessions, representing much of the cultivated pea diversity, held at the Czech National Pea Germplasm collection (CzNPC), were genotyped using a combination of 25 RBIPs and 10 SSRs (Smýkal et al., Reference Smýkal, Hýbl, Corander, Jarkovský, Flavell and Griga2008a and in preparation). The latter study has shown that both SSRs and RBIPs have similarly high information content and offer comparable diversity measurements. This is an important finding, as SSRs are more difficult to transfer between laboratories and suffer from homoplasy.
Data processing – analysis of genetic diversity structure
Altogether a large number of polymorphic data points have been produced and analyzed; however, the extended use of such data is limited, especially in the absence of cross-comparison between collections. Thus, an international initiative was formed to coordinate the international Pisum research community (Furman et al., Reference Furman, Ambrose, Coyne and Redden2006; Smýkal et al., Reference Smýkal, Coyne, Ford, Redden, Flavell, Hýbl, Warkentin, Burstin, Duc, Ambrose and Ellis2008b) in order to allow combining available datasets into a virtual global pea collection and the development of a dispersed international reference pea collection. Such a collection would provide a useful and powerful resource for generation of next generation markers, such as SNPs, or even whole genome sequencing and, more importantly, phenotypic analysis. These would act as toolkits for association mapping and offer a strategy to gain insight into genes and genomic regions underlying desired traits.
Other than conventional linkage mapping based on time-consuming mapping population development, LD mapping, which uses the non-random associations of loci in haplotypes, is a powerful, high-resolution tool for elucidating complex quantitative traits. In contrast to biparental crosses, the higher resolution and the possibility of historical trait data exploitation indicate and provide enormous potential for the LD method in crop breeding and genetics.
Improvements in marker methods have been accompanied by refinements in computational methods to convert raw data into useful representations of diversity and genetic structure. Still, largely used distance-based methods have been challenged by model-based approaches. In particular, Bayesian inference of phylogeny has become popular in the field of population genetics (Pritchard et al., Reference Pritchard, Stephens and Donnelly2000; Rosenberg, Reference Rosenberg2002; Falush et al., Reference Falush, Stephens and Pritchard2003; Corander et al., Reference Corander, Waldmann and Sillanpää2003, Reference Corander, Waldmann, Marttinen and Sillanpää2004, 2005, 2006). This has revolutionized phylogeny estimation by incorporating probability, the provision for measure of support and, especially, complex model and data character processing (Huelsenbeck et al., Reference Huelsenbeck, Ronquist, Nielsen and Bollback2001; Holder and Lewis, 2003; Beaumont and Rannala, Reference Beaumont and Rannala2004; Corander et al., Reference Corander, Waldmann, Marttinen and Sillanpää2004). The high rate of genetic exchange within Pisum means that tree-like descriptions of variation patterns can be misleading because different markers produce different tree structures among the same genotype sets. Moreover, the composition of various data types, such as morphology and DNA-based data (Smýkal et al., Reference Smýkal, Hýbl, Corander, Jarkovský, Flavell and Griga2008a), supports the use of alternative approaches, such as principal coordinate or component analyses, multidimensional scaling and, particularly, modelling methods (Pritchard et al., Reference Pritchard, Stephens and Donnelly2000; Corander et al., Reference Corander, Waldmann and Sillanpää2003, 2004, 2006). Although applied largely in population genetics, their usefulness has also been demonstrated in germplasm genetic structure assessment, including in pea (Smýkal et al., Reference Smýkal, Hýbl, Corander, Jarkovský, Flavell and Griga2008a; Jing et al., Reference Jing, Vershinin, Grzebyta, Shaw, Smýkal, Marshall, Ambrose, Ellis and Flavell2010). Model-based analysis of population structure provides information that cannot be gained from distance-based analysis, which can introduce distortions and simplify relationships between members in complex clusters. Furthermore, these methods were introduced to overcome the constraint of accession partitioning between two distinct clusters, which is common in modern varieties with distant parent crosses. No direct computational comparison between distance- and model-based population structures is possible, since these methods rely upon different principles. Nevertheless, the utility and complementarity of these approaches have been shown (Rosenberg, Reference Rosenberg2002; Corander et al., Reference Corander, Waldmann and Sillanpää2003, 2004; Smýkal et al., Reference Smýkal, Hýbl, Corander, Jarkovský, Flavell and Griga2008a).
Several types of Bayesian modelling software are currently available. Although they perform similarly in relatively small datasets, there are differences, especially when the level of subpopulation differentiation (F ST) is below 0.1 (Latch et al., Reference Latch, Dharmarajan, Glaubitz and Rhodes2006), as is common in germplasm collections. To date, published plant germplasm studies have primarily relied upon STRUCTURE software (Pritchard et al., Reference Pritchard, Stephens and Donnelly2000; Falush et al., Reference Falush, Stephens and Pritchard2003), which assigns genotypes probabilistically to a user-defined number of clusters or gene pools. Partition-based alternatives provided by BAPS software use analytical integration strategy combined with stochastic search methods and are also appropriate when the number of genetically diverged sources contributing to observed data is unknown (Corander et al., Reference Corander, Waldmann and Sillanpää2003, 2004, 2006, 2007). Additionally, BAPS provides the following advantages over STRUCTURE: (1) analytical integration for the fitting of the models provides a more reliable estimation for complex datasets; (2) spatial models of genetic population structure can be accommodated in BAPS; (3) admixture inference in BAPS enables the investigation of the statistical significance of estimated admixture coefficients; and (4) BAPS requires much lower computation time than STRUCTURE (Latch et al., Reference Latch, Dharmarajan, Glaubitz and Rhodes2006). We therefore propose BAPS analysis as a suitable approach for future germplasm management.
Towards the world pea core collection
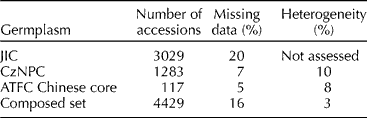
In keeping with the above-mentioned methods, and in order to have a compatible dataset needed for composite pea germplasm analyses, we have chosen easily scorable (essentially binary) retrotransposon insertion (RBIPs) markers to conduct an analysis of three large collections (Table 1). We have used the entire JIC dataset from Jing et al. (Reference Jing, Vershinin, Grzebyta, Shaw, Smýkal, Marshall, Ambrose, Ellis and Flavell2010), which consists of 3029 accessions comprised largely of expedition acquisitions and mutant stocks; the 1283 accessions from the CzNPC, consisting of cultivated varieties, landraces and breeding lines (Smýkal et al., Reference Smýkal, Hýbl, Corander, Jarkovský, Flavell and Griga2008a); and a selected core set of 117 accessions of Chinese origin from the ATFC collection (Zhong et al., Reference Zong, Redden, Liu, Wang, Guan, Liu, Xu, Liu, Gu, Yan, Ades and Ford2009a) (Table 2). The latter were of particular interest, as an analysis of SSR loci showed the Chinese samples to be genetically distinct from the global gene pool sourced outside of China (Zhong et al., Reference Zong, Redden, Liu, Wang, Guan, Liu, Xu, Liu, Gu, Yan, Ades and Ford2009a, b).
Description of three pea germplasm collections used in this study: CzNPC, JIC Pisum collection and ATFC

List of material used for composed dataset in this study with indicated levels of missing data (zero scores owing to primer annealing versus accessions; see Jing et al., Reference Jing, Vershinin, Grzebyta, Shaw, Smýkal, Marshall, Ambrose, Ellis and Flavell2010 for details) and heterogeneity (bulk of 10 or 20 plants per sample used in CzNPC and ATFC datasets) used in the composed dataset study
As an initial step, we have conducted a Bayesian BAPS analysis of the original datasets for all three of the above-mentioned collections. The ATFC germplasm, comprised of the 1243 accessions of Chinese origin, 774 globally diverse P. sativum genotypes and 103 wild pea accessions, was analyzed using 21 SSR loci (42 data points/accession) partitioned into K = 2–10 clusters, with optimal clustering being K = 6 and 8 (Fig. 4(a)). Cluster 1 contained 97 accessions from the Shanxi, Yunnan, Henan and Inner Mongolia parts of China; cluster 2 contained 420 accessions from the Yunnan, Tibet, Sichuan, Inner Mongolia, Hubei, Qinghai and Shanxi provinces; cluster 3 contained 286 accessions of worldwide distributed varieties and breeding lines; cluster 4 included 282 accessions of mostly wild pea material, such as P. fulvum (10), P. sativum subsp. elatius (6), P. abyssinicum (12) and cultivated accessions from Australia, Germany, Nepal and Pakistan, with an additional 62 accessions from China (Sichuan, Tibet, Inner Mongolia, Qinghai). Cluster 5 contained 250 tightly clustered accessions from the Anhui, Gansu, Guizhou, Henan, Inner Mongolia, Shanxi, Sichuan and Qinghai provinces. The 181 accessions comprising cluster 6 originated mainly from the Shanxi province, and the large (400 accessions) cluster 7 possessed has a notable number of Afghan (20), Ethiopian (37) and Australian breeding lines (108). Finally, cluster 8 (204 accessions) contained 170 samples from the Inner Mongolia and Shanxi regions (18). Thus, the BAPS analysis also indicated a range of gene pools unique to China (clusters 1, 2, 5, 6 and 8), enlarging on the diversity revealed by SSR analysis (Zong et al., Reference Zong, Redden, Liu, Wang, Guan, Liu, Xu, Liu, Gu, Yan, Ades and Ford2009). BAPS analysis also revealed the positioning of 117 accessions of Chinese origin within the ATFC core set (Fig. 4(b)), which was originally assembled based on a distance-generated dendrogram (Zong et al., Reference Zong, Redden, Liu, Wang, Guan, Liu, Xu, Liu, Gu, Yan, Ades and Ford2009). The 117 accessions selected for inclusion in a core germplasm set were placed within all eight clusters identified by BAPS, although their distribution was not even and could be further improved to capture original set diversity using the BAPS data. In contrast to SSR analysis, the RBIP marker data did not identify specific, private alleles; thus, it is allelic frequency that makes retrotransposon insertion data informative. Interestingly, although 115 alleles in total were detected across the 21 microsatellite loci, this did not separate wild pea (especially P. fulvum and P. elatius) from cultivated germplasm, as found previously using retrotransposon-based RBIP assay of the JIC germplasm (Jing et al., Reference Jing, Vershinin, Grzebyta, Shaw, Smýkal, Marshall, Ambrose, Ellis and Flavell2010). Also in the study by Nasiri et al. (Reference Nasiri, Haghnazari and Saba2009), 20 SSR loci clearly discriminated wild Pisum sp. accessions, including, P. sativum subsp. elatius and P. sativum subsp. abyssinicum. Moreover, in contrast to the distance-based analysis and principal component analysis applied by Zong et al. (Reference Zong, Redden, Liu, Wang, Guan, Liu, Xu, Liu, Gu, Yan, Ades and Ford2009), which identified 214 clusters, the model-based BAPS analysis clearly showed clustering in eight well-supported clusters. In addition, Zong et al. (Reference Zong, Redden, Liu, Wang, Guan, Liu, Xu, Liu, Gu, Yan, Ades and Ford2009) showed that a microsatellite-based 146 core germplasm set captured better allele diversity within the original collection than a core constructed solely based on geographic origin.
BAPS analysis partitioning. (a) BAPS at K = 8 of 2120 accessions of ATFC collection (Zong et al., Reference Zong, Redden, Liu, Wang, Guan, Liu, Xu, Liu, Gu, Yan, Ades and Ford2009) genotyped by 21 SSR loci. (b) Black bars indicate distribution of 117 core set accessions of Chinese origin (according to Zong et al., Reference Zong, Redden, Liu, Wang, Guan, Liu, Xu, Liu, Gu, Yan, Ades and Ford2009) used for composed dataset analysis. (c) BAPS at K = 14 of 3029 accessions of JIC collection (Analysis and exploitation of germplasm resources using transposable element molecular markers dataset, Jing et al., Reference Jing, Vershinin, Grzebyta, Shaw, Smýkal, Marshall, Ambrose, Ellis and Flavell2010) genotyped by 45 RBIP loci. (d) BAPS at K = 9 of 1283 accessions of CzNPC analyzed by combination of 25 RBIP and 10 SSR loci. (e) Dry-seed pea (P. sativum subsp. sativum var. sativum) accessions are indicated as black bars, while fodder pea (var. arvense) accessions are shown in white. (f) 203 accessions of Czech/Slovak origin (from Smýkal et al., Reference Smýkal, Hýbl, Corander, Jarkovský, Flavell and Griga2008a) are shown as black bars. (g) 4429 accessions of the combined set analyzed by 17 selected RBIP loci. (h) 140 accessions of Chinese origin (P. sativum cultigen). (i) 349 accessions of Ethiopian origin (P. sativum cultigen). (j) 100 accessions of Afghan origin (P. sativum cultigen). (k) 1283 accessions from the Czech collection (P. sativum cultigen). (l) 140 accessions of wild forms (P. fulvum, P. sativum subsp. elatius and P. abyssinicum).

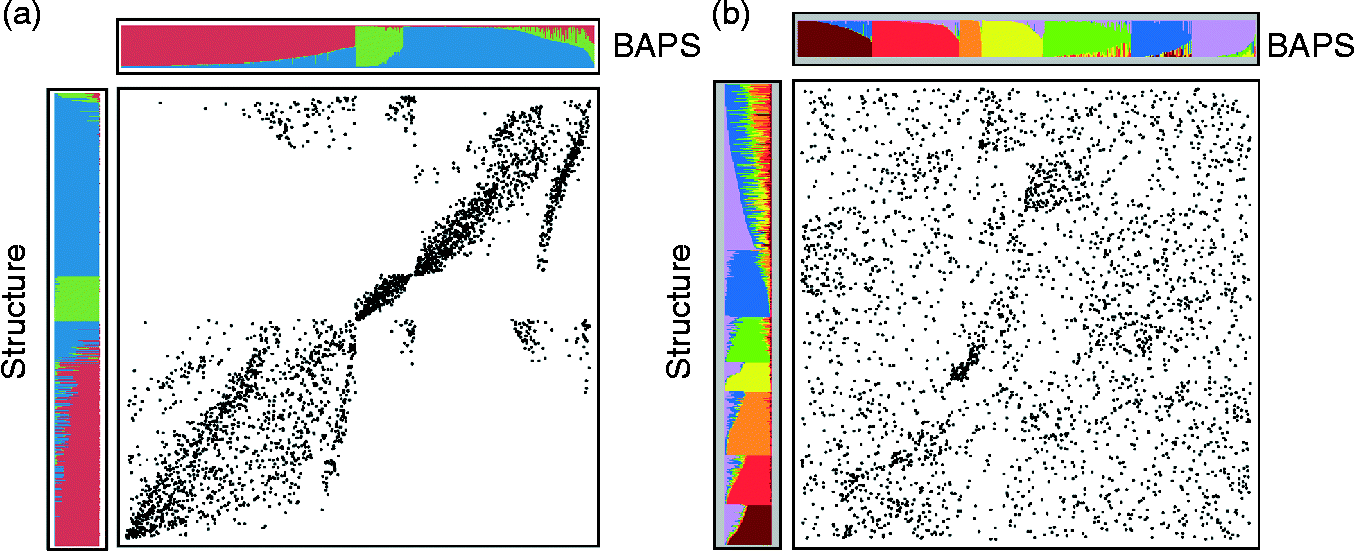
The 3029 accessions of the JIC collection (http://www.jic.ac.uk/germplas/pisum/) analyzed by 45 RBIP loci (45 data points/accession) were assigned into K = 2 to 14 clusters (Fig. 4(c)). This is in contrast to STRUCTURE analysis, which partitioned the collection into maximally K = 7 clusters (Jing et al., Reference Jing, Vershinin, Grzebyta, Shaw, Smýkal, Marshall, Ambrose, Ellis and Flavell2010). In a direct comparison of the BAPS and STRUCTURE methods, a good level of agreement was found when K = 3 (Fig. 5(a)); however, the former method was favoured since the resultant substructuring revealed biological meaningful diversity. It has to be noted that this comparison also takes into account the order of each accession. As in the case where the BAPS posterior cluster assignment often equals 1.0, as indicated by colour bars, one can see some block-like cluster correspondence, rather than diagonal, which would be the case of a complete match. This is well preserved in cluster 2, containing the majority of the wild material using both BAPS and STRUCTURE. On the other hand, comparison of cluster assignments for higher K values, such as K = 7, did not shown any significant correspondence (Fig. 5(b)). In the analysis of Jing et al. (Reference Jing, Vershinin, Grzebyta, Shaw, Smýkal, Marshall, Ambrose, Ellis and Flavell2010), each of the three K = 3 sets was separately subjected to further STRUCTURE analysis. Groups 1 and 3 were further subclustered into K = 6, while group 2 was subclustered into K = 2. Group 1 was dominated by P. sativum landraces and cultivars, largely round- and large-seed phenotypes; group 2 contained P. sativum cultivars with primarily wrinkled-seed types. In contrast, group 3 showed a considerable amount of substructuring with regard to both taxonomy and phenotypic traits (Jing et al., Reference Jing, Vershinin, Grzebyta, Shaw, Smýkal, Marshall, Ambrose, Ellis and Flavell2010). Subgroups separated almost all P. abyssinicum, P. elatius and P. fulvum, along with accessions of Afghan origin. In contrast, the BAPS analysis at K = 14 directly identified separate clusters containing wild material, distinguishing P. fulvum (cluster 3 in Fig. 4(b)) from P. elatius and P. abyssinicum (cluster 4 in Fig. 4(b)), supporting the view of separate species or subspecies. This wild material was clearly already separated at a K = 5 value, while at K = 11, P. fulvum was clustered from P. elatius and P. abyssinicum. In addition to these, accessions of domesticated (P. sativum subsp. sativum) peas of Afghan and Ethiopian origin (clusters 6 and 7, 8, respectively, Fig. 5(i,j)) were readily separated by BAPS. The remaining nine clusters at K = 14 contained well-structured, cultivated material lacking much geographical or user type stratification. However, P. sativum of Ethiopian origin constituted a large part of the JIC germplasm, and these accessions proved well resolved starting from K = 11, and along with the Afghan accessions, separated at K = 14 (cluster 7). There was a significant (306) proportion of modern varieties partitioned in cluster 10. Outgrouping of Afghan types was supported by previous studies, which classified them as resistant to European Rhizobium strains (Young and Matthews, Reference Young and Matthews1982). Moreover, positioning of P. abyssinicum together with P. elatius and P. fulvum is in agreement with phylogenetic analysis using chloroplastDNA and ITS markers, supporting the view that P. abyssinicum is an ancient hybrid of the two species.
Comparison of 3029 accessions from the JIC dataset genotyped by 45 RBIP loci assigned by BAPS or STRUCTURE software at K = 3 (a) or K = 7 values (b), respectively. Respective clusters are colour-coded and ordered according to accessions assignment.
Finally, 1283 accessions from the Czech National Pea Collection (CzNPC, http://genbank.vurv.cz/genetic/resources) analyzed by a combination of 25 RBIP and 10 SSR loci (57 data points/accession) were assigned into K = 9 (with the highest posterior probability of 0.9997; Fig. 4(d)). This germplasm contained largely commercial varieties and breeding lines (75%), while the remainder were landraces (24%) and mutants or wild material (1%) (Smýkal et al., Reference Smýkal, Hýbl, Corander, Jarkovský, Flavell and Griga2008a). The prevalence of highly bred material likely explains consistently lower posterior assignment values ( ≤ 1) in most of the accessions, in comparison to those in the ATFC and JIC collections. Furthermore, part of this maybe attributed to the use of a combination of RBIP and SSR data, as shown by separate marker analysis (data not shown). CzNPC was divided by morphological descriptors into dry-seed pea P. sativum subsp. sativum var. sativum (L01 accessions, 1006) (Fig. 4(e)) and fodder pea P. sativum subsp. sativum var. arvense (L02 accessions, 277). As shown previously (Smýkal et al., Reference Smýkal, Hýbl, Corander, Jarkovský, Flavell and Griga2008a), both RBIP and SSR markers do not discriminate between these classes.
Overall, large amounts of diversity were captured among cultivated material, which could be clearly visualized by model-based methods. Although no clear geographical assignments were found in most of the older varieties, likely owing to a large degree of interbreeding, landraces were found in clusters distinct from the modern varieties (Smýkal et al., Reference Smýkal, Hýbl, Corander, Jarkovský, Flavell and Griga2008a and in preparation).
In the combined set of the three germplasm collections, a total of 4429 accessions were analyzed by 17 selected RBIP loci, providing a total of 75,293 data points with zero scores treated as missing data for 16% of the dataset (see Jing et al., Reference Jing, Knox, Lee, Vershinin, Ambrose, Ellis and Flavell2005, 2010 for explanation of zero scores) (Table 1). Subsequent BAPS analysis provided posterior assignments for K = 2 to 14, with optimal partitioning into K = 11 (Fig. 4(g)). Although 17 RBIP loci might be considered a low number to sample the diversity of the large pea genome, clear genetic structure could be observed. Notably, all wild pea (P. fulvum, 53; P. sativum subsp. elatius, 28; and P. abyssinicum, 26) were placed in cluster 6 at K = 14 (Fig. 4(l)), together with the accessions of Afghan origin (27) (Fig. 4(j)). Furthermore, cluster 14 contained a large proportion of P. sativum subsp. sativum (140 accessions of Ethiopian origin.). Also, 117 accessions from the ATFC plus 23 JIC core of Chinese origin were distributed into clusters 8, 11, 12 and 14 (Fig. 4(h)). The remaining clusters contained all cultivated material (Fig. 4(k)) plus the JIC set of mutant lines. It was proposed that the distinct differentiation of the Chinese P. sativum genotypes may in part reflect the early isolation of agriculture in eastern Asia from that in southern Asia, Europe and northern Africa (Zong et al., Reference Zong, Redden, Liu, Wang, Guan, Liu, Xu, Liu, Gu, Yan, Ades and Ford2009) and the restricted initial gene pool and opportunities for recombination outside this relatively closed gene pool.
Furthermore, multivariate analysis (see Smýkal et al., Reference Smýkal, Hýbl, Corander, Jarkovský, Flavell and Griga2008a and Jing et al., Reference Jing, Vershinin, Grzebyta, Shaw, Smýkal, Marshall, Ambrose, Ellis and Flavell2010 for methods) revealed relatively closer genetic distance within cultivated material, especially of modern varieties and breeding lines, while wild material provides much of the Pisum genus diversity (Fig. 6). The greater genetic distance of wild forms and some of the material of Chinese origin suggests usefulness of this material for further breeding.
Multivariate analysis of a composed dataset. For the entire dataset, the fraction of shared alleles for all pairwise combinations of samples was analyzed by multidimensional scaling. The output for the first two dimensions is shown. All points are plotted, and each sample is colour-coded according to germplasm assignment: (a) composed dataset, (b) JIC-TEGERM dataset (as in Jing et al., Reference Jing, Vershinin, Grzebyta, Shaw, Smýkal, Marshall, Ambrose, Ellis and Flavell2010), (c) CzNP collection, L accessions, (d) ATFC core collection of Chinese origin.

Although the above-mentioned marker types are now widespread, their potential is limited due to the small amount of the genome that is actually assessed. With advances in model legume sequencing, increased genomic knowledge and rapidly progressing next generation sequencing technologies, there is a progression towards gene-based markers such as high-throughput SNP generation and detection assays. Recently, the first highly multiplexed SNP genotyping assay was published for pea (Deulvot et al., Reference Deulvot, Charrel, Marty, Jacquin, Donnadieu, Lejeune-Hénaut, Burstin and Aubert2010).
Data deposition and core collections
One very important, if not critical, issue is the deposition and availability of data. So far, data held at the national level have not been broadly accessible. Although the European EURISCO Web catalogue (http://eurisco.ecpgr.org), maintained by Bioversity International and the USDA National Plant Germplasm System (GRIN), provides information on around two million accessions, this information is largely passport-based and is thus limited. From GRIN, pea descriptor data (153,812 observations) and digital images (10,643) are downloadable at http://www.ars-grin.gov/cgi-bin/npgs/html/crop.pl?177. Fortunately, the recent EU-funded PGR Secure project, on Avena, Brassica, Beta and Medicago case studies, should lead to a database system that will bring together passport, morphological and genotypic data (Lee et al., Reference Lee, Davenport, Marshall, Ellis, Ambrose, Dicks, van Hintum and Flavell2005) that will both improve germplasm management and enable data exploration across a wide range of data types.
Defining a pea core together with a set of markers provides a basis for the comparison of phenotypic and molecular analyses and would form a useful additional case study for the PGR Secure project. No standardized method for core collection (Hodgkin et al., Reference Hodgkin, Brown, van Hintum and Morales1995) assembly has been established, although numerous strategies have been proposed and tested (Van Hintum, Reference Van Hintum, Johnson and Hodgkin1999; Hu et al., Reference Hu, Zhu and Xu2000; Wang et al., Reference Wang, Hu, Xu and Zhang2007; Thachuk et al., Reference Thachuk, Crossa, Franco, Dreisigacker, Warburton and Davenport2009). Further methods continue to be developed as new approaches and algorithms become available. The most commonly used grouping strategy relies on geographical (e.g. passport) data, followed by morphological characteristics (Brown and Spillane, Reference Brown, Spillane, Johnson and Hodgkin1999). Since most traits are quantitative and influenced by many genes, they are affected by environmental and experimental conditions. Consequently, stratification based on phenotypic traits would not accurately reflect genetic relationships. Pairwise genetic distance calculation followed by the subtraction of the most commonly related accessions is a widely adopted method. However, as shown earlier, genetic distance does not properly reflect population structure as Bayesian inference. The application of a model-based method for pea core collection establishment was successfully tested on a subset of the Czech National Pea Collection (Smýkal et al., Reference Smýkal, Hýbl, Corander, Jarkovský, Flavell and Griga2008a) and is currently being further developed. Such collections will be valuable for producing an integrated framework of genetic and phenotypic data generated by different studies.
Germplasm collections are dynamic
The maintenance of germplasm genetic integrity is essential for long-term ex situ conservation. Periodic regeneration, performed on limited plots with a small number of individuals, increases the risk of genetic drift, which in turn leads to a decrease or even loss of genetic diversity (Breese, Reference Breese1989). Modern techniques of seed storage can maintain seed viability for over 100 years. In such conditions, base collections are stored. This category of collection is generally used exclusively for the regeneration and maintenance of the stocks in active collections, where the emphasis is on characterization, evaluation and distribution. Only a few published studies were devoted to germplasm integrity evaluations. We have shown that over a 20–40 year period, with about four to ten regeneration cycles performed to maintain seed viability, the genetic diversity contained within pea germplasm accessions was reduced or even lost (Cieslarová et al., Reference Cieslarová, Smýkal, Dočkalová, Hanáček, Procházka, Hýbl and Griga2010). These findings imply that regeneration procedures should be improved to accommodate more numerous samples and that the composition of the collection should be continuously monitored to prevent the risk of genetic diversity loss.
General conclusions
This study, based on molecular data, has positioned Pisum between Vicia and Lathyrus and shown it to be closely allied to Vavilovia. Study of phylogeography supports the spread of wild pea from centre of origin (Middle East) eastwards (to the Caucasus, Iran and Afghanistan) and westwards to the Mediterranean region. Analysis of wide pea germplasm has demonstrated that Pisum is a diverse genus. Bayesian analysis of a combined dataset of 4429 pea accessions, using locus-specific retrotransposon insertion markers, has separated wild species and subspecies (P. fulvum, P. sativum subsp. elatius and P. abyssinicum) from cultivated material. Within cultivated pea (P. sativum subsp. sativum), accessions from Afghanistan, Ethiopia and China were distinguished. These results showed that comparably large diversity is captured among cultivated material, which could be clearly visualized by model-based methods. We have demonstrated the superiority of BAPS over STRUCTURE software and propose BAPS analysis as a suitable approach for germplasm exploration and management. Despite multiple introgression between cultivated and wild Pisum, significant genetic variation is present in wild Pisum. However, plant breeders are reluctant to use wild germplasm because hybrids with wild material have a high likelihood of having impaired rather than improved performance. This underlines the necessity for increased pre-breeding efforts, whereby the traits of interest, such as biotic and abiotic resistance, are made available in backgrounds more acceptable to breeders.
Acknowledgements
P. S. acknowledges financial support from the Ministry of Education of Czech Republic, MSM 2678424601, LA08011 and the Bioversity International AEGIS LOA 10/048 projects. O. K. acknowledges financial support from Russian Fund for Fundamental Research, grant 10-04-00 230-a. M. J. A. acknowledges financial support from Defra GC0142 project for the maintenance of the JIC Pisum collection.



