I. INTRODUCTION
Gold nanoparticles (AuNPs) have been heavily investigated for their unique size- and shape-dependent optical properties. These effects are apparent in the variation of optical spectra that AuNPs exhibit for different sizes and shapes ranging from spheres (plasmon band at ∼520 nm) to nanorods (transverse and longitudinal plasmon bands at ∼520 and 600–1600 nm, respectively). Reference Murphy, Thompson, Alkilany, Sisco, Boulos, Sivapalan, Yang, Chernak and Huang1–Reference Jain, Lee, El-Sayed and El-Sayed3 These signature spectral bands correspond to a localized surface plasmon resonance effect caused by the coherent, collective oscillation of conduction band electrons in AuNPs illuminated with light. Reference Murphy, Thompson, Alkilany, Sisco, Boulos, Sivapalan, Yang, Chernak and Huang1 In addition to the effects of size and shape on the resulting absorption and scattering of light, changes in the spatial arrangement of AuNPs can shift the position of the plasmon bands. Reference Xia, Zuo, Yang, Xiao, Kang, Vallée-Bélisle, Gong, Yuen, Hsu and Heeger4–Reference Gupta, Konig, Near, Nepal, Drummy, Biswas, Naik, Vaia, El-Sayed and Tsukruk9 AuNP surfaces can be conveniently modified to incorporate other moieties such as oligonucleotides, proteins, and antibodies due to the strong binding interaction between gold and chemical moieties such as thiols. Reference Storhoff, Elghanian, Mucic, Mirkin and Letsinger7,Reference Sandström, Boncheva and Åkerman10–Reference Huang, El-Sayed, Qian and El-Sayed13 As a result of these practical optical properties and conjugation possibilities, AuNPs have been studied in biosensing, molecular imaging, therapeutic, and medical diagnostic applications. Reference Jain, Huang, El-Sayed and El-Sayed6,Reference Giljohann, Seferos, Daniel, Massich, Patel and Mirkin12,Reference Bedford, Spadavecchia, Pradier and Gu14
Synthesis of AuNPs of various shapes is typically performed via reduction of Au(III) ions in an aqueous solution with a capping agent present to stabilize formed particles. Common capping agents include citrate or cetyltrimethylammonium bromide (CTAB). Reference Lohse and Murphy2,Reference Balasubramanian, Yang, Yung, Ong, Ong and Yu11,Reference Giljohann, Seferos, Daniel, Massich, Patel and Mirkin12,Reference Huang, Neretina and El-Sayed15–Reference Liu, Atwater, Wang and Huo18 While synthesis protocols can vary Reference Long, Vu, Kiem, Doanh, Nguyet, Hang, Thien and Quynh19,Reference Gole and Murphy20 once gold seeds have nucleated, gold nanospheres (AuNSs) can be formed by simply allowing the solution to sufficiently age. Reference Jiang and Pileni21 To form gold nanorods (AuNRs), on the other hand, gold seeds are typically added to a growth solution containing silver nitrate to promote preferential growth of the {111} facets on the ends of the AuNR. Reference Placido, Comparelli, Giannici, Cozzoli, Capitani, Striccoli, Agostiano and Curri22–Reference Murphy, Thompson, Chernak, Yang, Sivapalan, Boulos, Huang, Alkilany and Sisco24 The aspect ratio of the AuNR can be controlled through choices in growth solution conditions such as changing the concentration of silver nitrate. Reference Lohse and Murphy2,Reference Huang, Neretina and El-Sayed15,Reference Nikoobakht and El-Sayed16,Reference Bullen, Zijlstra, Bakker, Gu and Raston25
Over the past several years, numerous studies have focused on using grafted oligonucleotides to induce recognition-based assembly of AuNPs as highlighted in recent reviews. Reference Ofir, Samanta and Rotello26–Reference Geerts and Eiser29 The studies typically conjugate single-stranded thiol-modified, complementary oligonucleotides on one or more populations of nanoparticles and then induce nanoparticle aggregation as hybridized duplexes bridge nanoparticle surfaces. Reference Mirkin, Letsinger and Mucic8,Reference Shin, Zhang and Liu30,Reference Smith, Dave, Huang and Liu31 As opposed to using DNA as a nanoparticle assembly tool, select studies have explored the use of oligonucleotides and nucleotides as templates for the synthesis of inorganic nanoparticles. Similar to prior work using peptide-based templates, Reference Feldheim and Eaton32–Reference Radloff and Vaia37 the goal of these bioinspired approaches was to efficiently control particle shape and size during particle nucleation events, or more commonly, during the growth stage following seed preparation. Reference Berti and Burley38 Some studies reveal, for example, that variation in physical size and fluorescence characteristics of CdS nanoparticles can be achieved by adding specific homopolymer sequences during nanoparticle synthesis. Reference Bigham and Coffer39 DNA has also been used as a template to create Ag nanoring structures, which could not be achieved using conventional direct growth methods. Reference Zinchenko, Yoshikawa and Baigl40,Reference Lin, Yin, Pu, Ren and Qu41
Select studies by Wang et al. have specifically investigated the effect of incubating soluble oligonucleotides (i.e., not intentionally conjugated to material surface) with gold seeds during the growth stage. Their studies involved incubating solutions of 30 base-long (polyadenine, polythymine, or polycytosine) Reference Wang, Tang, Tan, Li and Lu42,Reference Wang, Zhang, Ekman, Kenis and Lu43 or 20 base-long (polyguanine) Reference Wang, Zhang, Ekman, Kenis and Lu43 homopolymers with CTAB-stabilized gold nanoprism seeds. They reported a variation occurs in particle morphology and topography ranging from rough (polyadenine) and smooth (polycytosine) surfaces to star-shaped (polythymine) and hexagonal (polyguanine) nanoparticles. Reference Wang, Tang, Tan, Li and Lu42 Depending on sequence compositions, binary mixtures of the homopolymers resulted in intermediate morphologies and surface roughness in the resulting nanoparticles.
While few studies Reference Wang, Tang, Tan, Li and Lu42,Reference Wang, Zhang, Ekman, Kenis and Lu43 have investigated particle growth in the presence of nucleic acids, the base-specific and structure-specific interactions of oligonucleotides with gold surfaces have been reported. Surface plasmon resonance (SPR) and Fourier transform infrared spectroscopy (FTIR) analysis on gold surfaces can provide information on relative differences in the timing and extent of oligonucleotide adsorption events. Reference Wolf, Gao and Georgiadis44–Reference Kimura-Suda, Petrovykh, Tarlov and Whitman46 Notably, while bare planar gold serves as a convenient sample geometry for characterizing surface binding events, the nature of these binding events on colloidal gold may be significantly affected by additional materials parameters ranging from curvature to additional surface moieties (e.g., citrate). Reference Liu45 For AuNPs initially stabilized by citrate ions, bridging of nanoparticle surfaces via single-stranded homopolymers of DNA has been assessed using colorimetric analysis and UV–Vis spectroscopy. Reference Storhoff, Elghanian, Mirkin and Letsinger47,Reference Li, Nelson, Pentland, Buskirk and Rothberg48 Collectively, these studies indicate that homopolymer sequences do not have equivalent affinities for gold substrates with purines adsorbing more strongly than pyrimidines to gold in the following order: G > A > C > T. Reference Wolf, Gao and Georgiadis44,Reference Storhoff, Elghanian, Mirkin and Letsinger47 Among these studies, the secondary structure of DNA (single-stranded chains versus double-stranded helix) has been shown to affect the propensity for AuNPs to aggregate. Reference Kimura-Suda, Petrovykh, Tarlov and Whitman46,Reference Li, Nelson, Pentland, Buskirk and Rothberg48
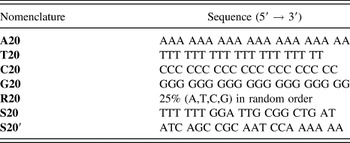
In the current spectroscopy study, base-specific and structure-specific effects of single-stranded DNA (ssDNA) and double-stranded DNA (dsDNA) added during seeded growth are investigated to reveal if the presence of various nucleic acids directs the shape evolution of the resulting AuNPs. In an effort to directly compare the results of adding various nucleic acids ranging from individual nucleotides to mixtures of polynucleotides in the current study, a common gold seed approach involving CTAB was chosen based on the work of El Sayed and co-workers. Reference Huang, Neretina and El-Sayed15,Reference Nikoobakht and El-Sayed16 While the seed preparation was identical in all cases, one of two growth conditions are used, namely either a AuNS growth solution (aging of the original seed solution) or a AuNR growth solution (seed solution added to a separate AuNR growth solution with additives such as silver nitrate). The effects of various nucleic acids on AuNP formation under these two broad classes of either nanosphere or nanorod growth solutions are primarily investigated using UV–Vis spectroscopy. Due to its widespread and practical use as a characterization tool for AuNP suspensions, UV–Vis spectroscopy was chosen as our primary analytical tool to quantitatively assess differences in the spectral signatures of the resulting nanoparticle suspensions from numerous nucleic acid incubation conditions. To identify base specific effects, 20 base-long homopolymer (A20, T20, C20, G20) and random (R20) sequences alone and as mixtures are used in these studies. Structure-specific effects (ssDNA versus dsDNA) were also investigated by incubating gold seeds with mixtures of complementary homopolymer sequences as well as with specific sequences (S20, S20′) that were shown to be capable of duplex formation (S20:S20′) under the nanoparticle growth conditions explored. Pure and mixed monomeric forms of nucleic acids were also investigated as additives during nanoparticle growth.
II. EXPERIMENTAL SECTION
A. Chemicals
Hydrogen tetrachloroaurate(III) hydrate (HAuCl4•3H2O), silver nitrate (AgNO3), L-ascorbic acid, hexadecyltrimethylammonium bromide (CTAB), hydrochloric acid (HCl), and deoxynucleoside monophosphates (dNMPs: dAMP, dTMP, dGMP, and dCMP) were purchased from Sigma Aldrich, St. Louis, MO. Sodium borohydride (NaBH4) was purchased from Fluka Analytical, Bushs, Switzerland. Tris HCl (pH 7.5) was purchased from Amresco, Solon, OH. Deoxynucleoside triphosphates (dNTPs: dATP, dTTP, dGTP, dCTP, and dNTP Mix) were purchased from Invitrogen, Grand Island, NY. All DNA sequences were synthesized by Integrated DNA Technologies, Inc., Coralville, IA. Buffers were prepared using 0.2 µM filtered water from a Barnstead Nanopure ultrapure water purification system. 1 mM stock solutions of DNA were prepared using 1 mM Tris HCl, pH 7.5.
B. Preparation of AuNP seed solution
AuNP seeds were synthesized according to the methods described by Nikoobakht and El Sayed. Reference Nikoobakht and El-Sayed16 The CTAB solution (20 mL, 0.2 M) was mixed with a solution of HAuCl4•3H2O (20 mL, 0.5 mM). After 30 min of stirring, a freshly prepared solution of ice-cold NaBH4 (2.4 mL, 0.01 M) was then added to the stirred seed solution and mixed for an additional 2 min. Gold seed suspensions were then added to nucleic acid solutions as described in the next section.
C. Preparation of AuNSs and AuNRs
AuNSs were allowed to form (in the absence or presence of various nucleic acids) by allowing the gold seed solution to age for up to seven days. AuNP seeds for AuNR synthesis were prepared at the same reagent ratios as described above, however, the total reaction volume (including additional NaBH4) was scaled to 10.6 mL. Using magnetic stir bars, the seed solution was then stirred on a low setting for an additional 2 min before being poured into a separate glass container and set aside for 45 min to 1 h prior to incubation with (or without) various nucleic acids in a AuNR growth solution described below.
A 10 mL AuNR growth solution was prepared to provide the same growth conditions for each set of nucleic acids for a given nanoparticle suspension (1 mL each). For cases involving a large number of samples (e.g., kinetics studies over a 7 day timeframe), the total reaction volume was scaled accordingly. Then, for each 10 mL volume, 160 µL of 5 mM AgNO3 was added to 5 mL of 0.2 M CTAB and stirred on a low setting for 30 s. A 5 mL volume of 1 mM HAuCl4•3H2O was added to the solution and stirred on a low setting for 5 min. A 54 µL volume of 0.1 M L-ascorbic acid was then added to the solution and stirred on a low setting for 5–10 min. To then initiate AuNR growth, 12 µL of a gold seed solution (aged 45 min to 1 h) was added to 10 mL of AuNR growth solution. The solution was immediately stirred on a high setting for 15–20 s and then added to various nucleic acid solutions described below.
D. Nucleic acid incubation and UV–Vis spectroscopy and TEM analysis
A list of oligonucleotide sequences is provided in Table I. For all seed suspensions incubated with nucleic acids, each oligonucleotide or nucleotide was incubated at a final concentration of 2 µM in a 1 mL total volume of either (i) the seed solution (to be aged) or (ii) the seed solution added to the AuNR growth solution. For cases involving mixtures of oligonucleotides or nucleotides, each oligonucleotide or nucleotide was added to yield a final concentration of 2 µM for each individual species. Select experiments were also conducted at a nucleic acid concentration of 0.1 µM. Following the addition of seed solutions to a particular nucleic acid solution, suspensions were mixed on a rotomixer and examined at various timepoints using UV–Vis analysis. For the 2 h and 7 d timepoints, UV–Vis spectra were gathered at 1 nm intervals using a Biotek Synergy H1 Hybrid Reader. An exception to this protocol was used for the AuNR kinetics study involving 15 min intervals for the first hour of incubation with nucleic acids. For the early timepoints in these particular kinetics studies, UV–Vis spectra were collected with a sweeping scan at a 1 nm wave length resolution. For all other timepoints occurring at or after 1 h, however, the previously described scanning conditions (i.e., 1 nm intervals) were used. After data collection, spectra for each set of samples were first normalized against a water blank. Next, each sample was normalized to the same relative absorbance value of 0.3 at 400 nm as others have done in previous studies. Reference Murphy, Thompson, Chernak, Yang, Sivapalan, Boulos, Huang, Alkilany and Sisco24 Samples were additionally characterized via transmission electron microscopy. TEM images were acquired with a JEOL 100CX II transmission electron microscope at 100 kV. Samples for TEM were centrifuged (14,000 rpm × 15 min) twice to remove surfactant and redispersed in nanopure water. After redispersion, 0.3 μL of the sample was drop-cast onto a carbon-coated copper TEM grid and allowed to dry at room temperature.
List of 20 base-long DNA sequences incubated with gold seeds in the presence or absence of AuNR growth solution.

III. RESULTS AND DISCUSSION
A. Effects of 20 base-long homopolymer additions to aging gold seed suspensions
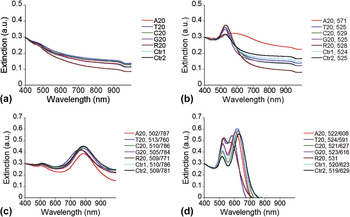
The effects of incubating 20 base-long homopolymer sequences (A20, T20, C20, or G20) as well as random oligonucleotide sequences (R20) with a AuNP seed solution are investigated first. Following a 2 h incubation period, no spectral differences are observed between any aging nanoparticle suspensions in the presence or absence of ssDNA as shown in Fig. 1(a). Notably, the featureless spectra at this early timepoint are likely due to the relatively small seed size (∼4 nm). Reference Nikoobakht and El-Sayed16 After a 7 d incubation period shown in Fig. 1(b), a peak (∼525 nm) appears for both controls and all of the DNA cases except for polyadenine (A20) which induces a red-shift (571 nm) and overall broadening of the characteristic peak. Unlike the other suspensions, visible nanoparticle sedimentation does occur in the presence of A20 within 7 days. Together, the spectral differences and rapid sedimentation behavior indicate that polyadenine induces particle aggregation not observed with the other homopolymers or random oligonucleotide sequences. This aggregation behavior most likely stems from polyadenine bridging spherical nanoparticles together into disordered clusters as indicated in separate TEM micrographs in Supporting Information [FIG. S1(a)]. Prior work by Wolf et al. on planar substrates suggests that 25 base-long polyadenine exhibits the strongest and fastest binding activity to gold surfaces compared to polycytosine and polythymine. Reference Wolf, Gao and Georgiadis44 While CTAB surfactant is a necessary additive in the current study to minimize aggregation of either the seeds or nanoparticles, separate washing studies (results not shown) as well as prior work Reference Nikoobakht and El-Sayed49 indicate that the CTAB is only weakly associated with the nanoparticle surface. Thus, the polyadenine may effectively displace enough of the CTAB bilayer to allow polymer-induced bridging between nanoparticle surfaces. Interestingly, polymer-induced bridging typically occurs under dilute polymer conditions with relatively high molecular weight polymers; however, it is known that relatively short DNA strands (20 bases or less) can participate in forming duplex bridges between nanoparticles. Reference Mirkin, Letsinger and Mucic8,Reference Nykypanchuk, Maye, van der Lelie and Gang50 Thus, nanoparticle bridging by the single-stranded oligonucleotides appears plausible. Nucleobase-dependent agglomeration of AuNPs has also been observed by Storhoff et al., who reported that deoxynucleosides (dA, dG, dC) induced significant shifts in the surface plasmon band frequency due to agglomeration while dT only induced slight changes. Reference Storhoff, Elghanian, Mirkin and Letsinger47 To further investigate the effects of polyadenine on AuNP aging effects in the current work, two additional incubation conditions are undertaken. First, while a 2 μM concentration of oligonucleotides is typically used in the current studies, a 0.1 μM concentration is also explored in select oligonucleotide cases such as A20. Even at this lower polyadenine concentration, however, a red shift and peak broadening effect are observed, though to a lesser extent as shown in Supporting Information [FIG. S2(a,b)]. Second, while incubation studies typically involved adding freshly prepared (within 30 min) gold seeds to the various oligonucleotide solutions, supplemental studies demonstrate that the same peak trends occur even if A20 is not added until the AuNP seed solution has already aged for 7 d as shown in Supporting Information (see FIG. S3). To further examine the effects of individual bases alone, analogous 7 d incubation studies on the monomeric derivatives of oligonucleotides (e.g., dNTPs, dNMPs) are also carried out as shown in the Supporting Information [see FIG. S4(a,c)]. The lack of spectral differences between any of the nanoparticle suspensions in these cases, however, indicates that the polymeric nature of polyadenine plays a key role in affecting spectral behavior and further supports the likelihood of polyadenine-induced nanoparticle bridging.
UV–Vis spectra of (a,b) gold seed and (c,d) gold seed in AuNR growth solution following incubation with various 20 base-long homopolymers (A20, T20, C20, G20) and random (R20) sequences for 2 h (left) and 7 d (right). Controls involve the addition of 2 µL of Tris HCl (Ctr1) or 2 μL of nanopure water (Ctr2) in the absence of DNA. The resulting peak wave length values are included in the legend.

B. Effects of 20 base-long homopolymer additions to gold seeds in AuNR growth solution
In the next series of DNA incubation studies, freshly prepared (within 45 min–1 h) AuNP seeds are first added to a AuNR growth solution and this mixture is then added to various nucleic acid solutions. Following a 2 h incubation time, two peaks are observed to form in either the absence (controls) or presence of DNA as shown in Fig. 1(c). Prior studies indicate that the dual peaks are associated with the transverse and longitudinal axes of AuNR. Reference Lohse and Murphy2,Reference Huang, Neretina and El-Sayed15 Differences between the transverse peak wave length values (∼520 nm) are typically small; however, differences in the longitudinal peak wave length values (∼600–1600 nm) between various AuNR suspensions can be significant and are generally attributed to differences in the aspect ratio of the AuNR (e.g., a lower longitudinal peak wave length value corresponds to nanorods with a lower aspect ratio Reference Lee and El-Sayed51 ). As compared to the control cases, the most significant spectral differences at the 2 h timepoint involve a modest blue shift in the presence of polythymine, T20, and the 20 random base DNA, R20, cases. At a lower DNA concentration of 0.1 μM, however, spectral differences are not as apparent for any of these sequences as shown in Supporting Information [see FIG. S2(c)]. As these suspensions continue to age in AuNR growth solution for 7 d, the longitudinal peak undergoes a blue shift in every case, but to a different extent depending on the sequence as shown in Fig. 1(d). In previous reports, this shift to lower longitudinal peak wave length values with prolonged growth time in the absence of DNA has been attributed to nanoparticle overgrowth resulting in nanorod-like shapes with smaller aspect ratios. Reference Zweifel and Wei52 In particular, the random R20 sequences appear to ultimately have the most dramatic effect on this blue shift effect of the longitudinal peak. In fact, while transverse and longitudinal peaks are still evident by the seventh day in the controls and homopolymer cases, these peaks nearly merge in the R20 case, even at a lower concentration of 0.1 μM [see FIG. S2(d) in Supporting Information]. Here, the A20 strands do not impose the destabilizing effect evident in the aged AuNP suspensions alone [see Fig. 1(b)]. In fact, of all the homopolymers, it is polythymine, T20, that has the most dramatic effect on peak shifts over time as shown in Fig. 1(d). Similar to the aged AuNP studies, analogous incubations for seeds in the AuNR growth solution with dNTPs do not result in any significant differences in the dual peaks observed in the UV–Vis spectra as shown in Supporting Information [see FIG. S4(b)]. Thus, this result further indicates that the polymeric nature of the oligonucleotides plays a key role in the spectral evolution of these nanoparticle suspensions.
C. Effects of homopolymer mixture additions to gold seed suspensions
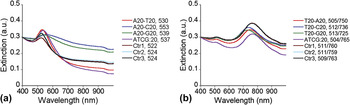
In the next series of studies, specific mixtures of homopolymers are added and suspensions are examined following a 7 d incubation time. To evaluate if the observed A20-induced aggregation effect on aged AuNP seeds is mitigated by the presence of other bases, A20 is first mixed with one other homopolymer (T20, C20, or G20) and then added to seed solutions for a 7 d aging timeframe. Figure 2(a) shows the UV–Vis spectra of the resulting suspensions in which the peak broadening effect is increasingly mitigated by the copresence of one other homopolymer in the following order: C20 < G20 < T20 as well as by the copresence of all four homopolymers. In competitive adsorption studies conducted by Kimura-Suda et al., the relative adsorption affinities of 5-mer ssDNA oligonucleotides on gold surfaces were reported to be T (weakest) < G < C < A (strongest). Reference Kimura-Suda, Petrovykh, Tarlov and Whitman46 This trend is comparable to our results in which one can infer that the homopolymer (A20) causing nanoparticle aggregation [see Fig. 1(b)] is likely to be the strongest adsorbate. Furthermore, when incubated in the presence of two homopolymers with increasingly weaker binding affinity for the gold substrate (C20 (strongest adsorbate) > G20 > T20 (weakest adsorbate)), the degree of A20-induced aggregation also diminishes in the same order in Fig. 2(a). In the case of these homopolymer mixtures, however, one must consider both the DNA–nanoparticle interactions as well as the DNA–DNA interactions. The A20–T20 mixture is a particular case in which polythymine has the weakest apparent affinity for the nanoparticles, but the strongest affinity for polyadenine. Compared to all other homopolymer combinations, the dual mixture of A20–T20 promotes the smallest differences in the peak location (530 nm) and breadth compared to the controls. Given the complementarity between strands and the distinctive spectroscopic effect compared to the other homopolymer additions, it is likely that a mixture of A20 and T20 strands leads to the formation of partially hybridized duplexes that inhibit single-stranded overhangs or unhybridized segments of a polyadenine “tail” from forming bridges between nanoparticles and causing the aggregation evident in the pure A20 case shown in Fig. 1(b). Notably, spectra at an early time (2 h) remain featureless indicating that mixtures of homopolymers, even A20–T20, do not promote any significant, immediate differences in the spectra (see FIG. S5 in Supporting Information).
UV–Vis spectra of (a) gold seeds after a 7 d incubation and (b) gold seed in AuNR growth solution after a 2 h incubation in the presence of various homopolymer mixtures of two or four sequences. Controls involve the addition of Tris HCl (Ctr1 = 4 µL Tris HCl; Ctr2 = 8 µL Tris HCl) or water (Ctr3 = 4 µL nanopure water) in the absence of DNA. The resulting peak wave length values are included in the legend.

D. Effects of homopolymer mixture additions to gold seeds in AuNR growth solution
Given the faster evolution of peak formation and the shifts in the longitudinal peak wave length values over time for AuNR growth solution conditions shown in Figs. 1(c) and 1(d) compared to that of AuNPs in Figs. 1(a) and 1(b), analogous experiments with homopolymer mixtures under AuNR growth conditions were conducted to evaluate the effects of the T20 sequence on resultant spectra after a 2 h incubation (instead of 7 d). Figure 2(b) shows that the blue shift resulting from the presence of T20 is increasingly suppressed by the copresence of one other homopolymer in the following order: G20 < C20 < A20 as well as by the presence of all four homopolymers. Similar to the aged gold seed solution shown in Fig. 2(a), it is likely that specific base effects of single-stranded polythymine on seed growth in AuNR growth solution are inhibited by Watson–Crick base pair matching in the T20–A20 mixtures.
E. Effects of 20 base-long complementary strands alone and mixed together on aging gold seeds
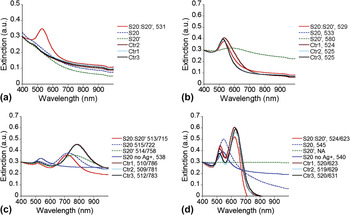
The next series of DNA incubation studies involves the addition of two complementary sequences (S20 and S20′) consisting of 50% thymine and 50% adenine bases, respectively, as shown in Table I and capable of forming S20:S20′ duplexes under the incubation conditions explored for gold seed formation and nanoparticle growth explored here (see FIG. S6 in the Supporting Information). Similar to the ssDNA incubation studies discussed in the previous section, here the effects of dsDNA additions on AuNP formation are explored using UV–Vis spectroscopy as shown in Fig. 3. As before, gold seeds here are aged with various DNA solutions. Figure 3(a) shows that by the 2 h timepoint, the spectra remain featureless for the ssDNA cases of S20 or S20′ alone; however, a peak at 531 nm does appear if both complementary strands are present. The emergence of this peak at this early timepoint indicates that rapid nanoparticle growth occurs in the presence of the duplexes. Moreover, it is clear that this result is due to the presence of S20:S20′ duplexes and not the single-stranded sequences since no characteristic peaks appear at the 2 h timepoint if gold seeds are incubated with the individual single-stranded S20 or S20′ oligonucleotide strands. The early emergence of this peak is also observed at the lower concentration (0.1 µM) of S20:S20′ duplexes as shown in Supporting Information [FIG. S7(a)]. Notably, this characteristic peak was not evident at early timepoints for the complementary A20–T20 mixtures (see FIG. S5 in Supporting Information). The differences between these two mixtures may be attributed to differences in the duplex structure since the primary structure or specific sequence of bases in S20 and S20′ strands promotes the formation of duplexes with blunt ends while a rich range of partially hybridized duplexes with single-stranded overhangs of varying baselength are possible for an A20–T20 mixture. As shown in Fig. 3(b) following a 7 day incubation, similar spectra occur in all cases with and without the presence of DNA, with one exception. Similar to the A20 case shown previously in Fig. 1(b), the adenine-rich S20′ also causes a peak broadening effect as evidenced by a red-shift of the characteristic peak from 524 (for the controls) to 580 nm [see Fig. 3(b)]. Separate TEM micrographs confirm the formation of AuNSs in the presence of the S20:S20′ duplexes [see FIG. S1(b,c) in the Supporting Information].
UV–Vis spectra of (a,b) gold seeds and (c,d) gold seeds in AuNR growth solution following incubation with various complementary ssDNA alone (S20 or S20′) and mixed together (S20:S20′) for 2 h (left) and 7 d (right). Controls involve the addition of Tris HCl (Ctr1 = 4 µL Tris HCl; Ctr2 = 2 µL Tris HCl) or water (Ctr3 = 2 µL nanopure water) in the absence of DNA. The resulting peak wave length values are included in the legend. The letters “NA” in this legend for S20′ in (d) indicate that the suspension spectra could not be measured due to formation of an aggregated pellet that could not be redispersed on day 7.

F. Effects of 20 base-long complementary strands alone and mixed together on gold seeds in AuNR growth solution
In contrast to the early appearance of a single peak in aged gold seed solutions incubated with S20:S20′ duplexes as described above, gold seed in AuNR growth solution incubated with the S20:S20′ duplex solutions exhibits a larger blue shift of the longitudinal peak compared to the controls at the 2 h timepoint as shown in Fig. 3(c). At the 7 d timepoint, however, there is little difference in the translational and longitudinal peak wave lengths (∼520 and ∼620 nm) between the S20:S20′ case and the control samples with no DNA additions as shown in Fig. 3(d). The thymine-rich S20 case, on the other hand, promotes the most significant effect on the spectra causing a large blue shift of the longitudinal peak at the 2 h timepoint which continues to shift until it ultimately merges with the translational peak to form a single peak at 545 nm at the 7 d timepoint. Intriguingly, this blue shift effect observed for this thymine-rich (50%) S20 sequence is more dramatic than that observed for the pure polythymine case shown in Figs. 1(c) and 1(d). Moreover, the adenine-rich (50%) S20′ sequence causes only a modest blue shift during the early incubation time in Fig. 3(c), but causes extensive aggregation over the long incubation time shown in Fig. 3(d). The featureless spectra shown in Fig. 3(d) for the S20′ case are due to the fact that the aggregate ultimately adheres to the reaction vessel wall during the 7 d incubation time and could not be redispersed for spectroscopic evaluation. In contrast to the S20 and S20′ cases, the longitudinal peak undergoes a more modest blue shift in the other cases shown in Figs. 3(c) and 3(d) in which two peaks remain evident at all timepoints. The presence of the single peak by day 7 in the S20 case suggests that the particles are likely to be more spherical in shape as indicated by TEM micrographs shown in Supporting Information [see FIG. S8(a)]. As a separate set of experiments, additional incubation studies conducted in the absence of silver nitrate indicate that only a single peak occurs at the 2 h and 7 d timepoints in either the presence [see Figs. 3(c) and 3(d)] or absence (results not shown) of S20 strands. Silver ions reportedly promote the anisotropic growth of the CTAB-stabilized gold seeds into AuNRs through their preferential deposition onto {110} faces during particle growth, effectively inhibiting growth on this plane and promoting growth in the [100] direction on {111} facets. Reference Orendorff and Murphy23 While the formation of nanorods themselves does require the presence of silver nitrate, the presence of DNA sequences such as the thymine-rich S20 does appear to significantly affect the spectral evolution of AuNRs and may even inhibit the role of silver nitrate in promoting stable AuNR growth over time. In addition, unlike the accelerated growth effects of S20:S20′ mixtures on AuNP seed in the absence of AuNR growth solution at both 2 [see Fig. 3(a)] and 0.1 μM [see FIG. S7(a) in the Supporting Information], a lower concentration of S20 (0.1 µM) does not promote significant differences in the AuNR spectra compared to the controls as shown in Supporting Information [FIG. S7(c,d)].
G. Effects of select ssDNA sequences on spectral evolution of AuNR growth solutions
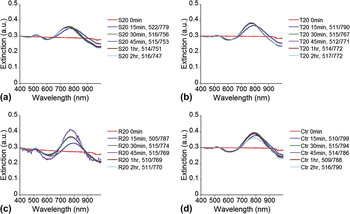
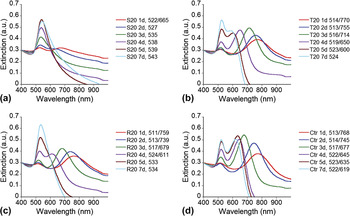
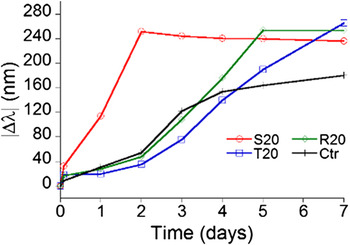
The ssDNA cases (T20, R20, and S20) promoting the most dramatic blue shift in the longitudinal peak wave lengths from studies described above were selected for a more detailed study to monitor peak evolution over several timepoints during the first 2 h (Fig. 4) and first 7 d (Fig. 5). As shown in Figs. 4(a)–4(d), the characteristic transverse and longitudinal peaks appear within 15 min of adding seeds to AuNR growth solution in either the absence (controls) or presence of DNA. As reported previously by Zweifel and Wei, Reference Zweifel and Wei52 a blue shift of the longitudinal peak of AuNR during growth does occur within the first 2 h in the absence of DNA; however, for the control case shown in Fig. 4(d), only a small shift (Δλ = 9 nm) in the longitudinal peak location occurs over this 2 h period. Larger shifts, on the other hand, are observed in the presence of DNA for the S20 (Δλ = 32 nm), T20 (Δλ = 18 nm), and R20 (Δλ = 17 nm) cases. These suspensions involving S20, T20, or R20 additions were then monitored daily over a 7 d period as shown in Figs. 5(a)–5(d). Within 1 d, S20 induces the most dramatic blue shift in its longitudinal peak wave length (Δλ = 114 nm) as compared to its 15 min timepoint value. The dramatic blue shift continues for the S20 case until this longitudinal peak merges with the translational peak to form a single peak (535 nm) within three days. A similar merger of peaks (533 nm) occurs by day 5 for the R20 case. While a blue shift of the longitudinal peaks continues for the T20 and control cases, two distinct peaks still remain apparent by day 7 for these two cases. For more facile comparison, the relative change in the longitudinal peak wave length value over time is plotted in Fig. 6 using spectra presented in Figs. 4 and 5 for the S20, R20, T20, and control cases. As shown in Fig. 6, larger blue shifts in the longitudinal peak wave length values are generally observed in the presence of any of these DNA sequences than in the absence of DNA, particularly at later timepoints. Of these DNA sequences, the shift in peak values occurs most rapidly for the S20 case. In contrast to the shifts observed for the longitudinal peak, the transverse peak (ranging from 505 to 530 nm, depending on suspension conditions) remains relatively unchanged over time for a given suspension. This result is not surprising since the transverse peak is reportedly relatively insensitive to differences in the aspect ratio of AuNRs. Reference Eustis and El-Sayed53 Additionally, it has been shown that suspensions with dispersed AuNSs with a size range of 5–20 nm have a similar characteristic peak value (∼520 nm). Reference Link and El-Sayed54
UV–Vis spectroscopy over the first 2 h (in 15 min intervals) of gold seeds in AuNR growth solution incubated with the following solution additions: (a) S20, (b) T20, (c) R20, or (d) 2 µL Tris HCl only (no DNA). The resulting peak wave length values are included in the legend.

UV–Vis spectroscopy over the first 7 d (1-day intervals) of gold seeds in AuNR growth solution incubated with the following solution additions: (a) S20, (b) T20, (c) R20, or (d) 2 µL Tris HCl only (no DNA). The resulting peak wave length values are included in the legend.

Relative difference between AuNR longitudinal peak values over time relative to the first observed peak timepoint (at 15 min) for various DNA sequence incubation conditions.

In addition to the spectral analysis in which nanoparticle shape information can be inferred, TEM was performed following a 3 d incubation with these select sequences as shown in Supporting Information (FIG. S8). As expected for the S20 incubation case in which only a single UV–Vis peak was observed for the nanoparticles, only spherically shaped nanoparticles are found [see FIG. S8(a,e) in the Supporting Information]. The T20 incubation case yields mostly nanorods with a few larger spherical and oblong particles [see FIG. S8(b) in the Supporting Information] while R20 and the control (no DNA) resulted primarily in oblong nanoparticles with a small aspect ratio [see FIG. S8(c) and (d) in the Supporting Information].
IV. CONCLUSIONS
In the current work, monomeric forms of the nucleic acids do not appear to affect the spectral evolution of growing nanoparticles. In contrast, base-specific and structure-specific effects of 20 base-long oligonucleotides are evident in several cases involving seed-mediated growth of AuNPs. Moreover, while the distinctive and likely dynamic role of the cationic CTAB species is not clear, separate washing studies indicate that CTAB is only weakly bound to the gold surface. Thus, displacement by a stronger adsorbate such as polyadenine to cause aggregation in the aged AuNP seed is possible. Among the homopolymers, the modest base-specific effects are observed in terms of the timing and extent of the blue-shift of the longitudinal peak of the AuNRs in the case of polythymine. For either nanoparticle case, however, the copresence of the complementary homopolymer lessens the effect of the homopolymer alone. In fact, the secondary structure of the DNA appears to play a key role in the evolution of the nanoparticle spectra since the presence of blunt-end duplexes has a marked effect on accelerating nanoparticle growth in an aging gold seed solution. This accelerated growth, however, was not observed for mixtures of complementary homopolymers, which can likely form a heterogeneous population of short hybridized segments (of varying baselength) flanked by single-stranded segments. Collectively, the interactions between complementary oligonucleotides involving Watson–Crick base pair matching appear to either completely overcome (for blunt-ended duplexes) or at least reduce (for duplexes with single-stranded overhangs) interactions between oligonucleotides and nanosized gold particles during their growth. Ongoing work involves competitive adsorption studies between nucleic acids on various gold surfaces to further elucidate any relative affinity differences arising from base-specific as well as structure-specific effects on gold–DNA interactions.
Supplementary Material
To view supplementary material for this article, please visit http://dx.doi.org/jmr.2014.409.
TEM micrographs and additional UV–Vis spectra of nanoparticle suspensions (PDF).
ACKNOWLEDGMENTS
The authors gratefully acknowledge the funding support of GT-AFOSR BIONIC Center of Excellence (FA9550-09-1-0162) and AFRL/RX. M.T. also acknowledges support of a NIH Training Grant (T32, NIBIB, T32EB006343-02), NSF Graduate Research Fellowship, and a GAANN Fellowship. Flow cytometry studies were carried out at the Petit Institute for Bioengineering and Bioscience (IBB) Core Lab facilities. TEM characterization was carried out in the Center for Nanostructure Characterization at the Georgia Institute of Technology.