Introduction
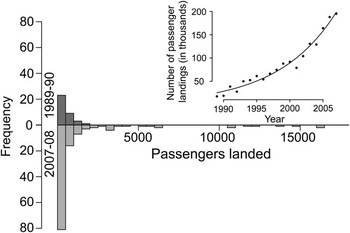
Commercial, shipborne tourism in the Antarctic Peninsula grew exponentially between 1989–90 (the first year for which data is available) and 2007–08 (Fig. 1, inset), and tourist visitation to the Antarctic Peninsula and its potential environmental impacts have been a concern since at least 1966 (Antarctic Treaty Consultative Meeting (ACTM) IV Recommendation IV-27; ATCP 1966). Management of Antarctic tourism by the Antarctic Treaty Consultative Parties would benefit from a thorough analysis of locations where tourist activity is occurring and concentrating, as well as an assessment of potential impacts from this activity. The US National Science Foundation began compiling tourism visitation data in the 1989–90 season with assistance from the International Association of Antarctica Tour Operators (IAATO) following its inception in 1991. These data included both annual totals of numbers of visitors and the number of ship visitors and visitors ashore at specific landing sites. Since 2003, these data have been compiled under the auspices of IAATO and regularly reported to annual Antarctic Treaty Consultative Meetings (IAATO 2006, 2007, 2008). Previous analyses of the concentration of shipborne tourism on the Antarctic Peninsula have been limited to a cataloguing of passenger landings (Enzenbacher Reference Enzenbacher1992, Naveen Reference Naveen1997, Reference Naveen2003, Naveen et al. Reference Naveen, Forrest, Dagit, Blight, Trivelpiece and Trivelpiece2001, Crosbie Reference Crosbie2005), analyses of passenger activities at specific landing sites (Pfeiffer & Peter Reference Pfeiffer and Peter1994, Fraser & Patterson Reference Fraser and Patterson1997, Crosbie Reference Crosbie1998), or have identified sites of high biodiversity particularly prone to potential environmental disturbance (Naveen et al. Reference Naveen, Forrest, Dagit, Blight, Trivelpiece and Trivelpiece2001, Naveen Reference Naveen2003). These site-focused analyses are not sufficient because they do not capture potential impacts deriving either from the ships themselves, or from the activities of passengers while on board the ships. Nevertheless, these reports, along with the Site Compendium of Antarctic Peninsula Visitor Sites (Naveen Reference Naveen1997, Reference Naveen2003) and the personal experience of expedition leaders and trip guides, has assisted the development of site-specific management guidelines by the Antarctic Treaty Consultative Parties (e.g. ATCM XXVIII Resolution 5 (ATCP 2005), ATCM XXIX Resolution 2 (ATCP 2006)).
Histogram of the season-wide total number of passengers landed (at each site which recorded at least one landing) for the 1989–90 (top; dark grey) and 2007–08 (bottom; light grey) seasons. Inset: Number of total passenger landings from 1989–90 to 2007–08 (solid circles) with the best-fit exponential model (black line).

Other aspects of Antarctic tourism that have not been previously quantified include potential impacts from the ships themselves (e.g. discharges, noise); the egress, ingress, and travel of ships within the Antarctic Peninsula region; the concentration of marine traffic in specific widely-used corridors; and, in the context of new Site Guidelines, the changing concentration of site visitation from season to season. Without spatially explicit data on ship traffic and access routes, it is impossible to consider other issues involving tour ship traffic in the Antarctic, such as concerns over greywater discharge or the introduction or spread of non-native species between sites. In this paper, we review the current data on tour ship landings, use a spatially explicit network analysis to reconstruct patterns of marine traffic, and discuss the implications of these patterns for the management of Antarctic tourism. In time, these data should be used in conjunction with information on all ship traffic along the Antarctic Peninsula to give a comprehensive picture of the actual and potential future threats posed by marine traffic in this region. Our approach is widely applicable to other environmentally sensitive areas experiencing significant marine-based ecotourism, where the potential impacts of visitation occur both at specific destination sites and in the ocean “matrix” in which these sites reside.
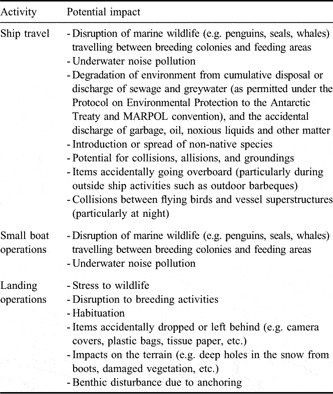
Historically, the potential impact of tourism on the Antarctic focused on impacts to wildlife (principally, but not exclusively, seabirds) and, moreover, has been considered strictly in terms of individual visitors walking adjacent to, or standing in close proximity to, wildlife as part of a landing activity. This has motivated a range of studies which have sought to quantify the “impact” of tourism by dividing landing sites into “visited” or “high disturbance” colonies and “control” or “low disturbance” colonies (Nimon et al. Reference Nimon, Schroter and Stonehouse1995, Cobley & Shears Reference Cobley and Shears1999, Crosbie Reference Crosbie1999, Holmes et al. Reference Holmes, Giese, Achurch, Robinson and Kriwoken2006, Carlini et al. Reference Carlini, Coria, Santos, Libertelli and Donini2007, Trathan et al. Reference Trathan, Forcada, Atkinson, Downie and Shears2008) or into regions classified by the relative extent of visitation each colony receives (e.g. Lynch et al. in press). These approaches, however, can be limited as seabird populations are known to fluctuate widely for many reasons, and there remain many gaps in our knowledge of the cumulative effects on Antarctic biota (De Poorter & Dalziell 1997, Emslie Reference Emslie1997, SCAR 2008). Nor do these studies address the fact that the terrestrial portion of a landing visit is but one component of a multifaceted interaction between visitors and that landing site. Other forms of interaction (and potential impact) include various aspects of ship traffic and small boat operations that, while considered in IAATO tour operators’ Environmental Impact Assessments, have only rarely been assessed in scientific studies in Antarctica (Table I). These interactions are shared among all the wildlife at a site, including those breeding in so-called “control” colonies.
A catalogue of potential interactions between tourism activity and wildlife on the Antarctic Peninsula.

Methods
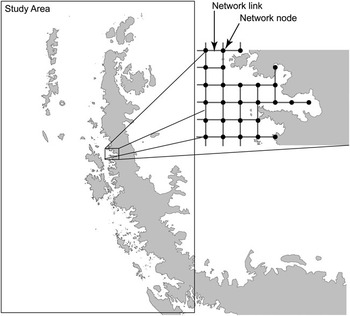
Data on tourism visitation (which excludes recreational visits by research station personnel) were provided by the International Association of Antarctica Tour Operators (IAATO) and thus reflect the activities of IAATO member companies, which encompass approximately 95% of all of the commercial cruise ships operating on and approximately 90% of all the known visitors to the Peninsula. Records of site-specific landings are available going back to the 1989–90 season. Digital records of individual ship locations were available from the 2003–04 season to the 2007–08 season and included locations and times for passenger activities (usually passenger landings or small boat cruises) but did not include information on ship routing between stops. To reconstruct ship tracks from activity locations, the Peninsula waters were divided into a square grid network of locations (Fig. 2). In this network, grid nodes were spaced 6 km apart and travel between nodes was permitted in the four cardinal directions. Ship tracks were constructed using the ‘GraphPath’ Function in Mathematica (Wolfram Research 2007) which calculates the shortest path on the network connecting each activity location to the next. As the network does not include nodes on land features, reconstructed ship routes include navigation around islands and other terrestrial obstacles, but they do not account for routing measures designed to avoid sea ice, high winds, or other itinerant conditions. Unless specifically noted in the ship itinerary, these reconstructed routes also do not account for scenic cruising not involving a passenger landing (including whale watching), even though these activities may involve multiple stops and/or the deployment of small boats. Except where otherwise specified, ships were assumed to begin and end their itinerary from Ushuaia, Argentina, and ‘entered’ the network at the node closest to their first known ship location. Summary patterns of ship itineraries were ground-truthed based on the personal knowledge of ship officers experienced in Antarctic Peninsula cruises. The final tally of ship passages along each link of the network (i.e. a segment connecting two nodes) was spatially smoothed using Gaussian kriging to produce a continuous two-dimensional map of tour ship traffic along the Peninsula. Among other things, these methods allow a depiction of ship-borne tourism concentration from season-to-season.
Study area showing the region of the Antarctic Peninsula considered in this study. The square grid network (inset: composed of nodes (black circles) and links (black lines)) does not include points that fall on land.

Results
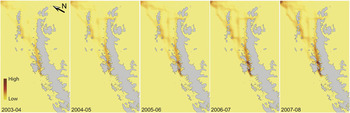
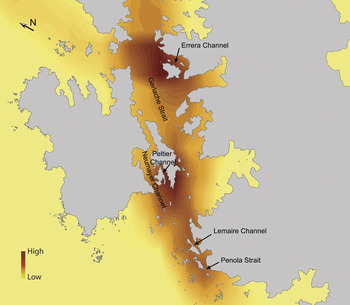
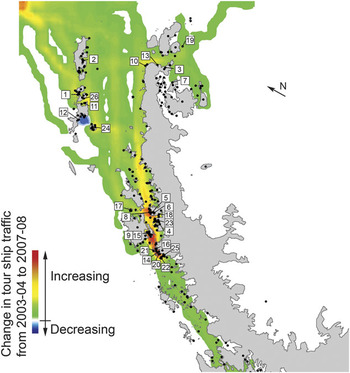
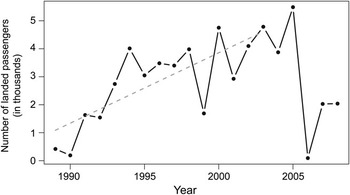
While the number of passengers landed has increased exponentially since the 1989–90 season (Fig. 1, inset), this increase has not been borne equally by all sites, and the increase in traffic has disproportionally affected the most popular sites (Fig. 1). Although the Peninsula-wide rate of exponential increase is 0.11 ± 0.01 (mean ± 1 s.e.), several sites show rates of increase that significantly exceed that, including Half Moon Island (0.15 ± 0.01), Neko Harbour (0.18 ± 0.01), and Goudier Island (0.23 ± 0.02). During the 1989–90 season, no landing sites received more than 2000 visitors, while in 2007–08, 21 sites received at least that many and eight sites received at least 10 000 visitors. Port Lockroy (Goudier Island) and Half Moon Island each received more than 16 000 passengers ashore. This concentration of activity is also reflected in patterns of marine traffic (Fig. 3; reconstructed as described in the Methods section), where several ‘hotspots’ of marine traffic are highlighted. The highest concentrations of marine traffic are found in the Gerlache Strait/Errera Channel, Neumayer Channel/Peltier Channel, and the Lemaire Channel/Penola Strait regions (Fig. 4). To the patterns of marine traffic in Fig. 3 we fit a linear trend model to look at overall patterns of change in traffic over the five year period from 2003–04 and 2007–08 (Fig. 5). Although marine traffic has increased almost everywhere (although not uniformly so), we note one clear exception which is the region surrounding the site known as Hannah Point, which has had declining levels of tour ship activity since its peak in 2005 (Fig. 6) following the institution of Site Guidelines restricting tourism activity (see Discussion).
Map of ship traffic intensity (number of ships travelling through a region in a season) for the five seasons from 2003–04 to 2007–08.

Close up of the most heavily travelled areas in the Peninsula region.

Map of the change in tour ship traffic from the 2003–04 to 2007–08 seasons. Change in tour ship traffic is defined as the slope (in a linear regression model) of traffic at each node in the network over the five years for which traffic data were available. The black dots indicate sites for which tourism statistics are collected. Sites referenced elsewhere in the manuscript are identified by number: 1) Aitcho Island, 2) Arctowski Station, 3) Brown Bluff, 4) Brown Station (formerly Almirante Brown Station), 5) Cuverville Island, 6) Danco Island, 7) Devil Island, 8) Georges Point, 9) Goudier Island, 10) Gourdin Island, 11) Half Moon Island, 12) Hannah Point, 13) Hope Bay, 14) Hovgaard Island, 15) Jougla Point, 16) Lemaire Channel, 17) Melchior Islands, 18) Neko Harbour, 19) Paulet Island, 20) Petermann Island, 21) Pleneau Island, 22) Vernadsky Station, 23) Waterboat Point, 24) Whalers Bay, 25) Yalour Island, 26) Yankee Harbour.

Number of passengers landed at Hannah Point from 1989–90 to 2008–09 and best-fit linear model for visitation at Hannah Point from 1989–90 to 2003–04 (dashed grey line).

Unusually heavy ice conditions along key access routes often preclude large areas of the Peninsula from tourism in any given year. Heavy sea ice in the Lemaire Channel and the Penola Strait in 2004–05 caused a significant decline in the visitation of several sites further south including Pleneau Island, Hovgaard Island, Petermann Island, the Yalour Islands, and Akademic Vernadsky Station. Passenger landings at these five sites were down over 60% in 2004–05 compared to the previous 2003–04 season. The sites made inaccessible for much of the 2004–05 season included several large Adélie colonies. We found a concomitant spike in traffic at more northerly Adélie colonies in the 2004–05 season as a result. Brown Bluff, Devil Island, Hope Bay, Gourdin Island and Paulet Island saw a collective increase of 127%.
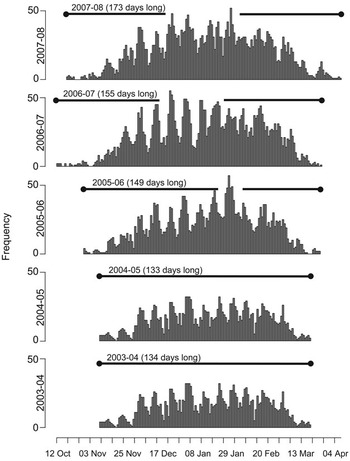
The timing of the tourist season (as defined by the number of days between the first Peninsula landing and the last) has been growing longer, and in 2007–08 was 39 days longer than in 2003–04 (Fig. 7). The season now starts earlier and ends later than it did in 2003–04.
Histogram of tourism activity (landings and non-landing visits) from 2003–04 to 2007–08 binned by individual day. The start and end of the tourist season are defined to be the date of first and last Peninsula visit.

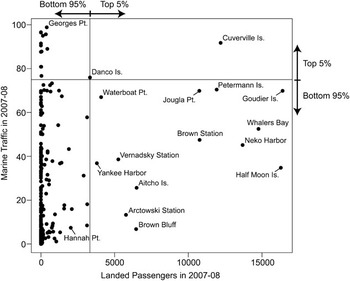
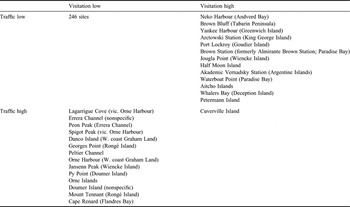
Finally, we note that there is no simple relationship linking the amount of passenger visitation at a given site (i.e. the number of passengers landed) and the amount of marine traffic experienced in the vicinity of a site (i.e. the number of ships travelling in the vicinity of a site; Fig. 8). We categorize all of the sites in the IAATO database into four categories (“low visitation - low traffic”, “low visitation - high traffic”, “high visitation - low traffic”, and “high visitation - high traffic”), where we define “high” as being within the top 5th percentile of all of the sites for either visitation (2007–08) or marine traffic (2007–08, as shown in Fig. 3) (Table II).
Peninsula sites plotted in the space of 2007–08 marine traffic (i.e. the number of ships travelling just offshore of a landing site) and 2007–08 visitation (i.e. the number of passengers landed at that site). Solid black horizontal and vertical lines demarcate the values associated with the 95th percentiles of marine traffic and visitation, respectively. Several sites are individually identified.

2 x 2 contingency table for visitation (i.e. the number of passengers landed in 2007–08) and traffic (i.e. the number of ships passing a site in 2007–08).

Discussion
Despite projected short-term downturns in tourism due to the current global recession, longer-term trends point to continued increases in Antarctic tourism. It is therefore important that we assess the distribution of this activity along the Antarctic Peninsula, where the vast majority of Antarctic tourism occurs, to facilitate good management. We see that Antarctic tourism, and its management, are inherently spatiotemporal issues involving spatially explicit information on tour ship activity. Currently, tourism on the Antarctic Peninsula is highly uneven, with almost 55% of all landings occurring at just eight sites. Highly concentrated tourism activity at a handful of sites, which some consider an issue of concern, has both pros and cons which are rarely discussed in the Antarctic context, although the optimization of use distribution (concentration versus dispersal) has been widely discussed in the broader contexts of sustainable tourism and wilderness management (e.g. Hendee et al. Reference Hendee, Stankey and Lucas1978, Hammitt & Cole Reference Hammitt and Cole1987, Bosselman et al. Reference Bosselman, Peterson and McCarthy1999, Weaver Reference Weaver2006). In envisioning the future of Antarctic tourism, it would be helpful to consider two extreme scenarios representing the bounds of the management spectrum. Under one scenario, tour activity is highly concentrated at a handful of ‘honeypot’ sites leaving most of the sites on the Peninsula largely, if not entirely, unvisited. The opposite scenario would be that tourism is more uniformly spread along all the sites of the Peninsula, with no one site receiving a disproportionate amount of tourism activity, irrespective of site-specific characteristics dictating the extent of visitation that may be accommodated. Without an underlying strategic approach, all management activities, from Site Guidelines to the establishment of ASMAs and ASPAs (Antarctic Specially Managed/Protected Areas) have the ability to unintentionally push the balance towards one of these two future extreme scenarios. While the collective effect of these individual, site-specific, management strategies probably strikes a compromise between these two extremes, in the absence of a guiding focus for Peninsula-wide management, the final composite of these piecemeal efforts may not reflect best management practices.
There are several concerns regarding the spatial concentration of tourism activity. One concern that has been voiced is that frequent visitation of particular environmentally sensitive sites may cause cumulative effects on wildlife (such as disruptions to foraging routes, stress on incubating birds, or inhibited recruitment at breeding sites) which would be avoided if tourism activity were less intense. A second concern is the loss of ‘wildness’ (variously defined) at certain heavily visited sites which may subsequently impact visitor experience. However, it may also be argued that there are a number of benefits to such highly concentrated activity. First, it is arguably easier to manage activities at a smaller number of heavily visited sites, where well-written and up-to-date Site Guidelines can help expedition staff manage passenger activities to minimize disturbance to sites and their flora and fauna. Secondly, any impacts to the resident wildlife (such as habituation) are restricted to a small fraction of the total Peninsula-wide population (see also Holmes et al. Reference Holmes, Giese, Achurch, Robinson and Kriwoken2006). Thirdly, a concentration of tourism activity will necessarily concentrate marine traffic patterns. Ship routes would be concentrated along well mapped and frequently travelled passages, and a concentration of ships would help ensure rapid response in the unlikely event of an emergency. In practical terms, the combined use of these management techniques is only likely to be truly successful if a guiding vision is used in their application - an approach which is currently lacking.
Given the current assemblage of management prescriptions and guidelines, it is important to consider the impact of current guidelines on patterns of tourism activity. As highlighted in Fig. 5, the only location to have a net decrease in ship traffic over the last five years was in the vicinity of Hannah Point. Because of its outstanding biological diversity and the high sensitivity of its>120 nesting southern giant petrels, Hannah Point was one of the first locations in the Antarctic for which Site Guidelines were developed and adopted by the Antarctic Treaty Parties (ATCM XXIX Resolution 2 (2006)). These guidelines, which were in practical effect starting in the 2004–05 season but not officially adopted until the 2005–06 season (and revised for the 2006–07 season), placed voluntary restrictions on landings between October and mid-January. The evidence indicates that at least in the last few years, these voluntary restrictions seem to be working, in that the total number of landed passengers and marine traffic in the region have decreased. However, we caution that continued monitoring of visitation at this site will be necessary to determine if the decrease in visitation since 2005 is a general trend or an anomaly. We also note that several non-IAATO vessels have continued to visit Hannah Point during the early part of the breeding season in contradiction to the guidelines (IAATO, unpublished data) and, subsequently, current levels of visitation to Hannah Point may be higher than our data would suggest. It is also important to recognize that none of the other eleven sites with Site Guidelines adopted prior to the 2006–07 season have showed decreases in visitation or marine traffic since Site Guidelines were in effect. Therefore, it appears as though Hannah Point may be the exceptional case, probably due to the fact that the Hannah Point Site Guidelines are broader and more restrictive than any of the others. In addition, the Hannah Point example highlights that protective measures of certain, highly-sensitive, sites must occur within a geographic context. A site with strict guidelines for landing may still be significantly impacted by tourism activity if it is surrounded by other popular landing sites or if it occurs along a frequently used corridor. Nevertheless, these results do indicate that the Site Guidelines, albeit voluntary, are capable of changing patterns of visitation and, given the right geographical setting, may influence patterns of marine traffic as well. As more Site Guidelines continue to be adopted by the Treaty Parties, it will be important to continue to monitor the extent to which such guidelines, as separate from other management strategies, work as intended to shape the future of tourism on the Peninsula.
The temporal extension of the tourism season, increasingly possible due to recent climate change reducing sea ice extent and extending the ice free period in the Peninsula region (Smith & Stammerjohn Reference Smith and Stammerjohn2001), offers the potential for spreading out visitation activity and thereby decreasing peak demand for landing sites during the summer. In addition, very early and late cruise itineraries (those landing guests before 1 November or after 15 March) have a substantially reduced overlap with the peak of the bird breeding season. This may offer opportunities for Antarctic cruises with a lower potential for impact on breeding activities, although perhaps at the expense of the experience of the passenger, many of whom travel to Antarctica specifically to see large and active colonies of breeding seabirds. It is also worth considering the potential risk of such “off-season” itineraries, which is, a highly reduced capacity for intervention and assistance from other cruise ships should an emergency occur.
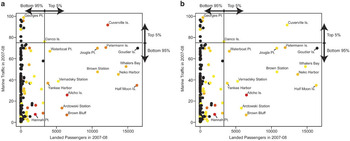
No simple relationship links the extent of passenger visitation at a given site and the amount of marine traffic experienced in the vicinity of a site (Fig. 8). Some sites are particularly popular with larger ships because of well mapped bathymetry, sheltered anchorage, and/or easy small boat access to and from the landing site, and these sites may experience high numbers of passengers ashore with relatively light marine traffic (e.g. Half Moon Island). Conversely, sites may have little or no visitation but experience high levels of marine traffic because of their proximity to heavily used channels or other popular sites (e.g. Georges Point). As an extreme example, several of the sites recorded as stops by ships and compiled by IAATO are not landing sites but represent popular cruising areas where ships may do ship-based or small boat-based scenic cruises in the absence of any terrestrial site at which to land passengers (e.g. Lemaire Channel, Melchior Islands). The contrast between these ‘no-landing’ sites and sites where visitors routinely go ashore represent opportunities to quantify the impacts (if any) of tourism on the Antarctic environment and its resident fauna at a spatial scale substantially larger than that afforded by the contrast between low and high visitation colonies at a single site (e.g. Holmes et al. Reference Holmes, Giese, Achurch, Robinson and Kriwoken2006, Carlini et al. Reference Carlini, Coria, Santos, Libertelli and Donini2007, Trathan et al. Reference Trathan, Forcada, Atkinson, Downie and Shears2008, Lynch et al. in press). Such an approach would facilitate comparisons among sites that experience tourism activities in different ways, i.e. either directly through passenger landings or indirectly via passing ship travel. Finally, we note that although several of the most heavily visited and highly trafficked sites have high species diversity (Fig. 9), only one site (Aitcho Island) in the top 5% of landed passengers would be considered highly sensitive to environmental disturbance according to criteria developed in the Compendium of Antarctic Visitor Sites (Naveen Reference Naveen2003), and even within Aitcho Island, areas of high sensitivity (moss beds, breeding areas for southern giant petrels) are designated as off-limits by the Barrientos Island (Aitcho Islands) Visitor Site Guide. Many of the most environmentally sensitive sites, including Hannah Point, are less frequently visited.
Peninsula sites plotted in the space of 2007–08 marine traffic (i.e. the number of ships travelling just offshore of a landing site) and 2007–08 visitation (i.e. the number of passengers landed at that site) and colour coded according to a. species diversity, and b. environmental sensitivity, as ranked by the Compendium of Antarctic Visitor Sites (see Naveen, Reference Naveen2003 and details therein). Diversity and sensitivity are colour coded on a continuous scale ranging from low (yellow), intermediate (orange), to high (red). Black dots denote sites for which data were unavailable. Solid black horizontal and vertical lines demarcate the values associated with the 95th percentiles of marine traffic and visitation, respectively. Several sites are individually identified.

Conclusions
Despite its reputation for isolation and emptiness, human visitation to the Antarctic is now a significant component of the overall ecology of the region, particularly along the Antarctic Peninsula where human activity, including tourism, is concentrated. Our perspective on the impact of ship-based tourism in the region needs to be broadened significantly beyond the traditional view narrowly focused on the interaction of wildlife and tourists on land. A more inclusive understanding, as introduced in this analysis, will require information on the spatial pattern of marine traffic in concert with information on landings, passengers ashore, and passenger activities so that this information may be set in context of the totality of human activity in the region. Future research in this arena would benefit significantly from continuous ship tracklog data so that ship itineraries may be known precisely. Continued efforts to map patterns of ship traffic will be a necessary component to any future management of ship based tourism.
Acknowledgements
We thank Pam Toschick and two anonymous reviewers for their help reviewing the manuscript. The authors gratefully acknowledge assistance from the US National Science Foundation Office of Polar Programs (Award No. NSF/OPP-0739515).