Implications
The aim of the study was to evaluate the frontiers and possibilities of a milking regimen without a dry period in a field trial with an automatic milking system. The focus was laid on the productivity, health, practical operability and the financial benefit in the subsequent lactation. The advantages and disadvantages of continuous milking regarding metabolism, health and fertility of the cows, the milk yield and milk composition, and the weight of the newborn calves and the medical costs during the following lactation have been examined in 98 German Simmental cows from six Bavarian farms.
Introduction
The milk prize paid to the farmers by the dairy industry is not a result of the delivered amount of milk, but of the nutrient composition of the milk. The nutritive value is higher, the more balanced the metabolism of the cow is (Beever et al., Reference Beever, Rook, France, Dhanoa and Gill1991; Contreras, Reference Contreras1998). A high protein value of the milk contributes to a more stable metabolic status of the cow, grades up the delivered milk, and has got a particularly high biological value and nutrient concentration (Lee and Lorenz, Reference Lee and Lorenz1978; Haug et al., Reference Haug, Hostmark and Harstad2007). In search of ways to increase the protein concentration of the milk, and to conserve the metabolism of the cow at the same time, the research regarding the neglecting of the dry period is of major interest (Remond et al., Reference Remond, Ollier and Miranda1992; Remond and Bonnefoy, Reference Remond and Bonnefoy1997; Remond et al., Reference Remond, Kerouanton and Brocard1997a and Reference Remond, Rouel, Pinson and Jabet1997b; Andersen et al., Reference Andersen, Madsen, Larsen, Ingvartsen and Nielsen2005; Fitzgerald et al., Reference Fitzgerald, Annen-Dawson, Baumgard and Collier2007; Madsen et al., Reference Madsen, Nielsen, Andersen and Ingvartsen2008). The drying-off period is regarded to be the recreational period for the udder: cellular regeneration takes place and the preconditions for a high milk output in the following lactation are set. Nevertheless, trials regarding the continuous milking have been carried out in the past, because the increasing milk yield has led to health and management problems of the high-yielding cow. One assumes that the animals, whose dry period is neglected, master the transition phase with less metabolic imbalances (Andersen et al., Reference Andersen, Madsen, Larsen, Ingvartsen and Nielsen2005). The phase from standing dry via calving to the high lactation is considered one of the biggest challenges for the cows’ metabolism. It is characterised by severe endocrine changes and highest performance of the metabolism (Grummer, Reference Grummer1995). Feed changes, the stress of high pregnancy, calving and the beginning lactation lead to a particular vulnerability of the cow for diseases, enhanced by an insufficient immune response (Mallard et al., Reference Mallard, Dekkers, Ireland, Leslie, Sharif, Vankampen, Wagter and Wilkie1998). Although these interconnections have not yet been fully researched, there are indications that the immune system of experimental cows reacts to noxes with slower T-cell responses during insufficient energy supply (Fox et al., Reference Fox, Hammerman and Thompson2005). Examinations have also discovered a positive co-relation of milk yield and certain diseases, such as mastitis, metritis, retentio secundinarium, claw diseases, hypocalcaemia and ovarian cysts (Fleischer et al., Reference Fleischer, Metzner, Beyerbach, Hoedemaker and Klee2001).
Material and methods
Animals, experimental design and farms
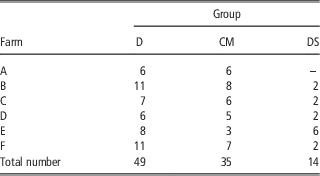
In June 2011, 98 cows of the Simmental breed were selected from six Bavarian dairy farms with automatic milking system (AMS). All animals of the dairy farms, estimating that the calving date was between August 2011 and January 2012, took part in the study for the following lactation. The allocation to the groups took place randomly, yet taking care that the group size was equal. The control group (D for dried-off, n=49) were dried-off including antibiotic treatment as usual 56 days before the calculated calving date. The test group (CM for continuous milking, n=49) kept the milking permission for the AMS until calving and were milked continuously. During the course of the examinations, a third group (DS for dried-off spontaneously, n=14) emerged from this group whose individuals dried-off themselves at least 14 days before calving. The number of cows per group for each farm is shown in Table 1.
Number of cows in each group for farm A–F
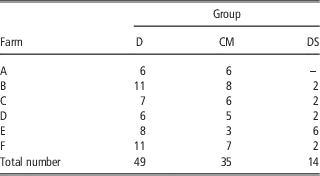
D=dried-off; CM=continuous milked; DS=dried-off spontaneously.
Three of the farms were open-front free stalls, and three were reconstructions or partially newly built with the integration of the original stall building. In all the farms, the CM and DS cows were kept in herds and therefore enabled to access the milking robot as well as provided the normal lactation ration until calving. They were transferred to a deep straw calving box not until the first signs of the immediate calving. The D cows were kept in the same building, but separated from the others and fed with an energy-reduced ration during the drying-off period.
Sampling and analysis
Blood samples
The collection of blood samples took place 8 weeks before the calculated calving date on a 2-weekly basis (week −8, −6, −4, −2), after that on a weekly basis (week −1, 0=calving, 1, 2, 3, 4, 5, 6) and later in larger intervals (week 8, 10, 14, 18, 28, 44). The Vacuette© system, one-way cannula (0.90 mm by 38 mm) and the included vacuum containers were used (Greiner Bio-One, Kremsmünster, Austria). On every blood collection date, a container with blood serum (Z Serum Clot Activator, 9 ml) as well as blood plasma (FE Sodium Fluoride/K3EDTA, 5 ml) was filled up. The containers were centrifuged (2000×g, 12 min, room temperature). The serum and plasma were separated and kept frozen at −20°C.
Analysis of metabolic parameters
One of each aliquot was sent to Synlab (Synlab.vet GmbH, Augsburg, Germany) in cooled condition to analyse glucose, β-hydroxybutyrate (BHBA), non-esterified fatty acids (NEFA) and calcium.
The IGF-1 concentration in the blood plasma was measured at the Physiology Weihenstephan (Technische Universität München, Freising, Germany) by an ELISA according to the protocol of Kliem et al. (Reference Kliem, Rodler, Ulbrich, Sinowatz, Berisha, Meyer and Schams2013).
Milk samples and analysis of milk composition
The measuring of the milk yield took place automatically at every milking by the AMS, resulting in the daily amount in kg. In addition to that, a milk sample for the examination of the number of cells, fat and protein concentration was taken from every farmer on a weekly basis. Owing to the practical operability (different milking habits of single animals), a homogenous measuring, such as the measuring of the morning milk quantity could not be carried out. The analysis of the milk ingredients protein and fat in stabilised samples took place using infrared spectrophotometer (MilkoScan FT 6000), the cell counting using flow cytometry (Fossomatic TMFC) by the Milchprüfring Bayern e.V. (Wolnzach, Germany).
Back fat thickness
The fat thickness on the back was measured with ultrasonography (Sonovet 2000; Kretztechnik, Zipf, Austria; linear probe 7,5 MHz) on weeks −8 and −4 before the calculated calving date, at the time of calving, and on weeks 2, 6, 10, 14, 18, 28 and 44 postpartum on an imaginary line between Tuber coxae and Tuber ischiadicum (Schröder, Reference Schröder2000).
Fertility parameters
The first rectal examination took place 3 weeks after the calving. The size, contractility and possible filling of the uterus, and the functional bodies on the ovaries were assessed. In case of abnormal results, the necessary treatments and regular examinations were initiated. The farmers documented the time of the first oestrus and the following cycles or inseminations, respectively. A pregnancy examination took place by rectal palpation between day 33 and 42 after every insemination. According to the obtained results, the days open and the resting period were calculated.
Disease recording
All diseases of the participating animals were recorded. Only those diseases were recorded as mastitis that combined macroscopically changed secretions and symptoms of inflammation (calor, rubor, dolor and functio laesa). Also only those animals were associated with hypocalcaemia that showed symptoms of parturient paresis. Only those cows having increased BHBA values in the blood serum (>1.4 mmol/l), but not yet showing the clinical symptoms were regarded as suffering from subclinical ketosis (Andersson, Reference Andersson1988; Duffield et al., Reference Duffield, Lissemore, McBride and Leslie2009). Those animals were regarded fallen ill with ketosis that showed obvious symptoms, such as lack of appetite, disturbed digestion and decreased milk output. A ketosis quick test of the urine proved to be positive (Medi-Test Keton; Macherey-Nagel, Düren, Germany). All diseases showing symptoms of disturbances of the genital tract at the time of puerperium were regarded as puerperal disturbances. In the present study, those were retentio secundinarium (R.S.) and metritis.
Handling of fresh born calves
Within the first 24 h after birth, the calves underwent a general examination and weighing (FX-1; Texas Trading, Windach, Germany). Calves from cows of the groups CM and DS were given deep-frozen colostrum from other cows of the farm, because a sufficient supply of immunoglobulins through the first milk could not be assumed (Gulay et al., Reference Gulay, Hayen, Head, Wilcox and Bachman2005).
Statistics
The statistical evaluation took place in collaboration with the Statistical Council of the Ludwig-Maximilians-Universität (LMU) München. To calculate the energy-corrected milk yield (ECM), the average weekly milk yield was calculated taking the daily recorded milk yield of each cow into consideration and corrected by the associated milk fat and protein concentration of the respective week using the following formula (Kirchgessner, Reference Kirchgessner1987): ECM (kg)=(0.38×fat %+0.21×protein %+1.05)/3.28×milk yield (kg). The calculation of the fertility data took place by the aid of the Poisson Regression using R Basispackage (Team R Core, 2012). In our study, the analysis using the mixed model for the variables of the blood values, milk values and the back fat thickness seemed appropriate. This model was applied through the function lmer from the lme4 package (Bates et al., Reference Bates, Maechler and Bolker2012). The Exact Test, according to Fisher, tests the dependence of various values and was used for the assessment of disease occurrence.
Results
Continuous milking in practice
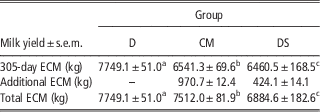
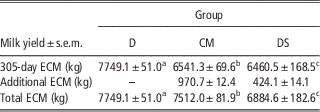
Of the 49 cows originally selected for continuous milking, 14 animals (28.6%) distinguished themselves within the 8 weeks before calving by drying-off themselves and were assigned to group DS. A further 6 cows refused milking shortly before calving (1 to 3 days), but were assigned to group CM. The moment of spontaneous drying-off was 40, 34, 29, 28, 27, 22, 20, 19 (2 animals), 17, 16 (2 animals) and 15 (2 animals) days antepartum. Cows that could be milked continuously had an higher average daily milk yield of 20.1±0.1 kg ECM compared with DS cows with only 15.1±0.4 kg ECM. Significant differences between the groups for 305 days and the total milk yield are described in Table 2.
Effect of D or CM on the ECM yield during the subsequent lactation
D=dried-off; CM=continuous milked; DS=dried-off spontaneously; ECM=energy-corrected milk.
a,b,cValues within a row with different superscripts differ significantly at P<0.05.
Milk composition
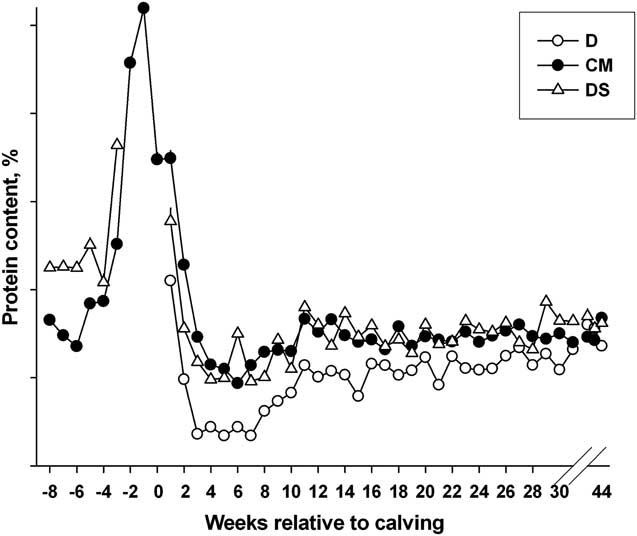
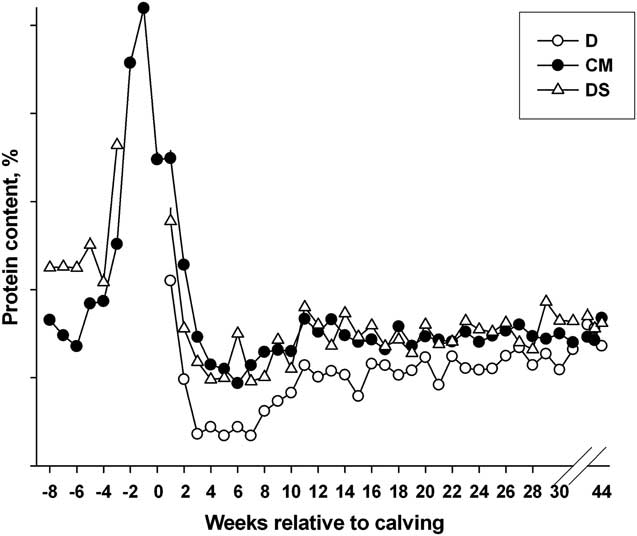
The milk of the CM cows had an average protein surplus of 0.32% (3.70±0.01%; P<0.001) over the entire test period compared with group D (3.38±0.01%). The average milk protein content of the DS cows was 3.71±0.02% and thus 0.33% higher compared with group D (P<0.001). Particularly rich in protein was the milk of the late lactation shortly before calving. The cows of the CM group reached the highest values in week −1 antepartum (5.60±0.03%, P<0.001) and DS cows in week −3 antepartum (4.83±0.03%, P<0.001) (Figure 1).
Protein content (%)±s.e.m. in milk over the continuous milked period and the subsequent lactation for groups D (dried-off), CM (continuous milked) and DS (dried-off spontaneously). Significant differences over the entire period: D v. CM (P<0.001), D v. DS (P<0.001).
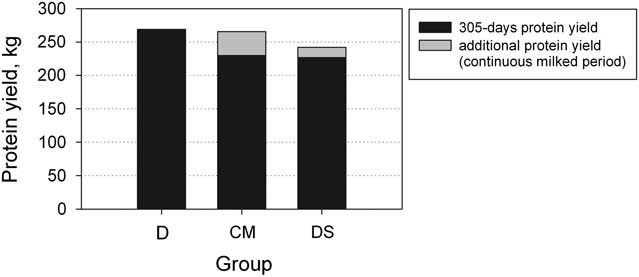
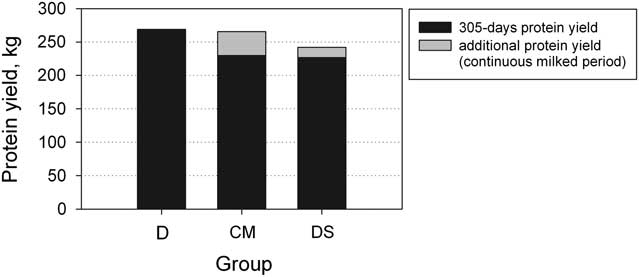
The total protein yield of the CM (260.7 kg) and DS cows (242.0 kg) did not come up to the 305-day protein yield of D cows (267.5 kg) (Figure 2).
Total protein yield (kg) in milk over the continuous milked period and the subsequent lactation for groups D (dried-off), CM (continuous milked) and DS (dried-off spontaneously). An additional protein yield is only achieved in the groups CM and DS during in the continuous milked period.
The milking regimen before calving had no influence on the milk fat content. The fat value in group D, CM and DS was 4.29±0.02%, 4.28±0.02% (P=0.9) and 4.40±0.05% (P=0.4), respectively.
Blood analysis
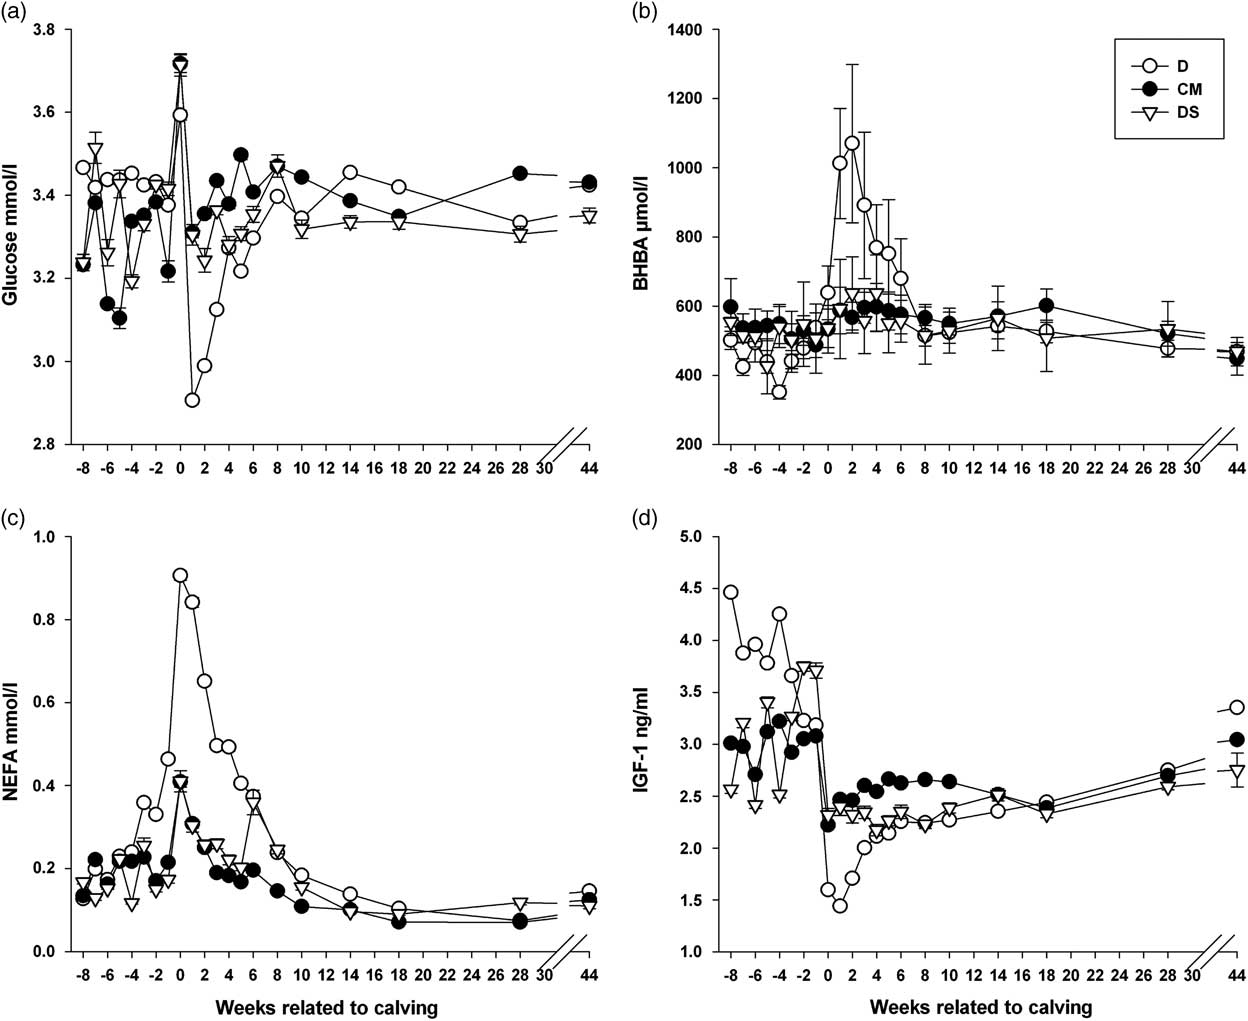
Glucose: The cows of group D had lower measurable blood glucose levels (3.21±0.03 mmol/l), compared with the cows of group CM (3.36±0.04 mmol/l; P<0.001) and group DS (3.34±0.06 mmol/l; P<0.05) during the entire test period (Figure 3a). Of the total number of cows, 76% D cows, 47% CM cows and 33% DS cows showed a glucose value lower than 3.0 mmol/l over the entire lactation on at least one measurement.
Mean values of (a) glucose, (b) β-hydroxybutyrate (BHBA), (c) non-esterified fatty acid (NEFA), (d) IGF-1 in blood±s.e.m. from 8 weeks before calving (week 0) till 44 weeks after calving for group D (dried-off), CM (continuous milked) and DS (dried-off spontaneously). Significant differences over the entire period: (a) D v. CM (P<0.001), D v. DS (P<0.05), (b) D v. CM (P<0.001), D v. DS (P<0.05), (c) D v. CM (P<0.001), D v. DS (P<0.001), (d) D v. CM (P<0.001), D v. DS (P<0.01).
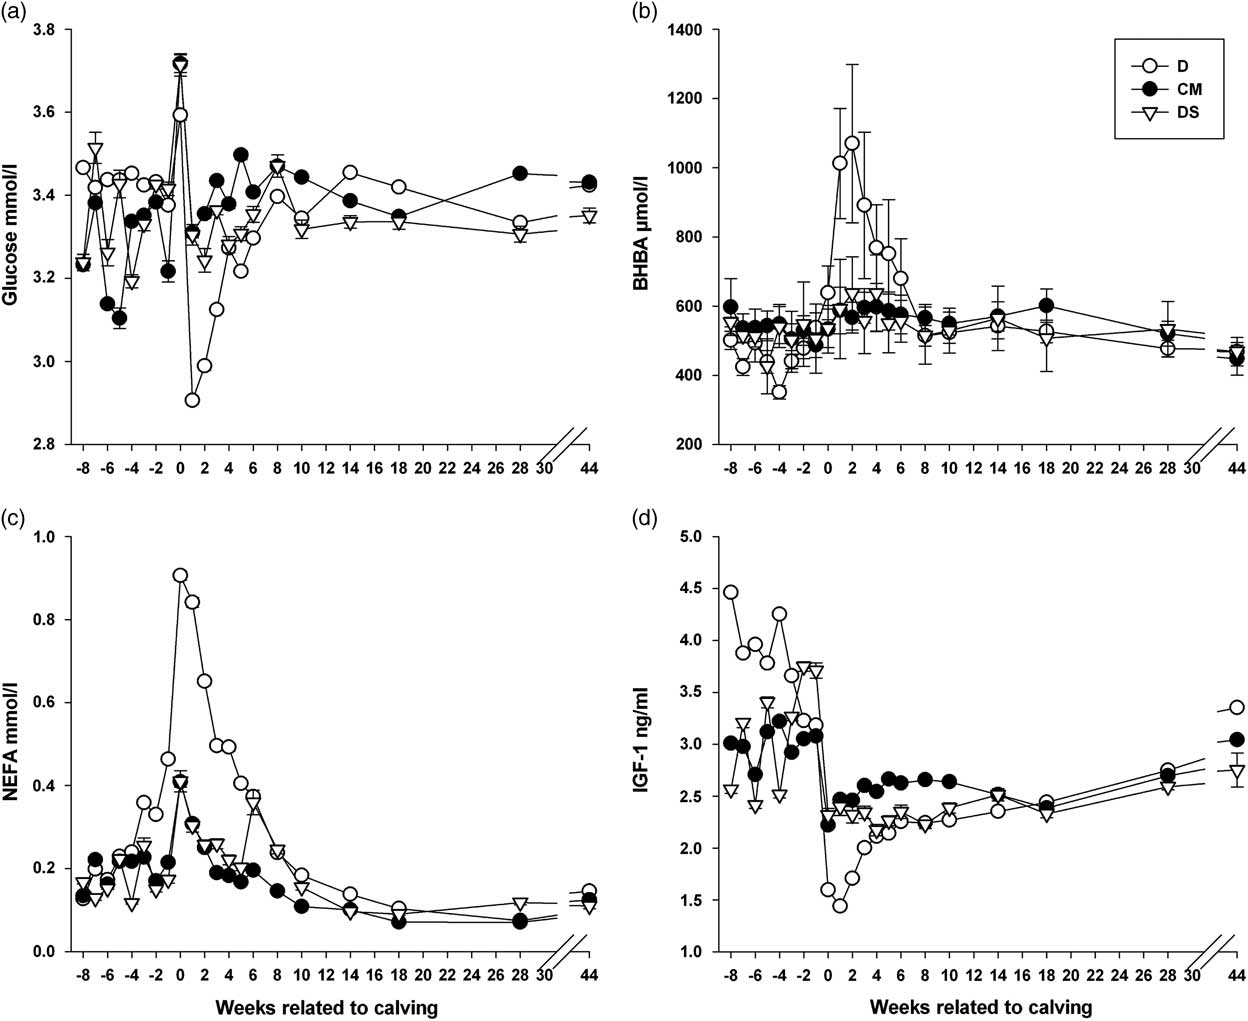
BHBA: During the entire test period, the CM cows showed a 14% lower (569.6±26.3 µmol/l; P<0.001), and DS cows a 12% lower (574.5±35.6 µmol/l; P<0.05) BHBA value compared with D cows (653.3±16.9 µmol/l). In the first 2 lactation weeks, the BHBA concentration in group D increased rapidly to 1069.6±228.4 µmol/l. The CM group had a permanent BHBA concentration under 600.0 µmol/l. Group DS only showed slightly higher values in week 2 (637.1±105.5 µmol/l) and week 4 (637.3±110.7 µmol/l). Group D reached within the 8th lactation week, almost the level of CM and DS (Figure 3b).
NEFA: Compared with group D (0.49±0.02 mmol/l), the measured NEFA concentration of group CM was 60% (0.20±0.03 mmol/l; P<0.001) and of group DS 55% (0.24±0.04 mmol/l; P<0.001) lower during the entire test period. From week −4 antepartum onwards, the values of the D cows increased more steeply than those of the CM and DS cows and were almost doubled 1 week before calving. All groups reached the highest NEFA concentration at the time of the calving. However, the CM and DS cows showed only half of the blood serum concentration than D cows. After the calving, the values decreased rapidly in every group and reached the baseline level after the 15th lactation week (Figure 3c).
Calcium: The development of the entire blood calcium level was similar in all three groups. An impact by the milking regimen could not be detected. All cows showed a rapid downfall to<2.2 mmol/l at the time of the calving (data not shown).
IGF-1: In the test period, the average IGF-1 value of group D was 2.02±0.10 ng/ml and therefore lower as those of the CM or DS cows (2.50±0.15 ng/ml; P<0.001 and 2.52±0.21 ng/ml; P<0.01). Only in the 8 weeks of the drying-off period, the IGF-1 level of the D cows was above those of the other groups. From week −8 antepartum to week −1 antepartum, a falling tendency from 4.46±0.04 to 3.18±0.02 ng/ml was recognisable, whereas the animals of group CM and DS settled at a value of 3.00±0.30 ng/ml (P<0.001). The D cows reached the lowest IGF-1 value on week 1 postpartum and rose again above 2.00 ng/ml not until 4 weeks later. Cows from the CM and DS group never fell below 2.10 ng/ml (P<0.001). With the ongoing lactation, the IGF-1 level rose continuously in all groups (Figure 3d).
Back fat thickness
The back fat thickness was measured 8 and 4 weeks before calving. The D cows built up the most body fat (21.4±0.2 mm) compared with the CM cows (17.8±0.2 mm; P<0.001) and the DS cows (18.5±0.5 mm; P<0.001). At the time of calving, the CM cows had already reduced their back fat thickness to 16.9±0.2 mm. The reduction in body fat in the D and DS cows did not start until calving. The animals of group D lost most of the body fat until week 10 postpartum followed by the DS and CM cows (12.7±0.1 mm; 15.0±0.2 mm; P<0.001 and 14.1±0.4 mm; P<0.001). All in all, the animals of the D group reduced their back fat thickness by 40% within the first 10 weeks of lactation, the CM cows by 15% and the DS cows by 27%. In the course of the remaining lactation, the back fat thickness of the CM and DS groups was significantly higher than those of the D group and reached the highest level of 18.2±0.1, 21.1±0.2 and 21.3±0.4 mm for D, CM and DS in week 44 postpartum.
Udder health, occurrence of diseases and medical costs
In our study, no measurable differences concerning the number of somatic cells in milk occurred in the individual groups. The average number of somatic cells in group D was 156 000±8000 cells/ml, in group CM 127 000±16 000 cells/ml (P=0.3) and in group DS 131 000±15 000 cells/ml (P=0.5).
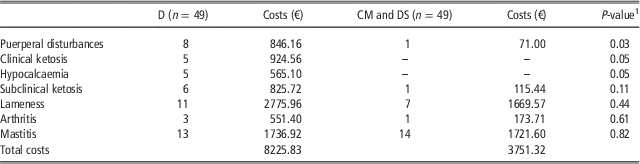
For the evaluation of the occurrence of diseases and medical costs for the treatment, the groups CM and DS were assessed together. A significantly lower disease risk could be detected in cases of puerperal disturbances (P<0.05). An effect was also found for occurrence of clinical ketosis and clinical hypocalcaemia with downer cow syndrome (P=0.05). Concerning all further diseases (subclinical ketosis, lameness, arthritis, mastitis), no measurable difference could be detected between the groups. The higher occurrence of diseases in the D group lead to higher medical costs compared with the C and DS groups (Table 3).
Effect of D or CM and DS on the occurrence of diseases and medical costs during the subsequent lactation
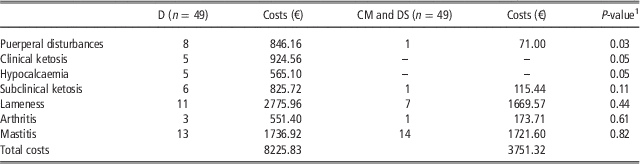
D=dried-off; CM=continuous milked; DS=dried-off spontaneously.
1 Significant differences compared with group D at P<0.05.
Fertility
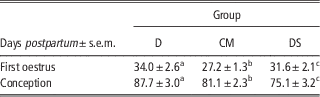
The milking regimen before calving had a measurable influence on the duration until the first oestrus occured. The D cows had their first oestrus 34.0±2.6 days postpartum. compared with the CM cows (27.2±1.3 days; P<0.001) and DS cows (31.6±2.1 days; P<0.001). The resting time of all groups was not influenced. On average, the D cows were about 1 week less successfully inseminated (87.7±3.0 days) than the CM and DS cows (81.1±2.3 days; P<0.01; 75.1±3.2 days; P<0.001) (Table 4). A connection between the number of inseminations until successful pregnancy and the milking regimen could not be detected.
Effect of D, CM or DS on fertility parameters during the subsequent lactation
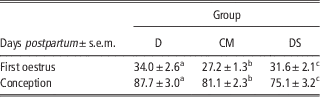
D=dried-off; CM=continuous milked; DS=dried-off spontaneously.
a,b,cValues within a row with different superscripts differ significantly at P<0.05.
Birth weight of calves
There was no influence on the birth weight of the calves by the milking regimen. The calves of the CM cows were by average 2.3 kg (45.3±1.2 kg; P=0.07), calves of the DS cows 0.5 kg (47.1±1.7 kg; P=0.8) lighter than those of the D cows (47.6±1.6 kg).
Discussion
Continuous milking in practice
In our study, those cows could be successfully continuously milked that had an average energy-corrected daily milk yield of at least 20 kg 8 weeks before calving. Cows that had a milk yield below that level often dried-off themselves. Suitable animals looked for the milking robot regularly and reduced their milk yield only slowly. Against the background of the constantly increasing milk yield, and the problems with diseases associated with the increased milk yield in the past, common methods have to be critically revised and alternatives have be taken into consideration (Breves, Reference Breves2007). Particularly suitable were cows with a high milk yield and generally good persistence. The extreme yield peak was weakened in the early lactation phase by continuous milking, and therefore the metabolic stress of the high-yielding cow was reduced, which had a measurable effect on the health condition. Arguments supporting the 8-week resting period before calving is the highest possible milk yield in the following lactation and the creation of colostrum. Concerning the immunoglobulin concentration of the latter, a higher quality of the colostrum of dried-off cows compared with continuously milked cows is to be assumed. Gulay et al. (Reference Gulay, Hayen, Head, Wilcox and Bachman2005) describe lower immunoglobulin concentration of the milk of cows with a drying-off period 30 days shorter compared with the 70 days of dried-off cows. In our study, the calves of continuously milked cows were supplied with the colostrum of other cows of the farms, which was stored frozen for this purpose.
Metabolic situation
How sensitively cows react on increased blood parameters and how they can compensate the metabolic stress depends on the genetic disposition (Klein et al., Reference Klein, Almstetter, Schlamberger, Nurnberger, Dettmer, Oefner, Meyer, Wiedemann and Gronwald2010). Concerning the BHBA, NEFA, calcium, IGF-1 blood concentration and the changes of the back fat thickness, a clear interference of the milking regimen could be shown. An improvement of the metabolic condition is also assessed in other studies (Rastani et al., Reference Rastani, Grummer, Bertics, Gumen, Wiltbank, Mashek and Schwab2005; Schlamberger et al., Reference Schlamberger, Wiedemann, Viturro, Meyer and Kaske2010). Andersen et al. (Reference Andersen, Madsen, Larsen, Ingvartsen and Nielsen2005) proves in his trial by milking 14 Holstein–Friesian cows continuously that those cows show considerably lower BHBA and NEFA blood concentrations than the 14 cows of the test group with a 7-week drying-off period. Furthermore, during the entire test period, higher blood glucose levels are measured in the test groups, which is comparable to our study results.
Glucose: A temporal disorder of the metabolic balance in the D cows becomes obvious, taking the blood glucose level into consideration. At least one measurement showed a value below the critical value of 3.0 mmol/l in 76% of the D cows, compared with only 46% of the CM cows and 33% of the DS cows. In addition to that, the average value of the D cows was significantly lower than of the CM and DS groups over the entire measuring period.
NEFA and BHBA: Especially in the D group, the rapid increase of the NEFA concentration during the calving or BHBA concentration in the first 2 weeks postpartum was obvious. The increase of those values shows the adaptation attempts of the body towards the different demands on the metabolism at the beginning of the lactation (Bowden, Reference Bowden1971). This results in negative effects on the puerperium, the milk yield and the liver metabolism (Herdt, Reference Herdt1988; Chapinal et al., Reference Chapinal, Carson, Duffield, Capel, Godden, Overton, Santos and LeBlanc2011 and Reference Chapinal, Carson, LeBlanc, Leslie, Godden, Capel, Santos, Overton and Duffield2012). A BHBA level between 1.2 and 1.4 mmol/l is associated with an increased occurrence in metritis, clinical ketosis, lack of oestrus postpartum and severe mastitis (LeBlanc, Reference LeBlanc2010; Seifi et al., Reference Seifi, LeBlanc, Leslie and Duffield2011). In our study, 10 cows of group D and only 1 cow of group CM exceeded a level of 1.4 mmol/l. The requirements on the adaptation mechanisms of the metabolism were significantly lower for the CM cows. They were adapted to daily milk removal and were able to compensate varying requirements caused by the increased milk yield. Neither feed changes nor the switch from the dried-off to the lactating part influenced the metabolism negatively. In the DS group, the BHBA and NEFA values showed a similar development: At the time of the highest milk yield, in the 6th lactation week, they almost reached their normal level.
IGF-1: The IGF-1 level of the D group during the drying-off period was significantly higher compared with the animals of the CM group. In all groups, the lowest values were measured at or around the time of the calving. Already 3 weeks before calving, the IGF-1 concentration in the blood of the D cows fell considerably, conditioned by an insufficient energy status owing to the reduced feed intake shortly before calving. In the CM and DS group, the values have never been below 2.10 ng/ml. The D cows did not reach this level until week 3 postpartum. The collected data again showed a stronger and longer lasting negative energy balance (NEB) of dried-off cows. Cows with strong NEB postpartum have lower IGF-1 levels as well as increased fertility problems (ovarian cysts, persistent corpora lutea), according to Zulu et al. (Reference Zulu, Sawamukai, Nakada, Kida and Moriyoshi2002b). He further reports a negative correlation between the height of IGF-1 level and the NEFA blood level, which is also seen in our study. The results of recent studies would also explain the relation between the higher IGF-1 level of the CM and DS cows and the shorter duration until the first oestrus or successful insemination. In the studies, it is assumed that IGF-1 functions as a mediator between the nutritive status and the reproduction performance (Thissen et al., Reference Thissen, Ketelslegers and Underwood1994; Gong, Reference Gong2002; Zulu et al., Reference Zulu, Nakao and Sawamukai2002a). Therefore, it is guaranteed that the cycle events are not started until the metabolic condition of the cows allows it (Velazquez et al., Reference Velazquez, Spicer and Wathes2008).
Back fat thickness: The reduction of the back fat thickness is an attempt to bypass the time of the NEB. An over-conditioning during the drying-off period has especially negative effects. In his study, Fronk et al. (Reference Fronk, Schultz and Hardie1980) proves that after calving over-conditioned cows responded with significantly higher insulin and NEFA blood levels and stronger reductions of weight than the control animals of the same trials with normal weight. The improved energy balance of the CM and DS cows was confirmed by the ultrasonographically measured decrease in body fat after calving: Whereas the D cows strongly mobilised their body reserves, the CM and DS cows had to rely on the mobilisation of body fat as an energy source to a lesser extent. Therefore, the CM and DS cows should suffer less from the deposit of triglycerides in the liver (Staufenbiel et al., Reference Staufenbiel, Staufenbiel, Rossow, Klukas and Johannsen1993). The increase in the back fat thickness of the CM and DS cows by the end of the following lactation was noteworthy: The positively rated smaller reduction of back fat shortly after the calving, on the one hand, and the increase at the end of lactation caused by lower milk yield, on the other, seems to lead to this increase. To prevent an adiposis of the CM cows, the energy content of the basic rations should be monitored. Remond et al. (Reference Remond, Kerouanton and Brocard1997a) also describes a lower or none-at-all fat reduction postpartum for cows with a shortened (less than 6 to 8 week) drying-off period and for continuously milked cows. Excessive increases at the end of the lactation were not mentioned.
Fertility
There is evidence in the literature that a high energy deficit followed by high BHBA and NEFA concentrations in the blood and a low IGF-1 level leads to reduced ovarian activity (Butler and Smith, Reference Butler and Smith1989; Ingvartsen et al., Reference Ingvartsen, Dewhurst and Friggens2003; Velazquez et al., Reference Velazquez, Spicer and Wathes2008; Butler, Reference Butler2010; Chapinal et al., Reference Chapinal, Carson, LeBlanc, Leslie, Godden, Capel, Santos, Overton and Duffield2012). These can also be seen in our study. The CM cows showed their first oestrous cycle 1 week earlier than the D cows owing to their better metabolic situation after calving.
Comparison of the milk yield and the protein quantity
The CM cows had a milk yield 15.6% less as the D cows in relation to the energy-corrected 305-day yield. In the literature slightly higher percentages are stated: Losses between 16.5% and 22% are measured in similar trials (Remond et al., Reference Remond, Kerouanton and Brocard1997a and Reference Remond, Rouel, Pinson and Jabet1997b; Andersen et al., Reference Andersen, Madsen, Larsen, Ingvartsen and Nielsen2005; Schlamberger et al., Reference Schlamberger, Wiedemann, Viturro, Meyer and Kaske2010). In contrast to that, as described by Remond et al. (Reference Remond, Kerouanton and Brocard1997a), the milk quantity of the D group was not even then achieved by continuously milked cows, if the milk produced during the continuous milking period was added to the 305-day yield. Although the deficit was than lower, it still was at 3.1% in our study. The reason for that might lie in the fact that the animals examined in the above-mentioned study belong to the high-yield race Holstein–Frisian and not to the dual-purpose race German Simmental breed as examined in our study. The lowest milk quantity was produced by cows that dried-off spontaneously. The 305-day yield of these cows was 16.6% or 1.2% below the cows of group D or CM. This group represented the low-yield cows of group CM, which were not suitable for a continuous milking. The CM and DS cows could not balance the losses of overall produced protein caused by lack of milk quantity, despite the surplus amount of milk protein of 0.3%. They produced 2.5% (CM: −6.8 kg) and 9.5% (DS: −25.5 kg) less protein compared with dried-off D cows. Similar surplus amounts for continuously milked cows are also described by Remond et al., (Reference Remond, Ollier and Miranda1992) with 0.2% to 0.3%. Schlamberger et al. (Reference Schlamberger, Wiedemann, Viturro, Meyer and Kaske2010) even describes almost 0.4% more protein. However, in this study, only Brown Swiss cows were examined that produce milk particularly rich in protein in the first place (Cerbulis and Farrell, Reference Cerbulis and Farrell1975).
Economic advantages of continuous milking
One clear advantage of continuous milking, compared with drying off, lies in the lesser vulnerability of those animals to diseases. Here the savings more than compensate the losses caused by decreased milk yield. All in all, diseases in group D caused costs of 8785.00 € (Table 3). In groups CM and DS, the costs were 3751.32 €. Thus, animals of groups CM and DS caused 57% less costs than group D. This means that a D cow caused costs of 179.28 €, whereas a CM or DS cow only caused 76.56 € because of diseases. The losses of milk quantity of group CM, compared with group D, were 237.1 kg (3.1%). A milk price of 0.35 €/kg was considered in our study, which resulted a deficit of 84.23 € per CM cow. Offsetting the savings of 102.72 € caused by diseases, the balance of CM cows is +18.49 € compared with D cows. In addition to that, the decreased milk yield of diseased cows, time effort of the farmer for medical treatment and travel expenses of the veterinarian were not considered in the calculation of the medical expenses. Therefore, it has to be assumed that the actual medical costs caused by diseases are significantly higher than the calculated costs. Hard to calculate are the financial effects of a better health condition and fertility of CM cows in relation to their lifetime milk yield.
The milk regimen without a drying-off period should be used as an opportunity to deliberately weaken the highest lactation peak of particularly high-yielding animals. By that the health condition and fertility of the cow as well as the composition of the milk will improve, leading to a positive financial benefit for the farmer and for the well-being of the high-yielding cow. The long-term effects on the duration of use and the lifetime yield of regularly or temporarily continuously milked cows can only be shown in long-term studies.
Acknowledgements
The authors gratefully appreciate the founding of the study by Sachsenmilch, Leppersdorf GmbH and the Bavarian Ministry for Food, Agriculture and Forest. Their sincere thanks go to all of the involved farmers, who supported this study and agreed with changing their milking regime. They also thank the colleagues at the Physiology Weihenstephan, Technische Universität München, Freising, Germany, for their assistance and support.