

When California voters entered the voting booth in 2018, they were tasked with deciding whether to cast their ballot for incumbent senator Dianne Feinstein or her challenger Kevin de León. Normally, we might expect voters to make their decisions based on their own partisan identities, with Democrats voting for Democratic candidates and Republicans voting for Republican candidates. The 2018 general election in California, however, did not afford voters the ability to vote along party lines because de León was also a Democrat. While voters may have held information about Feinstein based on her years of service in the Senate, or de León for his service in the California State Senate, the party label next to each candidate's name provided no additional cues to voters about these candidates. This unusual general election setup was the result of California's adoption of the “top-two primary” in 2012, under which candidates from both parties participate in a single primary, with the top two vote getters—irrespective of party—advancing to the general election.Footnote 1
Though the same-party matchup presented to Californians in 2018 was unusual for such a high-profile office, voters are often confronted with electoral choices in which they are unable to draw on party as a heuristic to aid in their decision-making process. An inability to draw on partisan cues could also be the result of nonpartisan elections for state- or local-level office or elections in which multiple candidates from the same party appear on the same ballot, such as primary races. In these contexts, voters are unable to rely on partisanship as a way to gauge which candidate they are more likely to be aligned with. In the face of this increasingly difficult decision, many voters opt out of selecting a candidate for a particular race (undervoting) or fail to turn out at all (Masket Reference Masket2016). Those who do decide to select a candidate must rely on other cues when making their selections. In this article, we examine whether candidate demographics—in this case, gender—are associated with voter decision-making in contexts in which partisanship does not meaningfully differentiate the candidates.
We explore candidate gender and both the decision to undervote in a particular race and the decision of who to vote for. Beginning our analysis with undervoting (or skipping over a particular race on the ballot), we examine the relationship between the gender composition of candidates and voter decision-making. We posit two reasons why candidate gender may be related to the decision of whether to skip over a particular race. The first reason is informational. In the absence of information about partisanship, candidate gender may serve as an ideological cue to voters—who are likely to perceive women as more liberal (Huddy and Terkildsen Reference Huddy and Terkildsen1993; Koch Reference Koch2002; McDermott Reference McDermott1998). In cases in which gender differentiates the candidates, these cues lead to lower costs of selecting a candidate by making it easier to differentiate between candidates when choosing who to vote for (Ondercin and Fulton Reference Ondercin and Fulton2020). Thus, in cases in which gender—but not party—differentiates candidates, we may expect to see lower rates of undervoting as voters will feel better able to select one of the candidates. The second reason is symbolic. Drawing on the literatures on descriptive and symbolic representation, we argue that women are less likely to undervote when they have the opportunity to vote for a woman candidate in a mixed-gender race or in races with two women on the ballot.
Beyond examining how the gender composition of candidates is associated with the decision of whether to vote in a particular race, we also evaluate the relationship between candidate gender and the decision of who to vote for in mixed-gender contests. Drawing on the literatures related to ideological stereotypes and gender-affinity effects, we argue that in races in which gender, but not partisanship, differentiates the candidates, Democrats and women will, on average, be more likely to vote for the female candidate. We further examine gender differences within party to gain a more thorough understanding of this relationship. To test our expectations, we draw on data from the Cooperative Congressional Election Study (CCES)—which includes a validation of voter turnout—from 2012 to 2018, to explore both candidate gender and voter participation in specific contests (conceptualized as whether voters undervote in a given race) and candidate gender and vote choice.
In our analysis of undervoting, we find inconsistent evidence that male voters undervote at different rates based on the gender composition of the candidates. Moreover, a supplemental analysis of perceived ideological distance between the candidates indicates that voters are not using gender as a heuristic in this manner. We similarly find little evidence of an information story occurring among women voters; however, we find that women are significantly less likely to undervote in both mixed-gender and female-female matchups compared to male-male contests, consistent with expectations related to symbolic representation. Our analysis of vote choice in mixed-gender matchups provides evidence that Democrats are, on average, more likely to support women candidates than Republicans, and women in each party are more likely to select the female candidate compared to their male co-partisans. This finding is consistent with recent research on gender-affinity effects in nonpartisan elections (Badas and Stauffer Reference Badas and Stauffer2019b).
We note from outset that because we are using observational survey data (rather than experimental data), our ability to evaluate causal relationships is necessarily limited. That said, our study serves as a complement to existing experimental work related to candidate gender and voter decision-making (Badas and Stauffer Reference Badas and Stauffer2019b; Crowder-Meyer, Gadarian, and Trounstine Reference Crowder-Meyer, Gadarian and Trounstine2020; Kirkland and Coppock Reference Kirkland and Coppock2018; Sen Reference Sen2017), and we uncover patterns consistent with much of this research.
The results presented here offer important insights into gender and voter decision-making in the context of same-party matchups. As the number of states considering top-two primaries increases, the number of these types of matchups is likely to increase in the future. We conclude with a discussion of the implications our findings have for the literature on gender and politics, heuristics and voting in low-information elections, and the design of electoral institutions.
HEURISTICS AND VOTER DECISION-MAKING IN LOW-INFORMATION ELECTIONS
Voters are most motivated to turn out in contexts in which the decision-making process is least taxing. That is, voters turn out at higher rates in elections when the effort required to discern which candidate is the “correct” choice is minimal (Bartels Reference Bartels2000). The most powerful heuristic for voters is often partisanship (Badas and Stauffer Reference Badas and Stauffer2019b; Campbell et al. Reference Campbell, Converse, Miller and Stokes1966; Dolan Reference Dolan2008; Lewis-Beck et al. Reference Lewis-Beck, Norpoth, Jacoby and Weisberg2008), which quickly signals to voters which candidates are on their “team.” While partisanship is one of the most useful heuristics for voters, this information is not always readily apparent at the ballot box. Some estimates suggest that about half of all elections that occur in the United States are nonpartisan (Wright Reference Wright2008). Still other races might feature multiple candidates from the same party, meaning that the cue of party no longer meaningfully distinguishes candidates from one another. Because information about partisanship is unavailable or does not meaningfully differentiate candidates, voters may turn to other cues in these contexts. For instance, candidate demographics can sometimes aid in the decision-making process (Badas and Stauffer Reference Badas and Stauffer2019b; Crowder-Meyer, Gadarian, and Trounstine Reference Crowder-Meyer, Gadarian and Trounstine2020; Matson and Fine Reference Matson and Fine2006; McDermott Reference McDermott1997). In this article, we focus on the relationship between candidate gender and voters’ decisions to vote in an electoral contest and in candidate selection.
Candidate Gender and the Decision to Vote
Before voters can select a candidate to vote for, they must first decide to make a choice at all. In contexts in which candidate partisanship is not immediately clear to voters, or in cases in which partisanship does not meaningfully distinguish the candidates (such as primary elections or other same-party matchups), the information costs associated with candidate selection increase markedly. In these contexts, many voters choose to simply opt out of making a selection. Indeed, previous research finds that turnout is depressed in nonpartisan races (Hall Reference Hall2007; Schaffner, Streb, and Wright Reference Schaffner, Streb and Wright2001) and that voters are more likely to skip races on the ballot when they feel they have insufficient information to make a choice (Wattenberg, McAllister, and Salvanto Reference Wattenberg, McAllister and Salvanto2000).
Although much of the literature focuses on voters’ decisions to turn out to vote, an equally important question is the degree to which these same-party or nonpartisan contests lead to undervoting. Unlike traditional measures of turnout, undervoting describes situations in which voters fail to make a selection in a specific contest. That is, while the voter did turn out to the polls, they opted to skip over certain races on their ballot. Undervoting should be especially likely to occur in contests in which party does not distinguish the candidates, because without this information many voters will feel ill-equipped to make a decision. Instead, they simply opt to skip over the race (Nagler Reference Nagler2015). In cases with two co-partisans on the ballot, undervoting should increase for all voters, though recent research suggests the effects are especially pronounced for “orphaned” voters—partisan voters without a candidate on the ballot (Fisk Reference Fisk2020).Footnote 2
While the lack of a party heuristic may lead to increased undervoting, if there are other easily discernible characteristics that differentiates the candidates—such as gender—this may help counteract these negative effects. Specifically, in races between male and female candidates, voters may use gender as a proxy for ideology, stereotyping women candidates as more liberal than male candidates (Dolan and Sanbonmatsu Reference Dolan and Sanbonmatsu2009; Koch Reference Koch2002). In their study of voter turnout, Ondercin and Fulton (Reference Ondercin and Fulton2020) argue that these stereotypes help voters more easily place candidates on an ideological spectrum, making the vote choice decisions more accessible and, in turn, leading to increased turnout. Importantly, the authors find these effects in the context of partisan congressional elections, in which candidate partisanship presumably already gives voters a fair amount of information. We expect that races between male and female candidates will similarly lead to decreases in undervoting in same-party matchups. In their analysis, Ondercin and Fulton (Reference Ondercin and Fulton2020) analyze turnout in elections that were partisan contests. In our context of same-party/nonpartisan races, voters lack this critical piece of information, which should magnify the degree to which they rely on other cues to differentiate candidates. Additionally, because we are interested in undervoting rather than turnout, the costs incurred by voters for participating in any particular race are already fairly low, meaning that it should take minimal additional information to encourage them to make a candidate selection. Based on this, we formulate our first hypothesis:
H1: In same-party matchups, undervoting will occur less frequently in races in which gender differentiates the candidates (mixed-gender races).
While being able to differentiate candidates based on their gender should result in lower levels of undervoting, it is also important to consider whether there is a unique relationship between the presence of women candidates on the ballot and the behavior of women voters in these same-party/nonpartisan matchups. Theoretical work contends that women's presence as political candidates and officeholders has important ramifications for women's engagement in public life. With the exception of voting, women are less likely to participate in politics, exhibit lower levels of political knowledge, and display lower levels of political efficacy than men (Burns, Schlozman, and Verba Reference Burns, Schlozman and Verba2001; Frazer and Macdonald Reference Frazer and Macdonald2003; Huckfeldt and Sprague Reference Huckfeldt and Sprague1995). Work on representation argues that when women (and members of other historically marginalized groups) see people “like them” serving in politics, it sends the signal that the system is open to them and their interests/perspectives (Dovi Reference Dovi2002; Mansbridge Reference Mansbridge1999; Phillips Reference Phillips1995; Sapiro Reference Sapiro1981). This perceived openness is thought to foster greater engagement and confidence in the political system and to encourage participation.
Indeed, some empirical evidence does suggest that women are more engaged, interested, and knowledgeable when women are present as candidates and elected officials (Atkeson Reference Atkeson2003; Hansen Reference Hansen1997; High-Pippert and Comer Reference High-Pippert and Comer1998; Reingold and Harrell Reference Reingold and Harrell2010). Fridkin and Kenney (Reference Fridkin and Kenney2014), for example, find that when women are represented by women senators, they are more likely to be knowledgeable about politics (see also Dolan Reference Dolan2006; Jones Reference Jones2014). Burns, Schlozman, and Verba (Reference Burns, Schlozman and Verba2001) suggest that if everyone lived in a state with just one woman on the ballot in Senate or gubernatorial races, the gender gap in political interest would be reduced by more than half. This heightened interest and engagement with politics could result in lower levels of undervoting among women when they are faced with same-party/nonpartisan choices at the ballot box. If women are more engaged and knowledgeable, the loss of the party cue should be less damaging. These women will have additional knowledge to draw upon, decreasing the incentive to skip over a particular race. More directly, women candidates may have an empowering effect on women voters, encouraging them to engage in the cognitively more challenging task of making a selection in same-party/nonpartisan matchups.
At the same time, some scholars have argued that the link between women candidates and women's symbolic representation in the electorate has more to do with partisanship than gender. Lawless (Reference Lawless2004), for example, finds minimal evidence that greater descriptive representation increases feelings of efficacy or participation among women after controlling for party congruence with one's representative. Dolan (Reference Dolan2006) similarly finds no relationship between women's presence as candidates and women's participation and argues that partisanship is the greatest driver of women's attitudes and voting behaviors.Footnote 3 While this research speaks to the important role that party plays in women's political attitudes and engagement in many elections, it cannot speak to contexts in which partisanship is essentially removed from (or neutralized in) the equation. In these contexts, voters should be more likely to draw upon demographic cues to aid in their decision-making (Badas and Stauffer Reference Badas and Stauffer2019b; Crowder-Meyer, Gadarian, and Trounstine Reference Crowder-Meyer, Gadarian and Trounstine2020; McDermott Reference McDermott1997). Though previous literature has examined the role of candidate gender in shaping voter turnout, the design and analysis we present here is one of the first to examine whether the intersection of candidate and voter gender is associated with the decision to vote in same-party/nonpartisan contests.
Based on these arguments, we formulate two additional hypotheses. If H1 is supported, both men and women should undervote at lower rates in mixed-gender contests compared to contests between two male candidates. However, if the presence of a woman candidate has symbolic effects for female voters, we would expect the effect of moving from a male-male matchup to a mixed-gender matchup to be stronger among women voters. We state this expectation formally as H2a. Our expectations for races with two female candidates compared to two male candidates are outlined in H2b. Here we expect to only find effects among women voters, as we do not anticipate that female-female matchups would provide information that would allow all voters to more easily differentiate the two candidates.
H2a: In same-party matchups, compared to elections with two male candidates, undervoting will occur less frequently in mixed-gender contests, and this effect will be stronger for women.
H2b: In same-party matchups, compared to elections with two male candidates, women will undervote less frequently in races with two female candidates. There will be no effect for male voters.
Candidate Gender and the Decision of Who to Vote For
While the role that candidate gender plays in shaping turnout/undervoting in elections is important, it is also important to understand how candidate demographics may be correlated with vote choice as well. On this question, we are interested in examining the relationship between candidate gender and vote choice in mixed-gender contests. As we discussed earlier, we expect that in these races, voters will feel more equipped to select a candidate because they perceive a greater contrast between the candidates, compared to same-gender matchups. In addition to allowing voters to feel that they have sufficient information to make a decision, women candidates (and the stereotypes attached to them) should similarly be linked to the choice ultimately made by voters in these contests.
Though the cue of candidate partisanship provides little guidance in same-party matchups, voters in these races still retain, and act out of, their partisan identities. Given this, we expect that Democrats will be more likely to support female candidates, as opposed to male candidates, for two reasons: (1) because women are stereotyped as liberal (Dolan and Sanbonmatsu Reference Dolan and Sanbonmatsu2009; Koch Reference Koch2002), Democrats may assume that the woman candidate is closer to their preferences (and Republicans that a presumably more conservative male candidate is closer to theirs); and (2) issues of gender equality, diversity, and inclusion are a more central feature of the Democratic Party (Crowder-Meyer and Cooperman Reference Crowder-Meyer and Cooperman2018), which may lead Democrats to being generally more supportive of women candidates. Importantly, we expect that these effects to be present whether the candidates are two Democrats or two Republicans as ideological stereotypes transcend party, such that Democratic women are viewed as more liberal than Democratic men and Republican women more liberal than Republican men (Dolan and Sanbonmatsu Reference Dolan and Sanbonmatsu2009). Thus—assuming voters have decided to make a selection in a same-party contest—we expect to see a party divide in support for the women candidates. Democrats should be more likely to support these candidates than Republicans. Indeed, experimental work consistently finds that women candidates in low-information elections are advantaged, on average, around 2 percentage points (Crowder-Meyer, Gadarian, and Trounstine Reference Crowder-Meyer, Gadarian and Trounstine2020; Kirkland and Coppock Reference Kirkland and Coppock2018; Sen Reference Sen2017). Recent evidence from Crowder-Meyer, Gadarian, and Trounstine (Reference Crowder-Meyer, Gadarian and Trounstine2020) suggests that this effect is largely driven by Democratic voters.
While this research provides incredibly valuable insights into the relationship between candidate gender and voter decision-making, by its very nature, it cannot capture the full complexities that come with actual elections. As we explain in more detail later, we view our work as an important contribution to these studies through testing with survey data from real elections how voters respond to actual women candidates in same-party congressional elections. Importantly, we emphasize that our decision to rely on observational survey data is not meant as a criticism of experimental research in this area. To the contrary, we believe that our observational findings complement this research and rely on much of this work to develop our theoretical arguments. Based on this, we formulate our third hypothesis.
H3: In same-party matchups in which gender differentiates the candidates, Democratic voters will be more likely to vote for the female candidate (as opposed to the male candidate) than Republicans.
In addition to partisanship, voter gender may also be related to how voters select candidates in mixed-gender contests. A great deal of research has examined the degree to which gender serves as a meaningful political identity that informs vote choice and support for public officials (Badas and Stauffer Reference Badas and Stauffer2018, Reference Badas and Stauffer2019a, Reference Badas and Stauffer2019b; Dolan Reference Dolan2006; Plutzer and Zipp Reference Plutzer and Zipp1996; Zipp and Plutzer Reference Zipp and Plutzer1985). Popular political narratives discuss the “women's vote,” with the implicit assumption that women candidates may have an inherent advantage among women voters. Despite the prevalence of the “gender-affinity effect” narrative in popular commentary, evidence of women's preference for women candidates is mixed at best. While some scholars have found support for the idea that women voters prefer women candidates (Cook Reference Cook, Cook, Thomas and Wilcox1994; Fox Reference Fox1997; Plutzer and Zipp Reference Plutzer and Zipp1996; Seltzer, Newman, and Leighton Reference Seltzer, Newman and Leighton1997), others have found effects in some elections but not others (Brians Reference Brians2005; Dolan Reference Dolan1998), and still others have found no effects (King and Matland Reference King and Matland2003; Thompson and Steckenrider Reference Thompson and Steckenrider1997). These mixed findings suggest that women may vote for women in some contexts, but this relationship is conditional on particular candidates and electoral contexts.
Several explanations have been posited to explain why women may prefer same-sex representation in some contexts. Some argue that women have a “baseline preference” for same-sex representation (e.g., Sanbonmatsu Reference Sanbonmatsu2002) or that women have a sense of “gender consciousness” and group loyalty that compels them to pursue group interests. This, in turn, leads them to support in-group candidates (e.g., Tolleson-Rinehart Reference Tolleson-Rinehart1992). Paolino (Reference Paolino1995) argues that elections in which “group-salient issues” are prominent, such as sexual harassment, are the contexts in which gender-affinity effects are most likely to manifest. Perhaps the simplest explanation of gender-affinity effects is that women support women candidates because a shared sex serves as a simple heuristic (Cutler Reference Cutler2002; Pomper Reference Pomper1975). Work by Dolan (Reference Dolan2006), however, suggests a more complicated picture. Dolan (Reference Dolan2014) argues that women candidates are viewed through a partisan lens and finds that women display higher affective evaluations of Democratic women candidates, but not Republican women. Indeed, Dolan argues that political factors such as partisanship and ideology are far more likely to influence support (among both men and women) for female candidates than candidate gender.
However, the assumption undergirding much of this work is that Americans have information about candidate partisanship when voting. While this assumption certainly holds for most national and many state-level elections, there are many contexts in which voters do not have information about candidates’ party identification. Situations in which voters cannot rely on partisan cues may be precisely the contexts in which gender is likely to serve as a significant determinant of vote choice (Crowder-Meyer, Gadarian, and Trounstine Reference Crowder-Meyer, Gadarian and Trounstine2020). Indeed, Badas and Stauffer (Reference Badas and Stauffer2019b) find evidence of gender-affinity effects in nonpartisan, but not partisan, judicial elections. This suggests that gender may serve as a meaningful heuristic in voter decision-making in these elections, but only in contexts in which more salient information (such as candidate partisanship) is unavailable. We extend the implications of this argument to legislative elections in which voters are confronted with two candidates from the same party.Footnote 4 Because candidates’ partisanship cannot be used to meaningfully differentiate the candidates, we expect gender to serve as a cue for women voters. This leads to our fourth hypothesis.
H4: In same-party matchups in which gender differentiates the candidates, women voters will be more likely to vote for the female candidate (as opposed to the male candidate).
THE OPPORTUNITY OF TOP-TWO PRIMARY ELECTIONS
To test our hypotheses, we leverage survey data from general elections in which candidates share a party as a result of a top-two primary race. The top-two primary is a relatively new primary system. In 2008, Washington State adopted this open primary system, under which the top two vote getters (regardless of their party affiliation) advance to the general election for most major offices. In 2012, California adopted a similar system. A consequence of this system has been the exclusion of one major party's candidates from many elections. For example, in 2018, California voters were asked to vote for Dianne Feinstein or Kevin de León—both Democrats—for U.S. Senate, providing voters with no Republican alternative on the ballot. Since 2012, nearly 20% of races in California's November elections have featured two candidates from the same party; similar instances have occurred in Washington, but to a lesser degree.
Academic research on the top-two primary has largely examined whether the new primary system has led to the election of more moderate candidates, as intended by many of its proponents. Although most studies have shown that the reform has not reduced levels of ideological extremity in legislators (see Ahler, Citrin, and Lenz Reference Ahler, Citrin and Lenz2016; McGhee and Shor Reference McGhee and Shor2017), recent work argues that the top-two primary has been more effective at reducing ideological polarization compared to closed primary systems (Grose Reference Grose2020). Other work has focused exclusively on general elections featuring two co-partisan candidates. These one-party contests generally occur in noncompetitive jurisdictions but allow co-partisan challengers to be more effective in their campaign spending (Sinclair et al. Reference Sinclair, O'Grady, McIntosh and Nordlund2018; Sparks Reference Sparks2018). While Fisk (Reference Fisk2020) finds that ideology plays a role in the decision to vote in same-party matchups, Sinclair (Reference Sinclair2020) finds that in the 2018 California Senate race, Republicans who voted were more likely to support de León, the more liberal candidate. This finding is attributed to accountability assessments of long-serving Senator Feinstein. One article particularly relevant to the scope of our work examines the effect of candidate ethnicity on obtaining support from co-ethnic voters. Sadhwani and Mendez (Reference Sadhwani and Mendez2018) find a role for differentiating candidates in terms of ethnicity in their study of co-partisan Republican general elections in California. Specifically, they find that Latino voters were more likely to support Latino Republican candidates. Their study makes similar assumptions on voters picking up on this heuristic of candidate ethnicity, as our study does with candidate gender.
These general elections provide an ideal context to test our hypotheses for several reasons. First, because these are races for prominent federal-level offices, survey data are more readily available than for other types of elections that are likely to feature co-partisans running against each other (primary elections, town council, school board, etc.). Second, while previous research has examined the effect of candidate gender as a heuristic in experimental settings (Crowder-Meyer, Gadarian, and Trounstine Reference Crowder-Meyer, Gadarian and Trounstine2020; Kirkland and Coppock Reference Kirkland and Coppock2018; Sen Reference Sen2017), the elections produced by top-two primaries allow us to test these effects with survey data from real elections. Third, nearly 50% of all same-party matchups in California have included one male candidate and one female candidate, providing us with sufficient variation to test our hypotheses. Finally, because we examine same-party matchups in just California and Washington, we are essentially able to hold constant electoral rules and state features that might otherwise influence our dependent variables.
DATA
The data we use come from the Cooperative Congressional Election Study.Footnote 5 Top-two primaries are used for all partisan legislative and executive races for state-level and congressional offices in California and Washington. In all subsequent models, we include a binary indicator capturing whether respondents lived in California to account for any baseline differences due to respondents’ state of residence. For the purposes of our analysis, we examine congressional elections because of the salience of federal elections, but also because of data availability. Because the CCES is such a large survey, we can leverage the data from congressional races in California and Washington, specifically looking at same-party matchups. Between 2012 and 2018, there were 32 congressional races in which the primary election resulted in two candidates from the same party. Most of these races (25) featured two Democrats. Out of all same-party matchups, 15 races were what we call mixed-gender, featuring one male and one female candidate. The remaining matchups were between two male candidates (13) and two female candidates (4).Footnote 6 (For more information on these matchups, including candidate names and election outcomes, see Table A1 in the appendix in the supplementary material online.) We include only respondents who voted in the November election in our analysis, as we are interested in undervoting rather than turnout.Footnote 7 Overall, our sample includes more than 7,500 respondents in congressional races with same-party matchups, with more than 3,000 respondents in races that include one male and one female candidate.
Importantly, we note that because our analysis uses survey data from congressional races, the results we present here are likely conservative. Voters are far more likely to hold information about candidates in these races as opposed to lower-information races for state and local office. Because voters are more likely to hold information about candidates in these races, we expect gender cues to have less of an effect than in lower-level races. To the degree that we do observe a relationship between candidate gender and undervoting/vote choice, this should be even more pronounced in contests in which voters have even less information.
ANALYSIS AND RESULTS
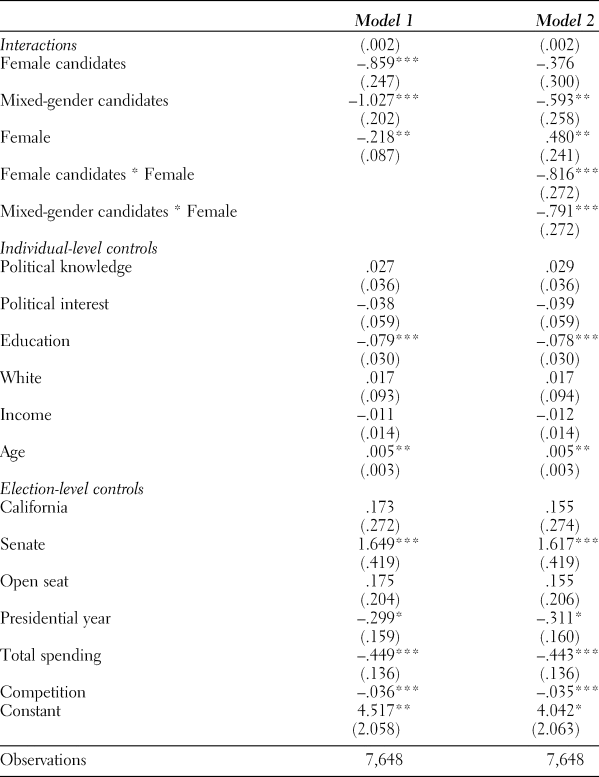
Our first set of analyses are aimed at testing our hypotheses related to undervoting. Models 1 and 2 in Table 1 present the results from two logistic regressions in which the dependent variable is a binary indicator capturing whether respondents undervoted (i.e., skipped the race) or selected either of the two candidates. Undervoting is coded as 1, while selecting one of the candidates is coded as 0. Our primary independent variables of interest in these models are two binary indicators capturing whether respondents were in a mixed-gender or female-female race (male-male races being the omitted category). If mixed-gender races allow voters to more easily differentiate the candidates, the likelihood of undervoting should be smaller in these contests compared to contests in which candidates are of the same gender. Model 1 in Table 1 presents the results of a base model, while Model 2 includes an interaction between respondent gender and race type to test for possible differences between men and women.
Predicting undervoting in same-party matchups

Notes: Standard errors in parentheses. Analysis includes survey weights.
* p < .1; ** p < .05; *** p < .01.
Also included in our models are individual-level controls that are likely to be associated with respondents’ awareness and knowledge of the candidates, including income, level of education, age, race, political interest, and political knowledge. We also include a number of controls aimed at capturing the information environment of each campaign, which should also be associated with respondents’ ability to differentiate the candidates. These variables include whether the race was for a Senate seat, whether the election was for an open seat, logged total campaign spending, the competitiveness of the district/state, and whether the election occurred in a presidential election year. These variables are common in studies of undervoting and turnout (Fisk Reference Fisk2020; Nagler Reference Nagler2015; Ondercin and Fulton Reference Ondercin and Fulton2020). Moreover, these variables should influence the intensity of the information environment for any given election, with individuals being able to better differentiate the candidates in information-rich environments.Footnote 8
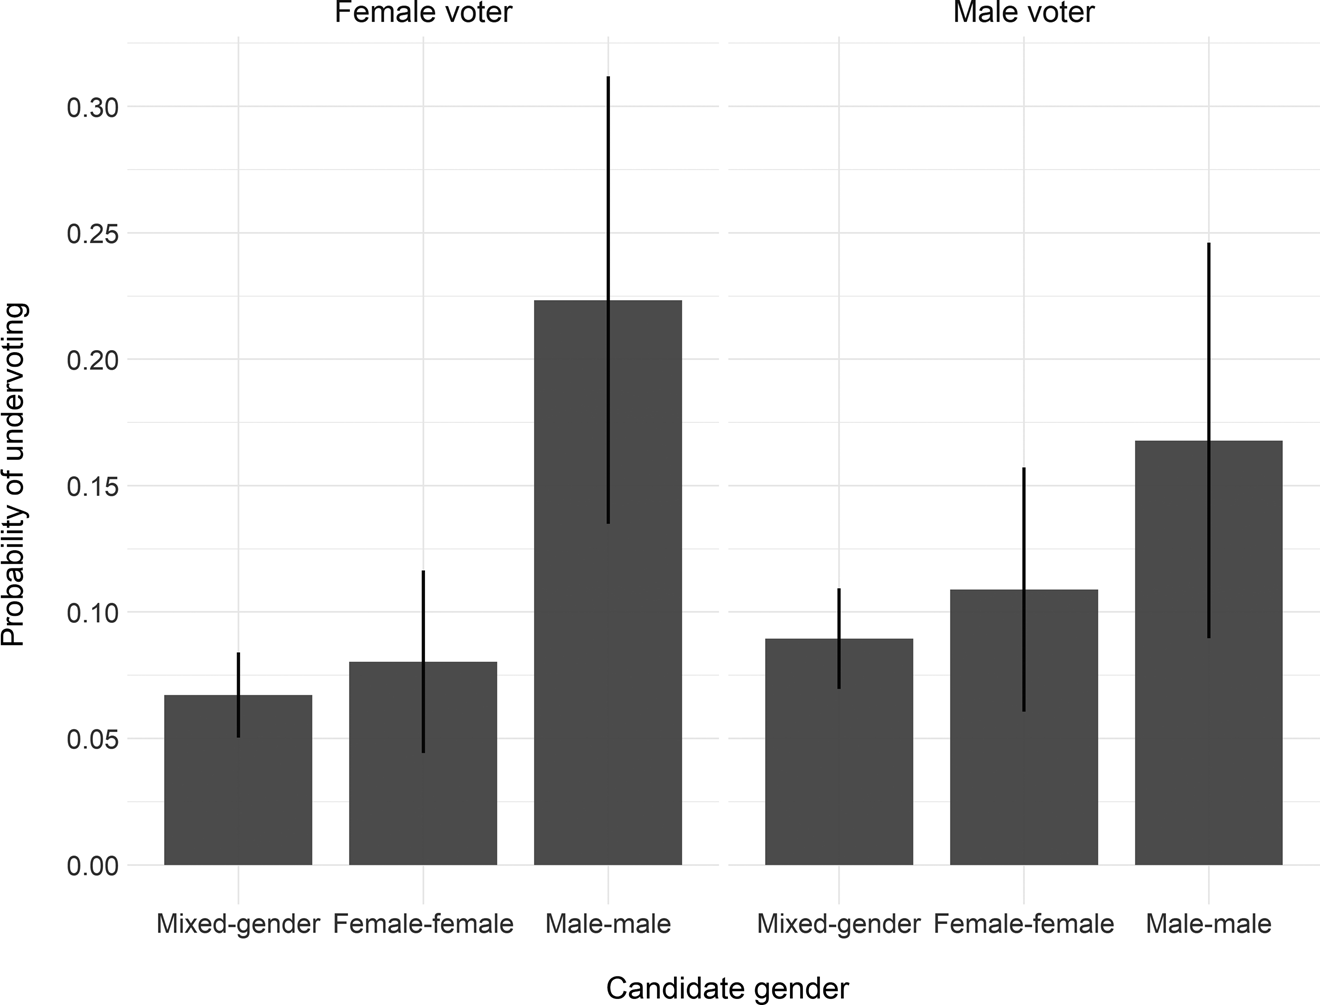
The results of Models 1 and 2 indicate that the gender composition of candidates on the ballot is associated with individual decisions of whether to select a candidate and that the nature of this relationship differs by respondent gender. To draw more substantive conclusions from these models, we generate the predicted probability of undervoting for male and female voters in each of our three race types. These probabilities are presented in Figure 1. If H1 is supported, we would expect to see both men and women undervoting at lower levels in mixed-gender contests compared to both female-female and male-male contests. While we do find that both male and female voters are less likely to undervote in a mixed-gender election compared to a male-male contest, we do not find evidence that undervoting occurs less frequently compared to female-female contests.
Undervoting in same-party matchups. Bars represent predicted probabilities and 95% confidence intervals based on Model 2 in Table 1.

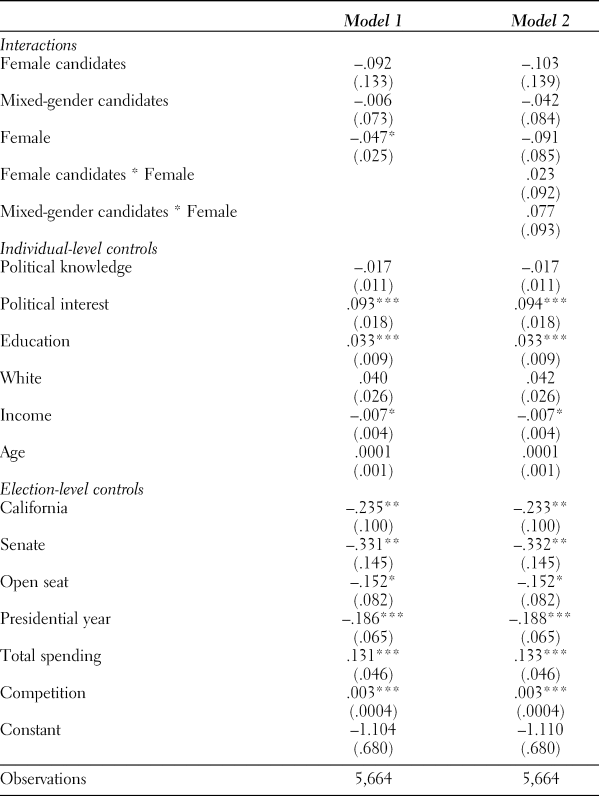
To further unpack these results, we conducted supplemental analyses examining whether—and how—race type is correlated with voters’ evaluations of candidate ideology. We argued that one reason mixed-gender races might lead to lower levels of undervoting is that candidate gender provides ideological cues to voters, making it easier to differentiate the candidates and for voters to make inferences about which candidate is closer them ideologically. Thus, we would expect respondents in mixed-gender races to perceive a greater distance between the candidates if H1 is supported.
This analysis, available in Table 2, regresses perceived distance between the candidates on the same set of covariates included in Table 1. For each of the years included in our data, respondents were asked to place each candidate for House and/or Senate on a 7-point ideological scale (1 indicates very liberal, 7 indicates very conservative). Our measure of perceived distance is created by taking the absolute value of the difference between respondents’ placements of Candidate 1 subtracted from their placement of Candidate 2. Based on this analysis, we do not find evidence that race type is associated with perceptions of ideological distance between the candidates for either male or female voters. These findings, coupled with those in Table 1, run counter to H1, indicating that the relationship between candidate gender composition and undervoting is not due to ideological or informational cues.
Predicting perceptions of ideological differences in same-party matchups

Notes: Standard errors in parentheses. Analysis includes survey weights.
* p < .1; ** p < .05; *** p < .01.
While we fail to find strong support for H1, our analysis does offer support for our expectations regarding symbolic representation (H2a and H2b). Though we do find evidence that male voters were slightly less likely to vote in mixed-gender contests compared to male-male matchups by about .08, this effect is far more pronounced among women. For women, moving from a male-male contest to a mixed-gender contest results in a nearly .15 reduction in the predicted probability of undervoting. This provides strong support for H2a. Moreover, we see similar effects for female voters when moving from male-male to female-female contests, again with women voters being more likely to undervote in these contests. While men appear to be slightly less likely to undervote in female-female contests compared to male-male contests, this difference is relatively small and is not statistically significant. Taken together, this provides strong support for H2b. This in conjunction with our conclusions related to H2a indicate that to the extent that a relationship exists between candidate gender and undervoting, it is more in line with a symbolic explanation.
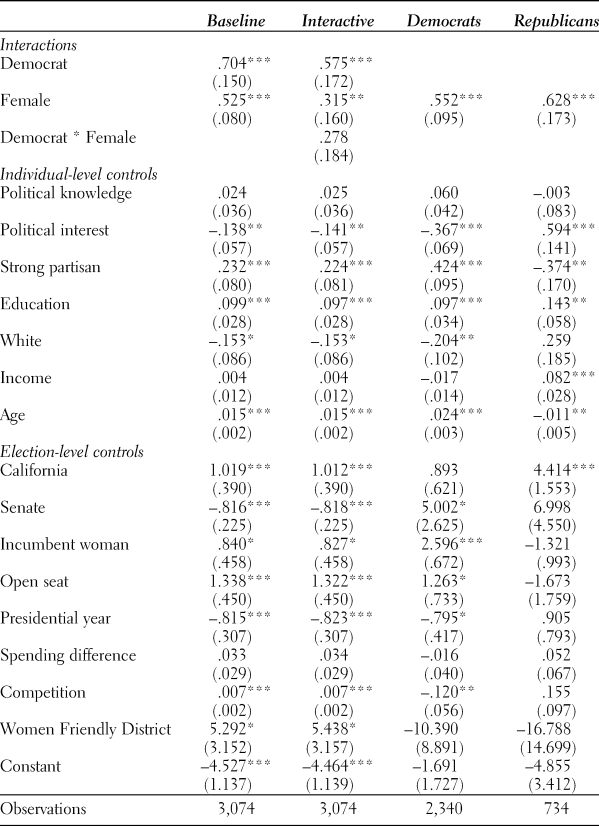
We now turn our attention to the relationship between candidate gender and the decision of who to vote for in mixed-gender contests, assuming that voters have opted to select a candidate. To test H3, which states that in mixed-gender contests Democrats will be more likely than Republicans to vote for the female candidate, and H4, which states that women will be more likely than men to vote for the female candidate, we restrict our next set of analyses to the subset of races in our data that included a male and female candidate (as opposed to a female-female or male-male matchup). This leaves us with 15 races overall, all of which were between two Democrats. We further restrict this portion of our analysis to include only those respondents who selected one of the two candidates. Thus, our results should be understood to be conditional on respondents having made the decision to vote in these races as opposed to skipping over them (i.e., undervoting). Our dependent variable for this portion of the analysis is a binary indicator that takes a value of 1 if respondents reported voting for the female candidate and a value of 0 if respondents reported voting for the male candidate.
Table 3 presents a series of logistic regression models predicting vote choice. Our first model presents a base, additive model, which allows us to evaluate whether there is an overall preference for the female candidate among women voters and Democratic voters. Our second model includes an interaction between voter gender and partisanship to examine potential partisan differences among women, and our third and fourth models provide split-sample results for Democratic and Republican voters, respectively.Footnote 9 We include the same individual-level controls as in our previous analysis as well as a binary variable for strength of partisanship (1 = strong partisan, 0 = not strong partisan) and controls that account for the relative strength of the female candidate, including whether the female candidate was an incumbent, logged amount of money spent by the female candidate minus spending by the male candidate, and district/state competitiveness.Footnote 10 As in our previous analysis, these factors should influence the information environment that respondents navigate in a given election. Specifically, these variables should help account for the amount of information respondents held about women candidates, which should have downstream effects on willingness to support them. Finally, to account for the possibility that female candidates strategically emerge in contests in which they perceive a higher likelihood of winning, we include a control for the degree to which the race was “women friendly,” using the measure designed by Palmer and Simon (Reference Palmer and Simon2010).Footnote 11 Our two main explanatory variables are binary measures capturing respondent gender (0 = male, 1 = female) and whether respondents identified as Democrats (Republicans being the omitted category).Footnote 12
Predicting vote choice for female candidates in mixed-gender matchups

Notes: Standard errors in parentheses. Analysis includes survey weights.
* p < .1; ** p < .05; *** p < .01.
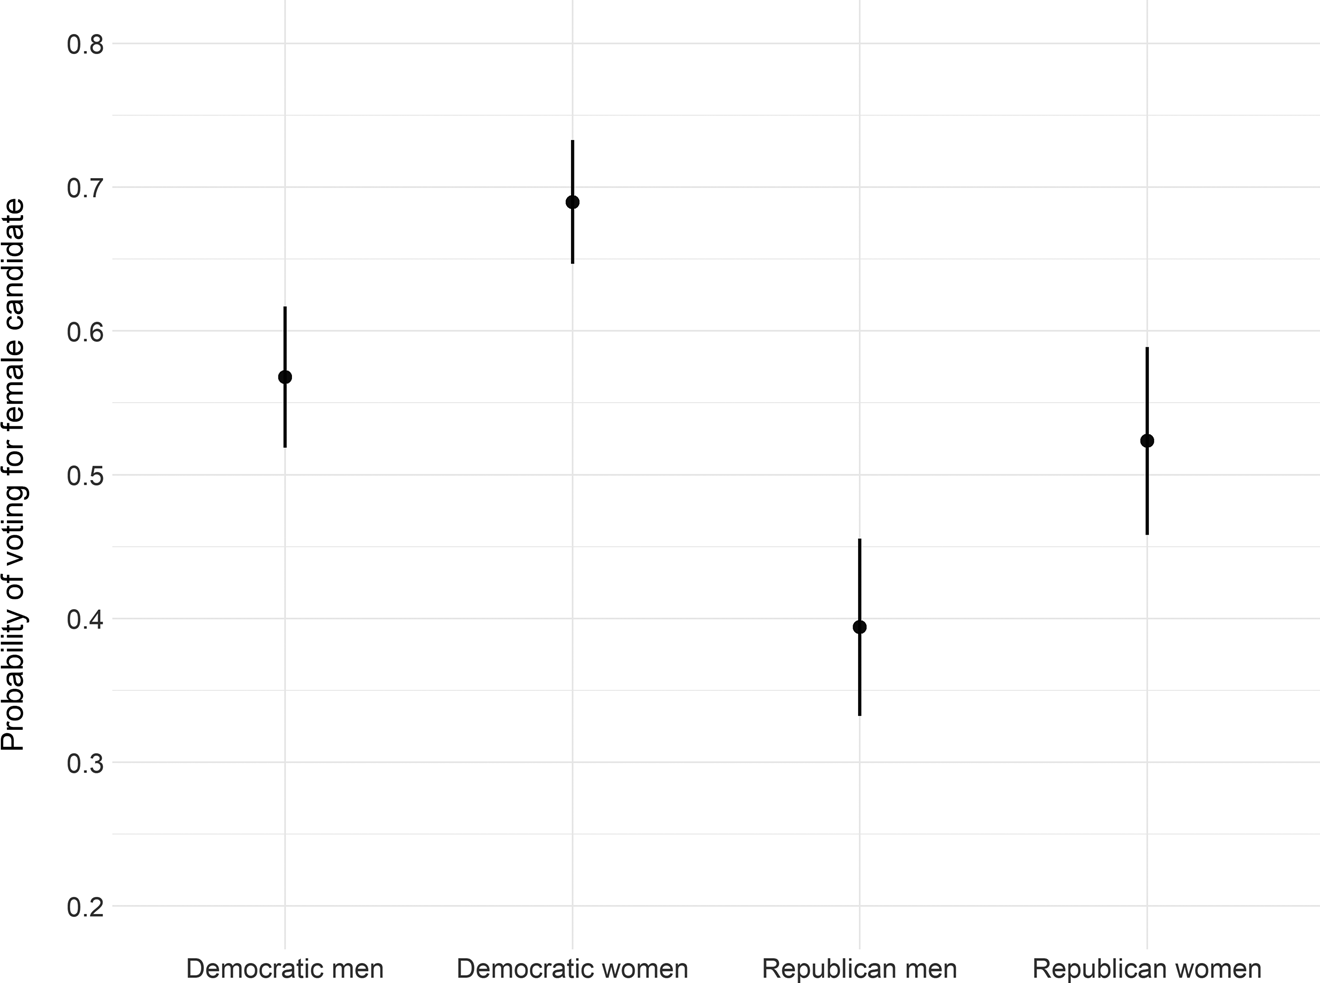
We begin by focusing our attention on our first model. Consistent with our expectations in H3, we find evidence that Democratic voters overall are more likely to vote for the woman candidate in same-party, mixed-gender matchups. The predicted probability of voting for the female candidates is .64 for all Democrats compared to .46 for all Republicans. We also find evidence that, on average, women voters are more likely to vote for the female candidate than men in the electorate, which supports H4. The predicted probability of voting for the female candidate is .64 for all women and .51 for all men. To examine whether this average effect is being driven primarily by Democratic women, we turn to our interactive model. The interaction between respondent gender and partisanship does not reach statistical significance, indicating that differences between men and women are not contingent on party identification. Our conclusion is further corroborated by the split-sample models in which we see the effect of being a female increases the likelihood of selecting the woman candidate (as opposed to the male candidate) among both Democrats and Republicans.
To provide more substantive meaning to our findings, Figure 2 plots the predicted probabilities (based on the baseline model) of vote choice by respondent gender and party, with all other variables held at their mean or modal values. On the far-left side, we present the results for male Democratic voters. These voters have a predicted probability of .56 of voting for the female candidate; Republican men, in contrast, have just a .39 probability. Within both parties women are more likely to support the female candidate than their male co-partisans. Democratic women have a .69 predicted probability of voting for the woman candidate, while Republican women have a probability of .52. Together, these findings provide strong support for H3 and H4. Both Democratic men and women are more likely to vote for female candidates compared to their Republican counterparts. At the same time, we see gender exerting an effect within each party, with women voters being more likely to support women candidates compared to their male co-partisans. While past research in partisan contexts has found minimal evidence of an association between candidate gender and vote choice (Badas and Stauffer Reference Badas and Stauffer2019b; Dolan Reference Dolan2008; King and Matland Reference King and Matland2003), our results indicate that in races in which information about partisanship does not serve as a useful heuristic, there is a meaningful relationship between candidate gender and voter decision-making.
Predicted probabilities of voting for female candidate in mixed-gender matchups Bars represent predicted probabilities and 95% confidence intervals based on baseline model in Table 3.

DISCUSSION
The vast majority of the literature on American elections focuses on partisan elections, highlighting the important role that party plays as both an informational cue and a political identity. While this emphasis is justified, in reality, Americans face many elections in which information about candidate partisanship either is unavailable or does not meaningfully differentiate the candidates. Though some research has examined voter decision-making in these contexts (Badas and Stauffer Reference Badas and Stauffer2019b; Crowder-Meyer, Gadarian, and Trounstine Reference Crowder-Meyer, Gadarian and Trounstine2020; Kirkland and Coppock Reference Kirkland and Coppock2018; Schaffner, Streb, and Wright Reference Schaffner, Streb and Wright2001; Sen Reference Sen2017), our understanding of these types of elections remains relatively limited compared to partisan elections. In this study, we contribute to the literature on nonpartisan and low-information elections by examining the relationship between candidate gender and voter decision-making in same-party general election contests. We leverage same-party matchups resulting from top-two primaries in California and Washington between 2012 and 2018. In doing so, we contribute to recent scholarship on candidate demographics and low-information elections (Badas and Stauffer Reference Badas and Stauffer2019b; Crowder-Meyer, Gadarian, and Trounstine Reference Crowder-Meyer, Gadarian and Trounstine2020; Kirkland and Coppock Reference Kirkland and Coppock2018; McDermott Reference McDermott1997; Sen Reference Sen2017).
We began our analysis by examining candidate gender and voters’ decisions to skip over races on the ballot (undervoting). For men, we found minimal evidence that the gender composition of candidates played a role in this decision. While men were slightly less likely to undervote in mixed-gender matchups compared to male-male matchups, this effect was relatively small. Moreover, there were no significant differences in men's propensity to undervote in mixed-gender matchups compared to female-female races. For women, in contrast, we found evidence suggesting that the presence of at least one female candidate significantly reduced the probability of undervoting and offered evidence in support of a symbolic relationship. While past research has found minimal evidence that women candidates mobilize women voters to turn out (Broockman Reference Broockman2014; Dolan Reference Dolan2006; Wolak Reference Wolak2015), our findings suggest that symbolic effects may manifest in the context of undervoting, offering important insights into when and where women candidates elicit these effects from women in the electorate.
Our results also provide important insights into the role that candidate gender plays in vote choice. Previous research on the relationship between candidate gender and vote choice has provided mixed results, with many scholars arguing that factors such as partisanship play a more central role in the decision-making process (Dolan Reference Dolan2008). Yet many of the elections in which Americans select candidates are contexts in which partisanship does not meaningfully differentiate the candidates. Using same-party matchups resulting from top-two primaries, we are able to address the interplay between candidate and voter gender in vote choice. Despite all of the races in our mixed-gender sample including races with two Democrats, our analysis still allows us to compare voters who share party affiliation with both candidates, compared to voters who have no co-partisans on the ballot. While we find evidence that Democratic voters were more likely to select the female candidate compared to Republicans, we also find evidence that women—of both parties—were more likely to cast their ballot for the female candidate compared to their male co-partisans. This finding has important implications for the literatures on women as candidates and candidate emergence.
A common finding in the women and politics literature is that “when women run, women win” (Burrell Reference Burrell1994; Fox and Lawless Reference Fox and Lawless2004; Lawless and Fox Reference Lawless and Fox2010; Seltzer, Newman, and Leighton Reference Seltzer, Newman and Leighton1997). Our findings are in line with this trend and, indeed, suggest that in same-party matchups, women candidates may actually hold an advantage over their male competitors. While popular commentary often evokes stereotypical concerns about the “electability” of women candidates, our study indicates that in same-party matchups, women candidates enjoy an advantage among many voters. Indeed, in our analysis, only Republican men were more likely to select the male candidate. Republican women, Democratic men and Democratic women were all more likely to vote for the female candidate over her opponent. These findings indicate that same-party matchups may help lower the barriers for women's descriptive representation, suggesting that systems such as the top-two primary, which lead to these types of matchups, may help enhance women's numeric presence in political office. Further, the findings presented here may have important implications for women's emergence as candidates. Like all candidates, women consider the likelihood of success when weighting a potential candidacy (Fox and Lawless Reference Fox and Lawless2011; Fulton et al. Reference Fulton, Maestas, Sandy Maisel and Stone2006; Williams Reference Williams2008). Given our findings regarding vote choice, women candidates may perceive a higher likelihood of success in same-party matchups (or electoral systems that could result in these matchups) and thus more frequently emerge in these contexts, which would have broad implications for the candidate pool as well as women's representation in office.
While we view our research as an important contribution to the study of low-information and nonpartisan elections, we note a few limitations in the present study. First, the top-two primary is still a relatively recent development. As a result, we are necessarily limited to a few election cycles by our research design. We are further limited because even with the top-two primary, same-party matchups do not represent the majority of outcomes. Furthermore, we are constrained geographically—only two states so far have a top-two primary system. Fourth, every mixed-gender contest included in our analysis was between two Democratic candidates. Thus, we are unable to discern whether the results presented here are dependent on candidate partisanship. It could be the case, for example, that while Republican women are willing to support a female Democratic candidate, Democratic women may not be as willing to support a Republican woman on the ballot (see Brians Reference Brians2005). Future research is needed to fully evaluate this possibility.
Finally, we note the trade-offs associated with our use of observational data. Although our data are voter validated for turnout, we rely on respondent reporting for vote choice. While our analysis has the advantage of using survey data from real elections, our ability to isolate causal effects is necessarily limited. At the same time, however, the present analysis accounts for a number of individual- and context-level characteristics that should help allay readers’ concerns about potential confounding. Moreover, we note that our study provides results that are consistent with many experimental analyses related to the role of candidate gender in voter decision-making (Badas and Stauffer Reference Badas and Stauffer2019b; Crowder-Meyer, Gadarian, and Trounstine Reference Crowder-Meyer, Gadarian and Trounstine2020; Kirkland and Coppock Reference Kirkland and Coppock2018; Sen Reference Sen2017). Putting our results in dialogue with this recent research helps us be more confident in our conclusions. We encourage readers to consider our results in conjunction with these experimental results.
These limitations notwithstanding, the races included in our sample also come with a few advantages. Most notably, we rely on congressional races in our analysis. Though for many voters these races are low-information affairs, these races are more salient and highly visible than many lower-level state or local races. Thus, we expect that the effects we find in our study would be even stronger in lower-level, same-party, or nonpartisan matchups in which voters have even less information about the candidates.
The findings presented in this research have important implications for the understanding of electoral politics, partisanship, and gender and politics. While partisanship is the predominant driver of American political behavior, our findings show that in the absence of this information, candidate demographics (specifically gender) are meaningfully associated with both voter turnout and candidate selection. This highlights the critical need to understand the dynamics of gender not only in partisan contests, but also in nonpartisan or same-party matchups. Though we focus on the case of same-party matchups in the wake of top-two primaries, our results have important implications for the study of primaries, nonpartisan elections, and state and local elections. Indeed, because Americans are unable to rely on party as a cue in so many elections, understanding the role of institutional structures and ballot features represents an important advance in our understanding of whether and how gender structures elections. Though top-two primaries are a relatively recent development in American elections, the number of states using this type of system is likely to increase in the future. A total of 12 states since 2017 have introduced bills in their legislatures that would implement a top-two primary. Our findings thus offer critical and timely insights into the consequences that these systems may have for women candidates (and voters) and offer insights into the ongoing debate related to the design of primary elections.
SUPPLEMENTARY MATERIAL
To view supplementary material for this article, please visit https://doi.org/10.1017/S1743923X20000677