I. INTRODUCTION
It has been widely accepted that the consolidation of nanostructured powders is an effective way of synthesizing bulk nanostructured and ultrafine structured metallic materials and near-net shaped components.Reference Han, Ye, Newbery, Zhu, Schoenung, Lavernia, Zehetbauer and Zhu1 For this approach to be used effectively, either or both of two conditions should be satisfied: (1) the time for keeping the nanostructured powder at relatively high temperature (above 0.6 T m, where T m is the melting temperature of the metal in Kelvin scale) during consolidation should be sufficiently short, being in the order of minutes rather than hours and (2) the thermal stability of the nanostructure of the powder particles is sufficiently high to allow the nanostructure to coarsen by only a small amount at relatively high temperatures. The first condition can be possibly satisfied if the powder is consolidated using processes that involve pressure and/or a large amount of plastic flow. Such processes include in situ consolidation of powder particles by high energy mechanical milling (HEMM),Reference Zhang, Raynova, Koch, Scattergood and Youssef2,Reference Cheng, Ma, Wang, Kecskes, Youssef, Koch, Trociewitz and Han3 powder compact forging,Reference He and Ma4 powder compact extrusion,Reference Langlois, Hytch, Lartigue-Korinek, Champion and Langlois5 and spark plasma sintering.Reference Pozuelo, Melnyk, Kao and Yang6 When such processes are not able to produce well-consolidated materials or are not cost-effective, it is necessary to improve the thermal stability of the nanostructure of the powder particles.
Thermodynamic and kinetic strategies have been used to increase the thermal stability of the nanostructure of materials.Reference Koch, Scattergood, Darling and Semones7 The thermodynamic strategy which was first proposed by WeissmüllerReference Weissmüller8 uses the segregation of alloying atoms to grain boundaries to reduce the grain boundary energy and hence the driving force for grain growth. Experimental work has shown that this strategy is highly effective. For example, it has been shown that the thermal stability of the nanostructure of nanocrystalline Pd–19 at.% Zr,Reference VanLeeuwen, Darling, Koch, Scattergood and Butler9,Reference Krill, Ehrhardt and Birringer10 Fe–(1–4) at.% ZrReference Darling, VanLeeuwen, Koch and Scattergood11, and Cu–(1–5) at.% ZrReference Atwater, Scattergood and Koch12 alloys are significantly higher than that of pure Pd, Fe, and Cu, respectively, due to the strong segregation of Zr atoms to the grain boundaries of these metals. Malow and KochReference Malow and Koch13 and Liu and MücklichReference Liu and Mücklich14 showed that nanocrystalline Fe and RuAl with segregated impurity atoms at grain boundaries exhibit high thermal stability. Recently, Chookajorn et al.Reference Chookajorn, Murdoch and Schuh15 also successfully synthesized a nanocrystalline W–20 at.% Ti alloy, and proposed a new thermodynamic model to elucidate the underlying thermodynamic relationships that determine the high thermal stability of nanocrystalline alloys. The kinetic strategy which utilizes small second phase particles to retard the movement of grain boundaries has also been shown to be highly effective in stabilizing the microstructure of nanocrystalline materials at elevated temperatures up to 0.65 T m.Reference Zhang, Vo, Bellon and Averback16–Reference Botcharova, Freudenberger and Schultz22
Although many nanostructured materials stabilized by fine second phase particles have been reported, systematic investigation of the grain growth behavior and kinetics of such kind of nanostructure is still missing. The present study is to investigate the grain growth of the nanocrystalline Cu matrix and other microstructural changes of the nanostructured Cu–5 vol% Al2O3 nanocomposite powder particles during isothermal annealing at different temperatures in the range of 300–600 °C. Comparison between the grain growth kinetics of the nanocrystalline Cu matrix of the nanocomposite and those of monolithic nanocrystalline Cu is also made. It is hoped that through this study, an in-depth understanding of the changes and stability of the nanostructure of metal matrix nanocomposites during annealing would be achieved.
The motivation for selecting the ball milled nanostructured Cu–5 vol% Al2O3 nanocomposite powder in this study is based on two considerations. From practical application point of view, this powder material can be used to make bulk ultrafine structured Cu–5 vol% Al2O3 nanocomposite which has the potential of having high room temperature and elevated temperature strength, good ductility, high thermal stability, and good conductivity. These properties are very attractive to many applications including making spot welding electrodes and electrical contact materials for electrical switches and circuit breakers. From academic point of view, this material is a good model system for studying microstructure-property relationships and thermal stability of microstructures of nanostructured and ultrafine structured metal matrix nanocomposites.
II. EXPERIMENTAL PROCEDURE
A nanostructured Cu–5 vol% Al2O3 nanocomposite powder was prepared using HEMM of a mixture of elemental Cu powder (99.7% pure, particle sizes: 1–100 µm) and gamma Al2O3 nanopowder (99.9% pure, average particle size: 50 nm). For each batch of sample, 100 g (in total) of the Cu powder and Al2O3 nanopowder were mixed by ball milling for 12 h under an argon atmosphere and using a Retch PM100 planetary ball mill with a speed of 100 rpm and 61 stainless steel balls of 12.5 mm in diameter. Then HEMM of the powder mixture was done under an argon atmosphere and using the same ball mill at a speed of 400 rpm and with six stainless steel balls of 25 mm in diameter and 13 stainless steel balls of 12.5 mm in diameter. The net milling time was 48 h with a break of 30 min after every 30 min interval of milling. The ball-to-powder weight ratio was 5:1 for both mixing and milling steps. The as-milled powder particles were subsequently annealed at different temperatures in the range of 300–600 °C for a time in the range of 0.1–5 h in a vacuum of 10−6 mbar. A heating rate of 10 °C/min was used to heat the samples up to the holding temperature and then furnace cooling was used to cool the samples down after holding at the annealing temperature. The microhardness of the as-milled and annealed powder particles was measured using a Vickers microindentation tester, LECO LM700 with a load of 25 gf and a dwell time of 15 s. For each sample, 10 indents were made onto the polished cross sections of powder particles to obtain one average microhardness measurement. As-milled and annealed powder particle samples were first mounted using epoxy and then ground and polished to get “mirror” cross-sectional surfaces of powder particles for microhardness measurements. The bottom surface of the mounted sample, which does not contain powder particles, was also ground carefully and made to be parallel to the top one with powder particles. To avoid influence from the epoxy substrate during microhardness measurements, all indents were produced in the cross sections of relatively large powder particles.
The composition of the as-milled Cu–5 vol% Al2O3 powder was measured to be 1.346 wt.% Al (equivalent to ∼2.542 wt.% Al2O3), 0.175 wt.% Fe, 0.002 wt.% Mn and the balance Cu, using a Spectro XLab2000 x-ray fluorescence system. The as-milled and annealed powder samples were examined using x-ray diffractometry (XRD) (Philips X-pert XRD system, Cu Kα radiation, and a graphite monochromator), scanning electron microscopy (SEM; Hitachi S4000 SEM, Hitachi High-Technologies Corporation, Tokyo, Japan), transmission electron microscopy (TEM; Philips/FEI CM200 TEM, FEI Corporation, Hillsboro, OR) in conjunction with scanning transmission electron microscopy (STEM), and energy dispersive x-ray (EDX) spectrometry. TEM specimens were prepared by cutting thin sections from powder particles using a dual beam focused ion beam (FIB)/SEM microscope.
III. RESULTS
As shown in Fig. 1, the Cu peaks of the XRD patterns of the as-milled and annealed Cu–5 vol% Al2O3 nanocomposite powders became narrower with increasing annealing temperature, suggesting that the Cu grains grew during annealing. The Cu peaks of the XRD patterns were analyzed to determine the average Cu grain sizes and dislocation densities of the samples. Prior to doing this, background and Kα2 signals were removed from the XRD diffraction peaks, and instrumental broadening was corrected by producing an XRD pattern of the same Cu powder annealed at 900 °C for 1 h. The Scherrer equation, as given below,Reference Langford and Wilson23,Reference Holzwarth and Gibson24 was applied to the first peak of the XRD patterns to evaluate the average grain size of the powder particles:
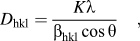 $${D_{{\rm{hkl}}}} = {{K{\rm{\lambda }}} \over {\left{{{\rm{ \beta }}_{{\rm{hkl}}}}\cos {\rm{\theta }}} \right}}\quad ,$$
where D hkl is the mean grain size, K is a constant and normally taken to be 1, λ is the wave length of the x-rays used to generate the XRD patterns, βhkl is the integral breadth of the x-ray diffraction peak (in radians) of the planes with Miller indices of {hkl}, and θ is the Bragg angle of the peak used. The internal strain, εhkl, of the samples was derived from the following equationReference Stokes and Wilson25:
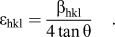 $${{\rm{\varepsilon }}_{{\rm{hkl}}}} = {{{\beta _{{\rm{hkl}}}}} \over {4\tan {\rm{\theta }}}}}\quad .$$
XRD patterns of as-milled and annealed nanostructured Cu–5 vol% Al2O3 nanocomposite powders.

The dislocation density of samples, ρ, was evaluated by the formula given belowReference Williamson and Smallman26−Reference Ni, Wang, Liao, Alhajeri, Li, Zhao, Lavernia, Ringer, Langdon and Zhu28:
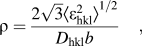 $${\rm{\rho }} = {{2\sqrt 3 {{\left\langle {\varepsilon _{{\rm{hkl}}}^2} \right\rangle }^{1/2}}} \over {{D_{{\rm{hkl}}}}b}}\quad ,$$
where b is the Burger's vector of pure Cu. In the dislocation density calculation, the first three peaks of XRD patterns were used to obtain the average dislocation densities of the samples.
Figures 2(a) and 2(b) show the average grain sizes as a function of annealing time at different annealing temperatures and a function of annealing temperature with different annealing times, respectively. Figures 2(a) and 2(b) demonstrate that the grain sizes almost remained unchanged with increasing annealing time for an annealing temperature of 400 °C, or lower, whereas when the annealing temperature was 500 °C or higher, the grain sizes first increased at a rate which became higher with increasing annealing temperature, and then reached stagnation with prolonged annealing time. The dislocation densities as a function of annealing time at different annealing temperatures and a function of annealing temperature with different annealing times are presented in Figs. 3(a) and 3(b), respectively. As shown in Fig. 3(a), at a given annealing temperature, the dislocation density dropped significantly within the first 0.1 h of annealing, then underwent fluctuation with increasing annealing time, and subsequently changed little with further increasing annealing time. As shown in Fig. 3(b), the dislocation density of the annealed powder particles did not change significantly with increasing annealing temperature from room temperature to 300 °C, and then decreased significantly and linearly with increasing annealing temperature from 300 to 600 °C.
Changes of grain sizes of the nanocrystalline Cu matrix of the Cu–5 vol% Al2O3 nanocomposite powder particles with annealing time at different annealing temperatures (a) and with annealing temperature for different annealing times (b).
Variation of dislocation density of nanostructured Cu–5 vol% Al2O3 nanocomposite powder particles with annealing time at different annealing temperatures (a) and with annealing temperature for different annealing times (b).
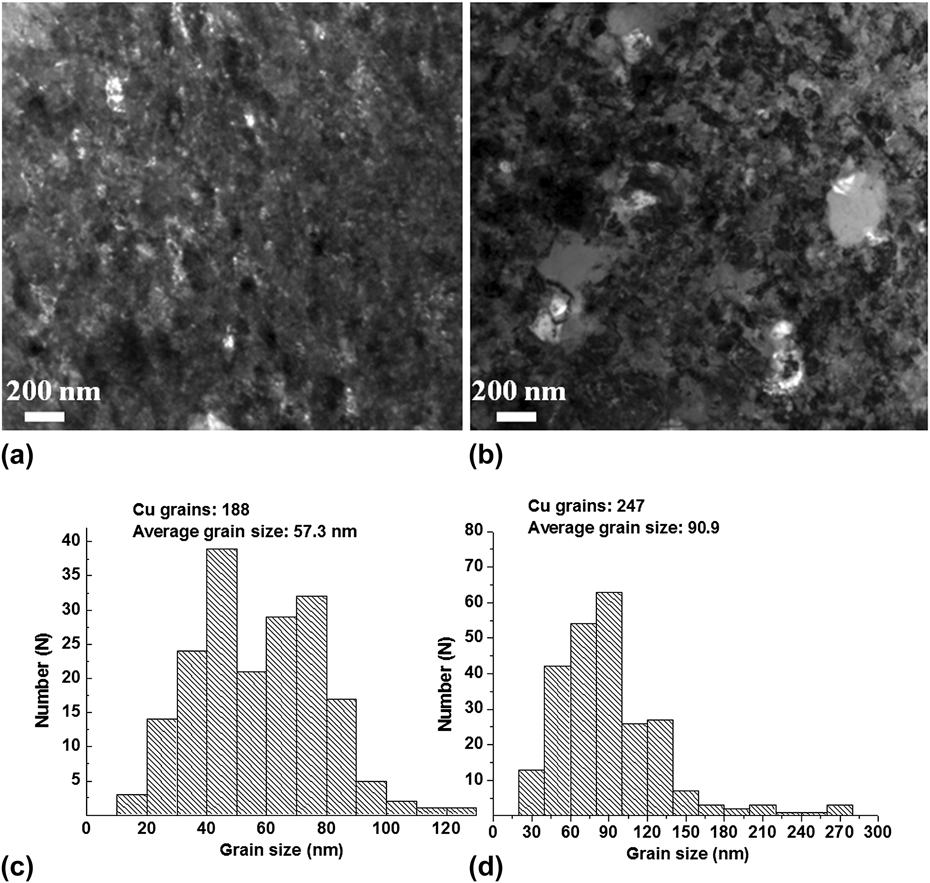
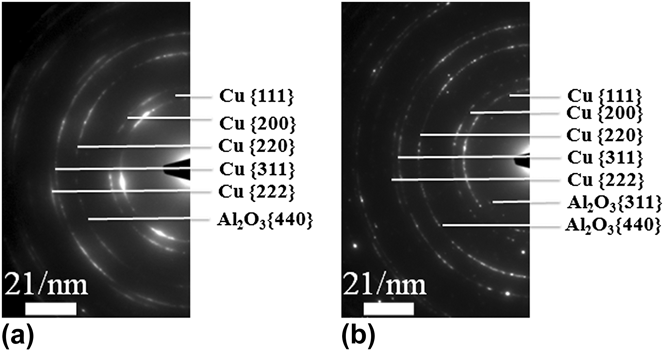
Figure 4 shows the TEM bright field micrographs of the microstructure of the nanostructured Cu–5 vol% Al2O3 nanocomposite powder particles under as-milled condition and after annealing at 600 °C for 5 h, and the grain size distributions of the nanocrystalline Cu matrix of the samples under these two heat treatment conditions, respectively. The grain size distributions of the nanocrystalline Cu matrix of the nanocomposite samples were determined by measuring the sizes of 188 and 247 Cu grains in the microstructures. As shown by the results of the TEM examination of the as-milled and annealed powder particles, the grain sizes of the nanocrystalline Cu matrix of the nanocomposite under as-milled condition were in the range of 17–120 nm, with the average value being 50 ± 20 nm, whereas after annealing for 5 h at 600 °C, the majority of Cu grains grew slightly larger, with the sizes being in the range of 20–200 nm. Some large Cu grains with sizes in the range of 200–300 nm and surrounded by nanometer-sized Cu grains were also found in the microstructure of the powder particles annealed for 5 h at 600 °C, as shown in Fig. 4(b), indicating that abnormal grain growth occurred during annealing at 600 °C. The average grain size of the Cu matrix of the nanocomposite particles after annealing for 5 h at 600 °C was 91 ± 47 nm. As shown by the selected area electron diffraction patterns shown in Figs. 5(a) and 5(b), annealing as-milled powder particles at 600 °C for 5 h generated a group of weak diffraction spots corresponding to Al2O3 {311} [Fig. 5(b)], which were absent from the SADP of the as-milled powder particle [Fig. 5(a)]. This implies that the growth of Al2O3 nanoparticles occurred during annealing at 600 °C.
(a) and (b) TEM bright field micrographs of the microstructure of the nanostructured Cu–5 vol% Al2O3 nanocomposite powder particles under as-milled condition and after annealing at 600 °C for 5 h, respectively; and (c) and (d) their corresponding grain size distributions, respectively.
Selected area electron diffraction patterns corresponding to the TEM micrographs shown in Figs. 4(a) and 4(b), respectively.
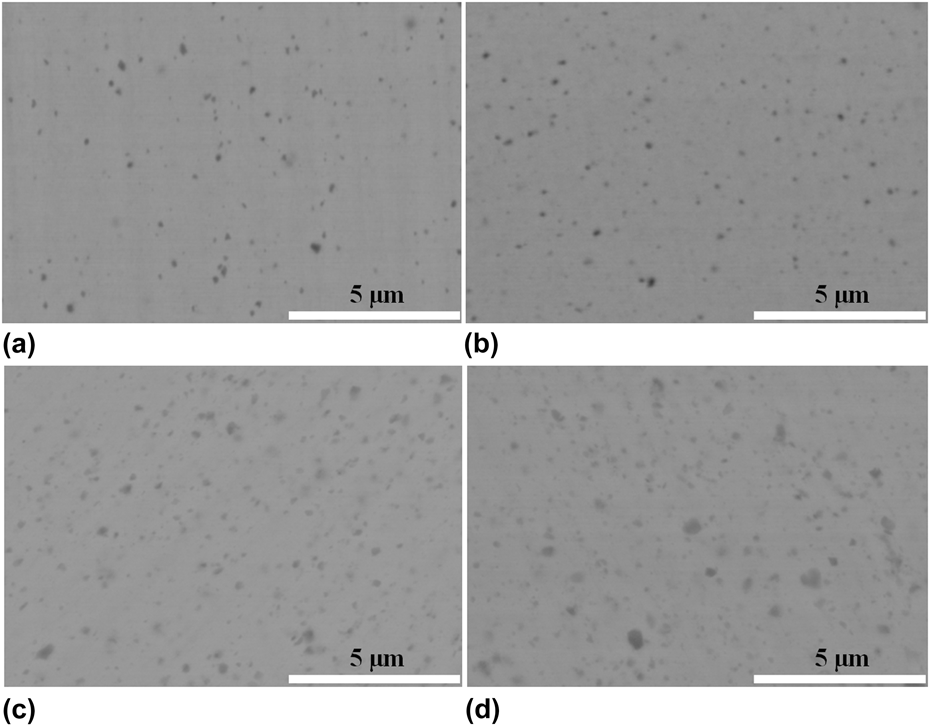
As shown by the SEM backscattered electron images, STEM images and EDX Al elemental maps shown in Figs. 6 and 7, a fraction of Al2O3 nanoparticles were dissolved during milling, and relatively large Al2O3 nanoparticles survived in the microstructure of the as-milled powder. With the subsequent annealing, the Al3+ and O2− ions re-precipitated out to either form new Al2O3 nanoparticles or to cause the growth of pre-existing Al2O3 nanoparticles, as shown in Figs. 6(b)–6(d) and 7(c) and 7(d). This is in agreement with the appearance of the Al2O3 {311} diffraction spots in the SADP of the powder particle annealed at 600 °C and for 5 h shown in Fig. 5.
SEM backscattered electron images showing coarsening of Al2O3 nanoparticles in the nanostructured Cu–5 vol% Al2O3 nanocomposite powder particles under different annealing conditions: (a) as-milled; (b) 400 °C for 5 h; (c) 500 °C for 5 h; and (d) 600 °C for 5 h.
STEM images of the microstructure of (a) as-milled nanostructured Cu–5 vol% Al2O3 nanocomposite powder particles and (c) powder particles annealed at 600 °C for 5 h, respectively, and (b) and (d) their corresponding EDX Al elemental maps, respectively.
Figure 8 displays the change of the microhardness of the Cu–5 vol% Al2O3 nanocomposite powder particles with increasing annealing time at different annealing temperatures. It shows that the value of the microhardness of the Cu–5 vol% Al2O3 nanocomposite powder particles annealed at a given annealing temperature decreased with increasing annealing time within the first 2 h annealing and then reached a plateau with further increase in annealing time. Moreover, the microhardness of the annealed Cu–5 vol% Al2O3 nanocomposite powder particles decreased from 259 to 168 Hv with increasing annealing temperature from room temperature to 600 °C. Such changes in the microhardness of the powder particles with the annealing condition clearly reflects the Cu grain growth behavior shown in Fig. 2 and the decrease of the dislocation density of the powder particles with increasing annealing time and annealing temperature shown in Fig. 3.
Microhardness of the nanostructured Cu–5 vol% Al2O3 nanocomposite powder particles as a function of annealing time at different annealing temperatures.
IV. DISCUSSION
A. Microstructural evolution during annealing
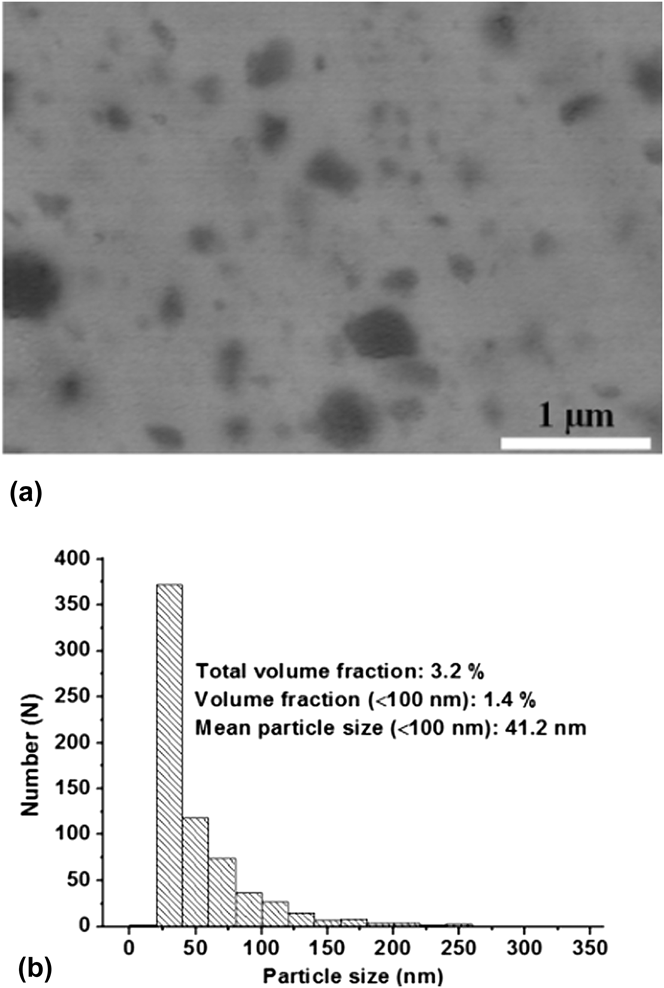
As shown in Figs. 2 and 3, when the as-milled powder particles are annealed at temperatures ≤400 °C, the average Cu grain size remains nearly unchanged, whereas those powder particles annealed at temperatures ≥500 °C exhibit clear grain growth (Fig. 2). This observation is similar to the finding obtained by Čížek et al.Reference Čížek, Procházka, Cieslar, Kužel, Matěj, Cherkaska, Islamgaliev and Kulyasova29 that no visible grain growth or recrystallization of the nanocrystalline Cu matrix occurs during annealing of Cu–0.5 wt.% Al2O3 nanocomposite at temperatures below 400 °C. In contrast, the dislocation density of the as-milled powder particles decreases continuously with increasing annealing temperature from 300 to 600 °C (Fig. 3). Abnormal grain growth occurs during annealing at 600 °C, as shown in Fig. 4(b). This might be caused by the coarsening of Al2O3 nanoparticles during annealing. As shown in Figs. 6, 7, and 9, a fraction of the Al2O3 particles of the as-milled powder particles coarsen and their sizes reach a level larger than 100 nm after annealing at 600 °C for 5 h. These large Al2O3 particles are less effective in dragging the migration of grain boundaries and thus allow faster grain growth than Al2O3 nanoparticles smaller than 50 nm during annealing.Reference Ďurišin, Ďurišinová, Orolínová and Saksl30 As a result, some grains adjacent to large Al2O3 particles grew abnormally, as shown in Fig. 4(b).
(a) SEM backscattered electron image of the Cu–5 vol% Al2O3 nanocomposite powder particle annealed at 600 °C for 5 h; (b) particle size distribution of the Al2O3 nanoparticles.
As shown in Fig. 3(a), for samples annealed at 300, 500, and 600 °C, respectively, the dislocation density is found to increase with increasing annealing time from 10 min to 1 h and then decrease with further increasing annealing time. A possible reason for this behavior might be that there is residual elastic strain (and stress) at the Al2O3 nanoparticle/Cu matrix interfaces caused by incompatible plastic deformation of the two phases during milling. Within a short annealing time of 1 h, this residual strain is relaxed and turns into dislocations emitting from the interface. This may cause an increase of dislocation density in the powder particles annealed. In the meantime, the additional free energy of the dislocations would drive their annihilation by reactions among them, their movement to grain boundaries which work as sinks for dislocations and even formation and growth of new dislocation free grains through recrystallization. This will cause a decrease of dislocation density with increasing annealing time. These two opposite effects operate simultaneously during annealing. Due to very high dislocation density of the as-milled powder particles, the rate of the dislocation density decrease caused by the second effect is much higher than that of dislocation increase caused by the first effect, leading to a sharp decrease of the dislocation density in the samples annealed for a very short time of 10 min. With the level of the dislocation density being lower, the second effect becomes weaker, leading to a lower rate of dislocation density decrease, and this makes the first effect become dominant, causing increase of dislocation density. Once the residual elastic strain is relaxed, the first effect diminishes, making the second effect dominant again, leading to decrease of dislocation density with increasing annealing time. For the samples annealed at 400 °C, the dislocation density is found to increase slightly and continuously with increasing annealing time beyond 10 min up to 5 h. The inconsistent behavior of the samples annealed at 400 °C as compared with the samples annealed at 300, 500, and 600 °C, respectively, may be because of the role of temperature in determining the rate of dislocation density increase and decrease due to the two opposite effects as explained above.
B. The kinetics of grain growth of the nanocrystalline Cu matrix
Based on the consideration that the grain growth of a polycrystalline material is driven by the grain boundary curvature, the grain size, D, as a function of annealing time, t, can be described by using a power law equationReference Burke31,Reference Atkinson32 :
 $${D^n} - D_0^n = kt\quad ,$$
where n is a constant, D 0 is the initial grain size at time t = 0, and k is a temperature-dependent grain growth rate constant. If the material is a pure single phase material, n = 2. However, during grain growth, many factors such as second phase particles,Reference Zhou, Lee and Lavernia33 impurities,Reference Malow and Koch13,Reference Liu and Mücklich14 solute atoms,Reference Michels, Krill, Ehrhardt, Birringer and Wu34 strain release,Reference Lu, Tao, Wang, Ding and Lu35 pores, and grain boundary triple junctionsReference Gottstein, Shvindlerman and Zhao36,Reference Shvindlerman and Gottstein37 can affect the kinetics of grain growth and lead to n > 2.Reference Humphreys and Hatherly38 In this study, we assume that the curvature-driven grain growth mechanism is still operative and Eq. (4) can be used to quantify the grain growth. Considering the influence of Al2O3 nanoparticles on the grain growth of nanocrystalline Cu matrix, we take n = 3, and Eq. (4) is rewritten as:
 $${D^3} - D_0^3 = kt\quad .$$
The values of k at different annealing temperatures were obtained by fitting Eq. (5) with the grain size data obtained from the isothermal annealing experiments shown in Fig. 2(a). k changes with temperature according to the Arrhenius relationshipReference Burke31:
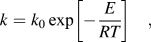 $$k = {k_0}\exp \left[ { - {E \over {RT}}} \right]\quad ,$$
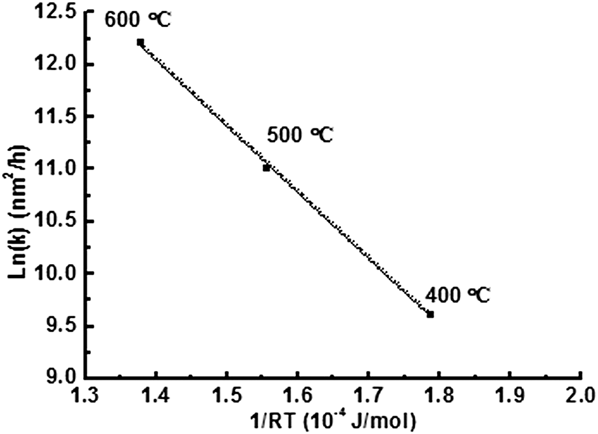
where R is the ideal gas constant, T is the absolute temperature, E is the apparent activation energy for grain growth, and k 0 is a constant. Based on Eq. (6), the value of the grain growth activation energy, E, can be obtained from the slope of the line of ln(k) versus 1/RT.
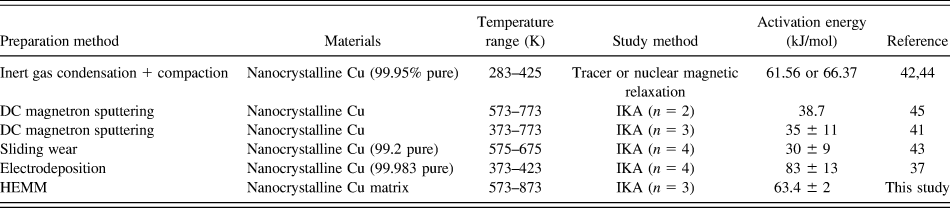
From the slope of the line which best fits the experimental data points of (1/RT, k) at three different annealing temperatures (400, 500, and 600 °C), as shown in Fig. 10, the value of the activation energy of grain growth of the nanocrystalline Cu matrix of the Cu–5 vol% Al2O3 nanocomposite powder particles has been determined to be 63.4 kJ/mol. For comparison, the values of the apparent activation energy of grain growth of monolithic nanocrystalline Cu collected from the published literatureReference Lu, Tao, Wang, Ding and Lu35,Reference Simões, Calinas, Vieira, Vieira and Ferreira39–Reference Cao, Wang, Wang and Meng43 along with the value obtained in this study are summarized in Table I. It can be seen that the reported values of the apparent activation energy of grain growth of monolithic nanocrystalline Cu are in the range of 30–83 kJ/mol, which is much smaller than that of the grain growth of microcrystalline Cu (211 kJ/mol).Reference Mehrer44 This is not surprising, since the grain growth of nanocrystalline Cu is grain boundary diffusion controlled, whereas the grain growth of microcrystalline Cu is lattice diffusion controlled. On the other hand, the value of the apparent activation energy of grain growth of the nanocrystalline Cu matrix of the Cu–5 vol% Al2O3 nanocomposite (63.4 kJ/mol) falls well into the range of the reported values of the apparent activation energy of grain growth of monolithic nanocrystalline Cu shown in Table I. This shows that the grain growth kinetics of the nanocrystalline Cu matrix of the Cu–5 vol% Al2O3 nanocomposite powder particles prepared by HEMM are also controlled by grain boundary diffusion.
Values of apparent activation energy for grain growth of monolithic nanocrystalline Cu published in the literature and that of the nanocrystalline Cu matrix of the Cu–5 vol% Al2O3 nanocomposite obtained in this study (IKA: isothermal kinetics analysis).
Arrhenius plot of the grain growth rate constant for the nanocrystalline Cu matrix of the Cu–5 vol% Al2O3 nanocomposite powder particles in the temperature range of 400–600 °C.
C. The effect of Al2O3 nanoparticles on the grain growth of nanocrystalline Cu matrix
Fine second phase particles located at grain boundaries exert a retarding force to the grain boundaries so that their migration becomes more difficult. Such an effect can result in a much lower rate of the grain growth of a nanocrystalline metal matrix dispersed with fine second phase particles compared with its monolithic nanocrystalline counterpart. Indeed, although the apparent activation energy of grain growth of the nanocrystalline Cu matrix of the Cu–5 vol% Al2O3 nanocomposite [Fig. 2(a)] is very close to that of monolithic nanocrystalline Cu, the growth rate of the former during annealing at elevated temperatures in the range of 400–600 °C is far lower than that of the latter in the same temperature range. This is reflected by the fact that after 5 h annealing at 500 °C, the average grain size of monolithic nanocrystalline Cu increases from 50 to 280 nm,Reference Simões, Calinas, Vieira, Vieira and Ferreira39 whereas the annealing at a higher temperature of 600 °C for the same time of 5 h only causes the average grain size of the nanocrystalline Cu matrix of the Cu–5 vol% Al2O3 nanocomposite only to increase from 57 to 91 nm, as shown in Fig. 4.
According to Burke,Reference Burke31 a balance between the pinning force exerted on a grain boundary by fine second phase particles and the driving force for grain growth can be established in a metal dispersed with second phase particles, and in such a metastable state the grain growth would virtually stop with further annealing at the same temperature. Based on the particle pinning theory of grain growth,Reference Smith45 the relationship between the particle parameters (i.e., volume fraction, f, and size, d) and grain size, D, can be empirically described by the following equation:
 $${D \over d} = {4 \over {3f}}\quad .$$
The powder particles annealed at 600 °C for 5 h is taken as a model to analyze the effect of Al2O3 nanoparticles on the grain growth of nanocrystalline Cu matrix of the Cu–5 vol% Al2O3 nanocomposite. In this analysis, Al2O3 particles with sizes larger than 100 nm are not taken into account because of their negligible effect on the thermal stability of the nanocrystalline Cu matrix. By substituting d = 41.19 nm and f = 1.36% presented in Fig. 9(b) into Eq. (7), we get D = 4038 nm. Apparently, this predicted value of the average grain size of the Cu matrix is by far much larger than the actual average grain size of the nanocrystalline Cu matrix of the Cu–5 vol% Al2O3 nanocomposite annealed at 600 °C for 5 h which is 91 nm. As shown by the information in Fig. 9(b), the volume fraction of Al2O3 nanoparticles accounted for in the measurement is 3.23 vol%, indicating that there is still ∼1.77 vol% Al2O3 left in the matrix and which may be in the form of Al3+/O2− clusters, being too small to be resolved clearly by SEM and TEM. We assume that the Al3+/O2− clusters have an average size of 2 nm and then do the calculation using Eq. (7) again. This calculation generates a value of D of 151 nm, which is fairly close to the actual measured average grain size of 91 nm, considering the simplicity of the model and the level of inaccuracy of the measurement of the average grain size. This means that the high thermal stability of the nanocrystalline Cu matrix of the Cu–5 vol% Al2O3 nanocomposite is mainly caused by the pinning effect of Al3+/O2− clusters. In addition, there is a small amount of Fe impurity in the as-milled powder (∼0.175 wt.%, as shown by the chemical analysis), and the iron atoms in the lattice and segregated at the grain boundaries of the Cu matrix may impose a retarding force against the motion of the grain boundary via the solute drag effect.
D. The effect of Al2O3 nanoparticles on the dislocation density in nanocrystalline Cu matrix
It is expected that the Al2O3 nanoparticles also significantly affect the dislocation density of nanostructured Cu matrix in the annealed samples. Upon annealing, Al2O3 nanoparticles at the grain boundaries and inside the grains of the nanocrystalline Cu matrix could serve as effective pinning sites for dislocation movement needed for annihilation through reactions among them and moving to grain boundaries which work as dislocation sinks. In addition, Al2O3 nanoparticles work as barriers for formation and growth of new grains during recrystallization, and this also effectively reduces the rate of dislocation density decrease with increasing annealing time. As a result of this effect, it is expected that with the same annealing temperature and time, the dislocation density of nanostructured Cu–5 vol% Al2O3 nanocomposite powder would be much higher than that of monolithic nanocrystalline pure Cu. This behavior has been reported by Čížek et al.Reference Čížek, Procházka, Kužel, Islamgaliev, Hofmann, Rahman and Schubert46
V. CONCLUSIONS
A systematic investigation of the microstructural changes that occur during isothermal annealing of a nanostructured Cu–5 vol% Al2O3 nanocomposite powder prepared by HEMM has been performed. The results show that annealing at 300 or 400 °C only causes a reduction of the dislocation density of the powder particles, whereas annealing at 500 or 600 °C causes reduction of dislocation density, abnormal grain growth of the nanocrystalline Cu matrix, and coarsening of Al2O3 nanoparticles of the nanocomposite particles.
Analysis of the grain growth kinetics of the nanocrystalline Cu matrix of the Cu–5 vol% Al2O3 nanocomposite shows that the apparent activation energy of the grain growth in the temperature range of 400–600 °C is 63.4 kJ/mol, being very similar to that of monolithic nanocrystalline Cu in the same temperature range. However, the microstructure of the nanocrystalline Cu matrix of the nanocomposite exhibits a far higher thermal stability than that of monolithic nanocrystalline Cu, with most of the Cu grains being still in the nanometer scale after annealing at 600 °C for 5 h. This high thermal stability of the nanocrystalline Cu matrix of the nanocomposite can be attributed to the drag effects of finely distributed Al2O3 nanoparticles and Al3+/O2− clusters on the grain boundary motion.
ACKNOWLEDGMENTS
The funding from the China Scholarship Council (CSC), National Natural Science Foundation of China (Project No. 51271115), Ministry of Science and Technology, China (Project No. 2012CB619600), and Ministry of Business, Innovation and Employment, New Zealand (Contract No. UOWX1001) to support this work is gratefully acknowledged.