


Introduction
Water-vapor movement in snow is regulated by temperature, the water-vapor concentration gradient (∂C/∂y) in the pore space, and structural characteristics of snow such as porosity (ϕ) and tortuosity (τ). In such an approach, without an air flux in the pore space, the water-vapor flux (F) can be described by Fick’s law as in Reference Sokratov and MaenoSokratov and Maeno (2000):
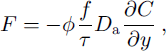
where D a is the water-vapor diffusion coefficient in air, as a function of temperature and air pressure (Reference Roberts and LindsayRoberts, 1963), f is the gradient enhancement factor (Reference YosidaYosida, 1955; Reference Giddings and LaChapelleGiddings and LaChapelle, 1962; Reference Sokratov and MaenoSokratov and Maeno, 2000) and y is the coordinate in the direction of the water-vapor transfer.
The tortuosity depends on snow structure, snow texture and snow density. The experimentally obtained tortuosity/density relation for high-density snow (Reference Schwander, Stauffer and SiggSchwander and others, 1988) contradicts experimental permeability measurements in similar snow (Reference Maeno, Narita and AraokaMaeno and others, 1978). However, for snow with density of <500kg m−3, the reported experimental values (Reference Kominami and TakamiKominami and Takami, 1996) did not show dependence on snow-crystal type or density. For presently available data, the tortuosity can be used as a density-independent value at least in this range of snow densities (Reference Sokratov and MaenoSokratov and Maeno, 2000).
Physical modeling of the water-vapor flux in snow is conceived mainly as a way of estimating the snow-density change with time and the rate of snow recrystallization. When a temperature gradient is applied, both the time change of the snow density (∂p/∂t) (not considering settling, as a mechanical process) and snow-recrystallization rate are regulated by the water-vapor flux in snow. However, neither of them can be related to F directly. The density change is equal to the amount of water vapor lost or added at a particular position in the snowpack:
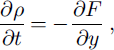
where ρ is snow density and t is time.
The recrystallization rate depends on the evaporation/condensation rate on the ice-crystal surfaces (recrystallization in situ) and the amount of mass which can be additionally transferred onto or out of a crystal by water-vapor flux in the pore space. Thus, the recrystallization rate is also linked to the value of ∂F/∂y, or water-vapor flux change with y.
Estimating ∂F/∂y is not only difficult experimentally, but is not readily related to Equation (1) in its present form. The equation assumes that the volumetric mass (and heat) production in snow is negligible, at least under steady-state conditions, because this considerably simplifies the application of Fick’s law and the Fourier equation. At the same time, it assumes snow to be an unlimited source of water vapor for the pore space; the amount which can be theoretically transferred under an applied temperature gradient is always “available” in theoretical models and mathematical interpretations.
This contradiction is a result of the expected saturation of the water vapor in pore space of snow, or at least conditions very close to saturation. Few attempts have been made to accept non-saturation (logically required for snow-density change with time) (Reference Albert and McGilvaryAlbert and McGilvary, 1992), but the results still could not explain the temperature profiles observed experimentally (Reference Sokratov, Kamata, Sato, Hutter, Wang and BeerSokratov and others, 1999). Moreover, no physical reasons for expecting other than saturation conditions have been proposed so far.
A surface temperature change due to condensation or evaporation is expected both for water drops (Reference KlotsKlots, 1985) and for ice crystals (Reference Thorpe and MasonThorpe and Mason, 1966), when the nucleation process is considered in cloud physics. However, in physical modeling of snow cover the assumptions accepted for use of the Fourier equation and Fick’s law require that the temperatures of snow crystals and the pore space be equivalent. This is because of the large differences in heat conductivity and heat capacity of moist air and ice. It is also expected that the latent-heat release in the evaporation/condensation process is much smaller than the overall heat flux related to an applied temperature gradient, and could not change the conductive heat flux in the ice matrix to any great degree.
All the above assumptions were more likely the result of unknown characteristics of the temperature/diffusion field around individual snow crystals, available for inclusion in physical models, rather than conclusions supported theoretically or by experimental data.
Recently, several studies have been published on interferometric temperature measurements around growing ice crystals. Observation of D20 crystal growth in supercooled heavy water (Reference Braslavsky and LipsonBraslavsky and Lipson, 1998; Reference Furukawa and YokoyamaFurukawa and Yokoyama, 1999) showed a temperature difference of up to 2 K between the crystal surface and the surrounding water. When crystal growth was observed in air (Reference Fujino and TsushimaFujino and Tsushima, 1998), the temperature of the crystal surface again was >1K higher than that of surrounding air.
The above-cited studies allow us to expect different saturated water-vapor concentrations for different temperatures in the pore space and near the crystal surface, thus supplying a “driving force” for the mass exchange. The temperature difference is not exactly the “driving force” in the meaning used for the water-vapor concentration gradient considerations (Reference Albert and McGilvaryAlbert and McGilvary, 1992). More accurately, it can be termed the component of the mass and energy balance of the evaporating and condensing snow crystals, not included in earlier physical descriptions of the process. This paper attempts to relate the available snow-recrystallization data to the mass exchange on a crystal surface and the snow-density change, based on the reported temperature difference between a crystal surface and the surrounding air.
Temperature Field Around Crystals
The process of single-crystal growth from the vapor phase has been analyzed in its geometrical (Reference KomabayasiKomabayasi, 1972) and thermal (Reference Guseva-Lozinski, Hutter, Wang and BeerGuseva-Lozinski, 1999) aspects; it has also been considered from the viewpoint of surface morphology (Reference De Micheli, Licenblat and OuraDe Micheli and Licenblat, 1967) and related to the type of crystals (Reference Gonda and SeiGonda and Sei, 1987). It is concluded that the growth rate is different for different faces of a crystal (Reference HobbsHobbs, 1974), and different types of crystals will be formed under different rates of supersaturation and different temperatures (Reference HobbsHobbs, 1974). However, the available data have not so far been applied to the crystal growth inside a snow cover. This physical setting is much more variable.
The interferometric measurements cited above showed that an “isothermally” growing D2O crystal under 1.62 K supercooling had about 0.7 K variation in temperature normal to the crystal surface, which produced surface temperature gradients of > 100–200 K I m−1 (personal communication from I. Braslavsky, 1997). Interferometric image analysis showed that a growing crystal was surrounded by an almost spherical region of water, «0.9 K above the set temperature of supercooling, covering all the micro-relief forms on the crystal surface and having a small internal temperature gradient. The temperature difference between this “thermal diffusion field” and the environment was ≈0.7K. Thus, about half of the temperature drop between the surface of a growing crystal and the environment took place immediately on the crystal surface, and the rest occurred on the external border of the thermal diffusion field.
In air, the structure of the diffusion field around a growing crystal cannot be seen by such a technique (which was the reason for using heavy water with interferometry (Reference Braslavsky and LipsonBraslavsky and Lipson, 1998; Reference Furukawa and YokoyamaFurukawa and Yokoyama, 1999)). Still, the observed temperature gradients in ice crystals were up to 1000 Km−1, and temperature difference between the highest surface temperature and the temperature of surrounding air could be up to 1.3 K (Reference Fujino and TsushimaFujino and Tsushima, 1998). The temperature of the environment in this experiment was well below the melting point.
The main difference between results observed in heavy water and in air is related to the surface temperature structure. In supercooled water the maximal temperatures were observed in concave crystal surface forms, while in air the highest temperatures were on the growing edges of a snowflake. The last observation led Reference Fujino and TsushimaFujino and Tsushima (1998) to suggest that the “incoming” latent heat was compensated not by conductive heat transfer inside the crystal, but by radiative energy loss.
The experimental results on single-crystal growth in air (Reference Gonda and SeiGonda and Sei, 1987) showed that both growth and evaporation took place on the convex parts (the furthest from the center of crystal), implying that a diffusion field, similar to that observed in water, is present and interacts with the surrounding air. The temperature variation over the surface should depend on the distance from the diffusion-field border. In the case of single-crystal growth, the mass balance of an entire crystal is either negative (crystal evaporates) or positive (condensation takes place). In general, the concave relief forms should correspond to minimal water-vapor saturation degree. Thus, inside the diffusion field, when mass exchange with the surrounding environment is not enforced by high super- or non-saturation, the water-vapor flux should be directed from convex edges to concave areas, resulting in a decrease with time of crystal surface energy. It can also be expected that, depending on the degree of saturation around a crystal, the mass exchange is either totally regulated by the water vapor from the surrounding air, or is partly a result of this external mass exchange and partly a result of water-vapor exchange between convex and concave relief forms inside the diffusion field. The interferometric data allow us to relate approximately half of the temperature difference between a crystal surface and the environment to the internal diffusion-field mass exchange, while the other half will be responsible for the mass exchange between the crystal and the surrounding environment.
Mass Balance of a Crystal Surface in Snow
Introduction of a diffusion field into the modeling of nucleation was expected to reduce the difference between theoretically calculated and experimentally observed mass-growth-rate/temperature relations by enhancing the modeled water-vapor pressure differences over different parts of a crystal (Reference HobbsHobbs, 1974). In contrast to crystal growth in clouds, recrystallization in snow cover takes place when crystals contact each other. It has been argued that the isothermal snow compaction is caused dominantly by water-vapor diffusion through the air (Reference Hobbs and RadkeHobbs and Radke, 1967), forming necks between grains and related to curvature differences (Reference Brown, Edens and SatoBrown and others, 1994,Reference Brown, Edens, Barber, Sato, Izumi, Nakamura and Sack1997). Considering a temperature difference between grains and necks, related to the latent-heat release but compensated by conduction (Reference ColbeckColbeck, 1980; Reference Brown, Edens and BarberBrown and others, 1999), did not influence the modeled results, which were still smaller than the observed ones (Reference BrownBrown, 1999). Thus, an additional enhancement factor is required in modeling isothermal snow recrystallization. We propose that this is the temperature difference across the crystal surface and between the surface and the pore space, which is related to the latent-heat release in condensation and evaporation and is not necessarily compensated by heat flux in the ice matrix.
It can be suggested that the diffusion field in snow is not determined by surface properties of a single crystal, but belongs to the whole ice-matrix surface. However, temperature variation across the ice-matrix surface should be subject to the same processes as reported for single-crystal growth. Thus, both the density change and the recrystallization rate should depend on the degree of “saturation”. In our case, it can be considered as a saturated water-vapor pressure difference as the result of the temperature difference across the ice-matrix surface and between the surface and the air in the pores.
If the temperature difference is indeed a component of the water-vapor exchange between ice matrix and the pore space, the Knudsen-Langmuir equation for calculating the mass balance on a crystal surface can be used. The amount of water vapor condensing/evaporating on a surface of an ice crystal is regulated by a condensation/evaporation coefficient of ice (a) and structure of the diffusion field in porous space. The net flux from/to a surface (N) can be expressed after Reference HobbsHobbs (1974), Reference BeckmannBeckmann (1982), Reference ColbeckColbeck (1982) and Reference Beckmann, Lacmann and BlerfreundBeckmann and others (1983) as:
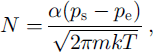
where Ps and Pe are the vapor pressures near the surface and “in the environment”, respectively, m is the mass of molecule, k is Boltzmann’s constant and T is the surface temperature. Equation (3) is often used as a basis for modeling the ice-crystal growth in clouds (Reference HobbsHobbs, 1974).
The only available number for the diffusion field around ice-matrix components is the temperature difference reported in Reference Fujino and TsushimaFujino and Tsushima (1998). They observed a value of 0.51 °C along a snow crystal growing in air, and about the same temperature difference between the average crystal temperature and the environment at –15.2°C. The temperature difference should depend on the possible amount of the saturated water vapor inside the diffusion field, decreasing with temperature decrease, and, when radiative transfer is accepted as a mechanism of energy loss, should depend on the emissivity of ice crystals, with emission also decreasing with temperature decrease. It probably would not be too far from reality to use the temperature difference for rather high temperature reported by Reference Fujino and TsushimaFujino and Tsushima (1998) for the whole temperature range of water-vapor “reproduction” and snow recrystallization when a corresponding evaporation/condensation coefficient can be selected.
A wide range of condensation coefficients has been reported. The variation of the values was often related to uncertainties in experimental procedures, suggesting the need for other techniques of measurements (Reference ButkovskiiButkovskh, 1994). Evaporation coefficient of ice in vacuum was often expected to be close to unity (Reference BalakhonovaBalakhonova, 1974). The experimentally measured coefficients were mostly obtained at temperatures below –50°C, and in this range the value of a increased with temperature decrease (Reference HobbsHobbs, 1974; Reference Krass and MerzlikinKrass and Merzlikin, 1990). The condensation coefficient was found to be dependent on the type of ice forming a crystal (Reference Chaix, van den Bergh and RossiChaix and others, 1998). It has been suggested that the evaporation and condensation coefficients are not equal (Reference Haynes, Tro and GeorgeHaynes and others, 1992). The most complete interpretation of the condensation coefficient dependence on temperature and water-vapor pressure based on experimental data has been given by Reference BrownBrown and others (1996), but the dependencies shown were constructed assuming equal temperatures between the ice surface and the surrounding air. Although their recalculation is possible, it is beyond the scope of this study.
There are no data available to include the considerations cited above in our constructions. Thus, selecting the value of a = 0.06 (Reference Chaix, van den Bergh and RossiChaix and others, 1998) for temperatures close to 0°C seems to be reasonable for our formulations. This number, when applied to evaporation from ice and snow samples in Equation (3), gives rather good agreement with experimental results (Reference Golubev and SokratovGolubev and Sokratov, 1991). Moreover, a as a limiting factor in the process of evaporation from a snow surface can explain values of the calculated “effective” thickness of an air layer of water-vapor concentration change ranging from those near a snow/ice surface to those in the free atmosphere (Reference Golubev and SokratovGolubev and Sokratov, 1991). The observed increase of the condensation coefficient with temperature decrease can be interpreted as an additional support of the validity of using the temperature difference observed by Reference Fujino and TsushimaFujino and Tsushima (1998) as a constant for all the observed range of temperature conditions, as long as the condensation coefficient is also assumed constant in calculating N (Equation (3)).
The amount of water-vapor recrystallization in a unit of snow volume depends on the area subject to the mass-exchange process, i.e. the specific surface area of snow (S). Difficulties in geometrical modeling of real snow do not allow construction of the specific surface area based on easily measured snow characteristics. That is why only experimental data can be used for snow modeling (Reference NaritaNarita, 1969,Reference Narita1971; Reference PerlaPerla, 1985). Optical methods give approximate ranges of this characteristic for several types of snow (Reference NaritaNarita, 1971). For compacted snow with density 300–500 kg m−3, the specific surface area was found to be in the range 3000–4000 m2 m−3. Measurements on snow cores from Antarctica showed that the specific surface area value increased with decreasing density (Reference Nishimura and MaenoNishimura and Maeno, 1984). For new snow, use of the nitrogen adsorption technique gave a specific surface area in the range 9000–55 500 m2 m−3 (assuming snow density not more than 150 kg m−3) (Reference Hoff, Gregor, MacKay, Wania and JiaHoff and others, 1998).
Applying Equation (3) to natural snow, the maximum possible water-vapor production or absorption in a unit of snow volume (P) should be determined by:

For growth or evaporation of a single crystal, S can be replaced by the surface area of the crystal (Reference Fassnacht, Innes, Kouwen and SoulisFassnacht and others, 1999). When snow recrystallization takes place without externally supplied water vapor, approximately half of the specific surface area can be expected to be subject to evaporation, and the other half to condensation. Thus, the total water-vapor “reproduction” can be close to P/2. Calculated temperature dependencies for three different specific surface areas, for the accepted temperature difference inside the diffusion field of about 0.5°C, are shown in Figure 1.
Theoretically expected water-vapor “reproduction” in snow. Specific surface areas, from top downward, are 30 000, 4000 and 3000 m2m−3.

“Isothermal” Metamorphism
The temperature-dependent water-vapor “reproduction”presented in Figure 1 correlates surprisingly well with the rates of nearly isothermal recrystallization reported for Antarctica and Greenland (Reference GowGow, 1975) (Fig. 2). Two lines are drawn, because the results of crystal-size determination depended on the method used. The “thin-section” analysis (Reference Kinosita and WakahamaKinosita and Wakahama, 1959) generally underestimates the crystal size, forcing one to use various techniques for recalculating the observed results to actual S. We cannot expect much accuracy in recalculating the two-dimensional area change into three-dimensional volume/mass change of crystal, and we also cannot expect perfect agreement in crystal-size determination between different investigators even when they all use the “thin-section” method. The technique used for “other methods” was not described by Reference GowGow (1969, Reference Gow1975), but the results are in agreement with the general dependence of the recrystallization rate on water-vapor “reproduction”, giving smaller rates of recrystallization probably because of a less accurate recalculation. It can be suggested that the exponent in the empirical equation for isothermal crystal-growth rate (Reference GowGow, 1975) and the logarithmic scale used in Reference Lipenkov, Ryskin and BarkovLipenkov and others (1999) for the relationship of temperature/age of firn at the close-off depth can be referred to the mass-exchange process described by Equation (3).
Relations between the isothermal recrystallization rates and the water-vapor “reproduction”, after Reference GowGow (1975).

The recrystallization rate decreases with time (Reference Giddings and LaChapelleGiddings and LaChapelle, 1962) and depends on the initial conditions of snow deposition and mass-transfer processes, before a snow layer reaches the depth where the temperature conditions become “isothermal”. But for many years of recrystallization, as was the case in the samples analyzed by Gow, the above effects seem to be of much less importance than the recrystallization-rate dependence on the mass balance of crystal surface. The three orders higher recrystallization rates in lightly compacted snow observed by Reference Kamata, Sokratov, Sato, Hutter, Wang and BeerKamata and others (1999b) do not contradict the results from firn, as will be explained below. Direct recalculation of the water-vapor “reproduction” into recrystallization rate seems to be possible, but requires data on the time dependence of the recrystallization rate for the same types of snow, for which the temperature dependencies are available.
Water-Vapor Exchange with the Pore Space
The decrease in snow-crystal quantity per unit of volume reported by numerous investigators, and the disappearance of small crystals during metamorphism, should be a result not only of recrystallization in situ, but also of mass exchange through the pore space, enforced by the surface temperature varying along the ice matrix. The amount of such exchange should be proportional to the total volumetric water-vapor “reproduction” and thus will have temperature dependence similar to that shown in Figure 1. Application of a temperature gradient to a snowpack leads both to the temperature-field “orientation”, most likely increasing the temperature variation on a single crystal-size scale, and to enhanced water-vapor flux in the pore space relative to isothermal conditions. The last factor corresponds to mass redistribution in the direction of the heat and mass fluxes. The results are enhanced recrystallization rate and snow-density change. That the temperature gradient plays a leading role in snow recrystallization was suggested by Reference Giddings and LaChapelleGiddings and LaChapelle (1962) and Reference De Quervain and KingeryDe Quervain (1963), among others.
More recent results show that the rate of recrystallization is more universally correlated to the water-vapor flux in snow, dependent not only on temperature gradient, but also on water-vapor concentration in the pore space (Reference Kamata, Sokratov and SatoKamata and others, 1999a, Reference Kamata, Sokratov, Sato, Hutter, Wang and Beerb). For compacted snow under a temperature gradient, the necks forming the “hard depth hoar” appear only when the temperature gradient exceeds some relatively large value. The higher the snow density is, the less this value can be (Reference AkitayaAkitaya, 1964,Reference Akitaya1975). When the temperature gradient is small, the snow hardness decreases with time. Rewording this for the diffusion-field considerations: the lower the specific surface area of snow is, or the lower is the temperature of mass redistribution over a crystal surface (Fig. 1), the more water vapor from the diffusion field around individual snow crystals forms necks between neighboring grains, even with a smaller applied temperature gradient. The formation of necks is not actually related to the recrystallization in terms of crystal-size increase with time (Reference GowGow, 1975). Taking into account the temperature gradients around and inside the crystals observed by interferometry, an externally applied temperature gradient has to be at least of comparable magnitude to influence the snow recrystallization through changing the structure of the diffusion field. Even under temperature-gradient conditions, the diffusion field and the presence of a temperature difference along the ice-matrix surface will play an important role in water-vapor flux and snow recrystallization, at least until the temperature gradient is smaller than some critical value.
The density change in natural snowpack or in a sample used in the laboratory requires a snowpack (sample) to be divided into zones where condensation prevails and zones where evaporation prevails. For condensation zones, the condensed material partly belongs to the same crystal and partly is coming from the pore space. The mass exchange of the diffusion field with air in the pore space takes place through the “diffusion field border”, with temperature gradients higher than those inside the diffusion field. However, the “specific surface area” of the diffusion field is much smaller than that measured by various techniques. The activity of this exchange is characterized by ∂p/∂t (Equation (2)). When ∂p/∂t > 0, it can be expected that either the condensation part of the specific surface area is larger than the evaporation part, or the temperature field is formed in such a way that the temperature difference between the parts of the ice-matrix surface where water vapor condenses and the surrounding air is greater than the difference between the air and the evaporation areas. For ∂p/∂t < 0 the situation should be opposite. In any case the amount of mass exchange cannot exceed twice the values presented in Figure 1.
The |∂F/∂y| values calculated from the observed temperature distributions were always less than the possible amount of water-vapor “reproduction” in snow, but showed wide variation within this limit (Reference SokratovSokratov, 1997; Reference Kamata, Sokratov and SatoKamata and others, 1999a). Also, this variation had to be the product of both the activity of the water-vapor “reproduction” under different temperatures and the value of an applied temperature gradient.
“Temperature-Gradient” Metamorphism
The term “temperature-gradient” metamorphism of snow implies that the temperature gradient is influencing the rate of snow recrystallization. However, this influence can involve at least two different mechanisms. The heat flux in the ice matrix due to an externally applied temperature difference can change the structure of the temperature variation along the ice-matrix surface related to evaporation/condensation activity. The water-vapor flux, which is also related to the temperature gradient, should interfere with the activity of water-vapor exchange between the diffusion field and the pore space, through the temperature-gradient-dependent ∂F/∂y. Separating the influence of temperature gradient from that of ∂F/∂y is difficult, and may not be possible. It can only be accepted that, under quasi-steady-state conditions, the experimentally observed values of T, ∂T/∂y, F and ∂F/∂y are already products of the complete compensation between the recrystallization in situ, water-vapor exchange with the pore space, and the externally applied heat flux, in the process of snow evolution.
The results of two experimental studies were available for our formulations. “High-temperature-gradient” data were taken from Reference Kamata, Sokratov and SatoKamata and others (1999a), accepting the specific surface area of light compacted snow to be 4000 m2 m−3 (the snow density was 290 kg m−3; the experimental time was 56 hours). The “low-temperature-gradient” data were taken from Reference SokratovSokratov (1997), with lower specific surface area of 3000 kg m2 m−3 (the snow density in this case was 431 kg m−3 and experimental time was 6 days). Table 1 summarizes results of the experiments. Trend lines presented in Figures 4–6 are made separately for the evaporation and the condensation zones in the snow samples analyzed. The evaporation and condensation zones from “low-temperature-gradient” data were identified from the measured temperature distributions in Reference Sokratov and MaenoSokratov and Maeno (1998). For the “high-temperature-gradient” data they were accepted as corresponding to the “warm” and the “cold” parts of snow samples, respectively (Reference Sokratov, Kamata, Sato, Hutter, Wang and BeerSokratov and others, 1999). Mostly negative values of ∂F/∂y, when estimated from temperature and temperature-gradient results by Equation (1) (and not always corresponding to the expected direction of the density change), suggest that for the present spatial resolution of temperature measurements the ∂F/∂y values more likely show the asymmetry of the water-vapor flux relative to an individual ice crystal in snow than the actual density change. Positive temperature gradients were explained in Reference Sokratov and MaenoSokratov and Maeno (1998). The high variability of the specific surface areas for new snow prevented us from including recrystallization data presented in Reference Fukuzawa and AkitayaFukuzawa and Akitaya (1993); but the conclusions obtained in the present work do not contradict them.
Experimental data used in examination of the temperature-gradient recrystallization

The experimental data from Table 1 are shown in Figure 3. Comparing the numbers shows that the recrystallization rate under “low temperature gradients” was, in general, not less than that under “high temperature gradients”. This must be attributed to the water-vapor “reproduction” influence on snow recrystallization, in the case of “low temperature gradient” taking place under higher temperature than in all the “high-temperature-gradient” cases presently available for analysis (Fig. 1). Further, the recrystallization rate under similar temperature gradients is higher in evaporation zones. All three factors (i.e. water-vapor “reproduction”, temperature gradient and water-vapor flux asymmetry along the y coordinate) influence the recrystallization rates.
Experimental data on the temperature-gradient recrystallization rates related to the water-vapor “reproduction” (Reference SokratovSokratov, 1997; Reference Kamata, Sokratov and SatoKamata and others, 1999a, Reference Kamata, Sokratov, Sato, Hutter, Wang and Beerb).

Considering the relation of snow-crystal recrystallization rate to water-vapor flux presented in Reference Kamata, Sokratov and SatoKamata and others (1999a, Reference Kamata, Sokratov, Sato, Hutter, Wang and Beerb), we attempted to estimate the recrystallization-rate dependence on the value of ∂F/∂y. To do so, we omit the water-vapor “reproduction” dependence by recalculating the recrystallization rates for a single temperature (0°C in this case), which is possible by using its temperature dependence from Equation (3). The ∂F/∂y values can also be recalculated to 0°C according to their rate to the maximum possible water-vapor “reproduction” at the actual temperature. Results of such data interpretation are shown in Figure 4. Similar 0°C recalculation of the “isothermal data” (Fig. 2) will give values that are of orders similar to those for the low temperature gradients in Figure 4. However, we do not think it is appropriate to combine the “isothermal” and the “temperature-gradient” recrystallization rates in one set, because of considerable differences in types of snow and methods of observation.
Temperature-gradient recrystallization rate (for 0°C; see text) related to the value of ∂F/∂y, when calculated from the experimental data by Equation (1) (for 0°C). The lines show best fit curves separately for the evaporation and condensation zones in the samples.

The “traditionally” used relationship of snow-recrystallization rates to temperature gradient is shown in Figure 5. Both the temperature gradient and ∂F/∂y influenced these relationships, but the graphs illustrate that the temperature gradient alone cannot be used as a basis for recrystallization-rate analysis.
Temperature-gradient recrystallization rates (for 0°C) related to the observed temperature gradient. The lines show best fit curves separately for the evaporation and condensation zones in the samples.

The results presented in Figures 4 and 5 clearly show that dividing the data into those from the evaporation zone and those from the condensation zone makes sense. For the evaporation zone, two mechanisms could work: under small temperature gradients the mass losses, taking place mostly from crystal surfaces closest to the diffusion border, should lead to crystal-size decrease, while the mass exchange between the crystals tends to increase the average crystal size. The rate between these two processes for present conditions should be regulated by the possible rate between |∂F/∂y| and P. For the condensation zone there seems to be no mechanism for crystal-size decrease; thus, the higher recrystallization rates are reasonable.
Amount of Water Vapor in the Pore Space
The above-presented analysis forces one to conclude that the recrystallization rate is regulated: (i) by temperature, through the temperature dependence of the activity of water-vapor “reproduction” on a crystal surface; and (ii) by temperature gradient, though the last term can have opposite effects on the recrystallization, on the one hand possibly enhancing the mass exchange on a crystal surface, and on the other hand being responsible for enhanced material lost from the diffusion field around the grains to the pore space of snow. This may explain the behavior of the recrystallization-rate dependence on temperature gradient for conditions of condensation shown by the gray region in Figure 5. The characteristic, being a result of the temperature-gradient effect on the rate of snow recrystallization, is the ratio between the water-vapor asymmetry in the pore space (|∂F/∂y|) and the water vapor “reproduced” on the ice-matrix surface (P). The relationship between the recrystallization rate and (|∂F/∂y|) is shown in Figure 6. Although the number of points on the graph is too small for quantitative assessment, the data suggest that in the evaporation zone a high enough temperature gradient can result in most of the material “reproduced” on the surface of the ice matrix being transferred to the pore space. In this case, the snow crystal can even disappear instead of growing continuously (and we can expect the recrystallization rates shown by the dashed line to achieve negative values when |∂F/∂y|/P → 1 For the condensation zone there seems to be a maximum possible amount of water vapor which can be adsorbed from the pore space. According to present data and with the accepted method of interpretation, it corresponds to approximately 30–40% of the maximum possible amount of water-vapor “reproduction”.
Temperature-gradient recrystallization rate (0°C) related to the |∂F/∂y| ratio (”asymmetry of the water-vapor flux around an individual crystal” to the water-vapor “reproduction”). The lines show approximations separately for the evaporation and condensation zones.

Figure 7 shows the ∂F/∂y/P ratio relation to temperature gradient.
|∂F/∂y|/P dependence on the observed temperature gradient and the best fit approximation.

Thus, the water vapor which can be added to or extracted from the water-vapor flux in the pore space is determined by the part of water-vapor “reproduction” which can interact with the pore space. The minimum rate calculated for the present experiment was <5%. As a small temperature gradient cannot noticeably change the rate of recrystallization relative to isothermal conditions (according to data from Reference AkitayaAkitaya (1964)), this rate may also be the amount of water vapor transferred between the snow grains in the absence of a temperature gradient (”isothermal” metamorphism). For temperature-gradient conditions, the ratio |∂F/∂y|/P generally increases with temperature-gradient increase (Fig. 7). However, it can be close to unity when evaporation prevails in the part of snowpack considered, but does not exceed some limiting value when condensation prevails. In the last case a wide range of recrystallization rates can be expected, and the limiting value probably explains the abnormal rates of recrystallization under specific meteorological conditions resulting in depth-hoar formation in the surface layer of a snowpack (Reference Fukuzawa and AkitayaFukuzawa and Akitaya, 1993).
Conclusions
The temperature difference between the pore space and ice matrix may be the reason for water-vapor “reproduction” in snow. It allows us to relate the density change, resulting from the water-vapor transfer in snow under an applied temperature gradient, to the small-scale crystal surface mass balance, leading to snow recrystallization. Although few experimental data are available for such formulations, they can still be used to conclude that the density change by water vapor and activity of snow-crystal recrystallization must be modeled differently for conditions of density decrease and density increase. The amount of water vapor which can be produced or absorbed by an ice matrix depends on temperature. The water vapor transferred to the pore space shows strong dependence on the applied temperature gradient, while the recrystallization rate is a function of the ratio between water-vapor “reproduction” on a crystal surface and water-vapor exchange between the diffusion field around the ice matrix and the pore space of snow. This ratio is temperature-gradient dependent.
Consideration of the temperature difference, related to the latent-heat release in the evaporation/condensation process, is suggested as a way to solve long-term uncertainties in physical interpretations of the snow metamorphism and the heat- and mass-transfer mechanism in snow. However, the few reported results of observations can be of some use. Snow properties where further study is required include: the evaporation and condensation coefficients of snow-crystal surfaces in dependence on temperature; the possible temperature difference between the snow crystals and pore space in dependence on temperature and snow structure; the specific surface area of different types of snow; the tortuosity dependence on the snow density; the measured recrystallization rates with and without temperature gradient for different types of snow.
The hope is that the application of new techniques to snow physics, partly cited in this paper, will make it possible to construct a growth-habit diagram of the snow-crystal recrystallization process in a snowpack in dependence on temperature, temperature gradient and snow structure, similar to those produced for ice-crystal nucleation in clouds. The authors regard the present work as a first step in such a formulation, which is necessary for the physical modeling of snow evolution and the application of snow models to natural environmental processes.
Acknowledgements
The preparation of this paper and the Symposium presentation was supported by the award of a Visiting Fellowship at CIRES, University of Colorado, Boulder, to S. A. Sokratov. The experimental data used were obtained with partial support of the Japanese Government (Monbusho) scholarship (S.A. Sokratov) and the Japan Science and Technology Agency through JST and JISTEC (S.A. Sokratov and Y. Kamata). The authors are grateful to R. G. Barry and T. Scambos for editing the paper. Authors thank an anonymous reviewer for important suggestions, and S. P. K. Satyawali and D. Issler for useful comments and support of publication.



