INTRODUCTION
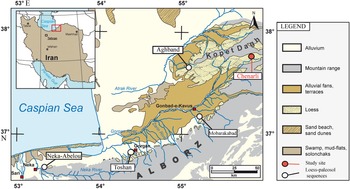
Loess–paleosol sequences in mid- to high-latitude regions reflect a changing balance between pedogenesis and loess accumulation (e.g., Heller and Liu, Reference Heller and Liu1984; Catt, Reference Catt1991; Pecsi, Reference Pecsi, Pécsi and Schweitzer1995; Begét, Reference Begét2001; Schaetzl et al., Reference Schaetzl, Bettis, Crouvi, Fitzsimmons, Grimley, Hambach and Lehmkuhl2018; Rousseau et al., Reference Rousseau, Antoine, Boers, Lagroix, Ghil, Lomax and Fuchs2020; Song et al., Reference Song, Li, Cheng, Zong, Kang, Ghafarpour and Li2021). Extensive loess deposits are found in northern and northeastern Iran, especially in the northern Iranian Loess Plateau (NILP) and along the northern foothills of the Alborz Mountains (NFAM; Fig. 1). These loess deposits are separated by buried soils that formed under relatively moist and warm climatic conditions (e.g., Frechen et al., Reference Frechen, Kehl, Rolf, Sarvati and Skowronek2009; Kehl, Reference Kehl2010; Karimi et al., Reference Karimi, Frechen, Khademi, Kehl and Jalalian2011; Lauer et al., Reference Lauer, Vlaminck, Frechen, Rolf, Kehl, Sharifi, Lehndorff and Khormali2017b; Ghafarpour et al., Reference Ghafarpour, Khormali, Balsam, Forman, Cheng and Song2021a; Kehl et al., Reference Kehl, Vlaminck, Köhler, Laag, Rolf, Tsukamoto, Frechen, Sumita, Schmincke and Khormali2021). Regressions and transgressions of the Caspian Sea (e.g., Yanina, Reference Yanina2014; Yanina et al., Reference Yanina, Sorokin, Bezrodnykh and Romanyuk2018; Krijgsman et al., Reference Krijgsman, Tesakov, Yanina, Lazarev, Danukalova, Van Baak and Agustí2019; Leroy et al., Reference Leroy, Lahijani, Crétaux, Aladin, Plotnikov and Mischke2020) may have affected loess formation in the Caspian Lowlands by changing the size of the dust source area and by their influence on regional climate (Vlaminck et al., Reference Vlaminck, Kehl, Rolf, Franz, Lauer, Lehndorff, Frechen and Khormali2018; Kehl et al., Reference Kehl, Vlaminck, Köhler, Laag, Rolf, Tsukamoto, Frechen, Sumita, Schmincke and Khormali2021). Little information is available on the origin of loess in the area. Ghafarpour et al. (Reference Ghafarpour, Khormali, Meng and Tazikeh2021b) pointed out that loess in the Mobarakabad section in the NFAM may have originated from actively eroding crustal sources from relatively young mountain belts (Alborz and Kopet Dagh) around the loess accumulation area. Furthermore, Költringer et al. (Reference Költringer, Stevens, Lindner, Baykal, Ghafarpour, Khormali, Taratunina and Kurbanov2022) proposed a complex system for the primary sources and transportation pathways of loess at Aghband in the NILP, including sediments of the South Caspian Basin, the Karakum Desert, and nearby and distant mountain ranges.
Map of northeastern Iran with locations of loess–paleosol sequences mentioned in the text, the distribution of loess deposits, and other geomorphological features (after Kehl et al., Reference Kehl, Vlaminck, Köhler, Laag, Rolf, Tsukamoto, Frechen, Sumita, Schmincke and Khormali2021). The loess–paleosol sequences of Neka-Abelou, Toshan, and Mobarakabad are situated along the northern footslopes of the Alborz Mountain range (NFAM), while the loess–paleosol sequences at Aghband and Chenarli are located in the northern Iranian Loess Plateau (NILP).

Diffuse reflectance spectrophotometry (DRS) provides a rapid, nondestructive, and quantitative method to identify the iron oxide and oxyhydroxide minerals hematite and goethite (e.g., Balsam and Deaton, Reference Balsam and Deaton1991; Torrent et al., Reference Torrent, Liu, Bloemendal and Barrón2007; Hu et al., Reference Hu, Jiang, Liu, Heslop, Roberts, Torrent and Barrón2016; Sandeep et al., Reference Sandeep, Shankar, Warrier and Balsam2017). DRS has been applied to loess–paleosol sequences to understand pedogenic processes and to reconstruct past climate (Ji et al., Reference Ji, Balsam, Chen and Liu2002; Balsam et al., Reference Balsam, Ji and Chen2004; Hu et al., Reference Hu, Liu, Torrent, Barrón and Jin2013; Zeeden et al., Reference Zeeden, Krauß, Kels and Lehmkuhl2017; Laag et al., Reference Laag, Hambach, Zeeden, Lagroix, Guyodo, Veres, Jovanović and Marković2021). Magnetic measurements provide information on magnetic enhancement/dissolution mechanisms in soils and paleosols (e.g., Geiss et al., Reference Geiss, Egli and Zanner2008; Orgeira et al., Reference Orgeira, Egli, Compagnucci, Petrovsky, Ivers, Harinarayana and Herrero-Bervera2011; Roberts, Reference Roberts2015; Ahmed and Maher, Reference Ahmed and Maher2018; Bilardello et al., Reference Bilardello, Banerjee, Volk, Soltis and Penn2020) and can be used to quantify soil and paleosol development intensity (e.g., Spassov et al., Reference Spassov, Heller, Kretzschmar, Evans, Yue and Nourgaliev2003; Geiss and Zanner, Reference Geiss and Zanner2006; Tecsa et al., Reference Tecsa, Mason, Johnson, Miao, Constantin, Radu, Magdas, Veres, Marković and Timar-Gabor2020; Költringer et al., Reference Költringer, Stevens, Bradák, Almqvist, Kurbanov, Snowball and Yarovaya2021). Magnetic properties have also been widely used to reconstruct paleoclimate changes in loess–paleosol sequences (e.g., Hu et al., Reference Hu, Liu, Heslop, Roberts and Jin2015; Zeeden et al., Reference Zeeden, Hambach, Veres, Fitzsimmons, Obreht, Bösken and Lehmkuhl2018; Stevens et al., Reference Stevens, Sechi, Bradák, Orbe, Baykal, Cossu, Tziavaras, Andreucci and Pascucci2020; Bradák et al., Reference Bradák, Seto, Stevens, Újvári, Fehér and Költringer2021; Wacha et al., Reference Wacha, Laag, Grizelj, Tsukamoto, Zeeden, Ivanišević, Rolf, Banak and Frechen2021). Previous studies of loess–paleosol sequences in northern and northeastern Iran have shown that modern soils and paleosols are generally magnetically enhanced, and suggest a relationship between increased fine-grained ferrimagnetic mineral content of surface soils with higher rainfall (e.g., Karimi et al., Reference Karimi, Khademi and Ayoubi2013; Ghafarpour et al., Reference Ghafarpour, Khormali, Balsam, Karimi and Ayoubi2016; Najafi et al., Reference Najafi, Karimi, Haghnia, Khormali, Ayoubi and Tazikeh2019; Sharifigarmdareh et al., Reference Sharifigarmdareh, Khormali, Scheidt, Rolf, Kehl and Frechen2020; Kehl et al., Reference Kehl, Vlaminck, Köhler, Laag, Rolf, Tsukamoto, Frechen, Sumita, Schmincke and Khormali2021). These studies mainly focused on the alternating magnetic properties between loess and paleosols with little emphasis on the magnetic enhancement/dissolution mechanism.
We present here the first investigations of loess–paleosol sequences in the eastern NILP focusing on magnetic and colorimetric properties of the Chenarli sequence. Our aim is to characterize iron (hydr)oxide formation by measuring a suite of color and magnetic parameters. This information will help us to understand the magnetic enhancement/dissolution process in the modern soil and paleosols of the studied section. We further report the first luminescence and radiocarbon data for this sequence to provide a preliminary chronologic frame, with the goal of using these ages to link paleosols and modern soil formation in terms of (paleo)climate. Finally, we present a tentative regional stratigraphic correlation between the Chenarli section and other known loess–paleosol sequences in northern Iran to provide new insights into the regional timing of loess depositional phases and periods of pedogenesis.
GEOGRAPHIC AND CLIMATOLOGIC CONTEXT
Loess deposits in the NILP are found to have >60 m thickness (Lauer et al., Reference Lauer, Vlaminck, Frechen, Rolf, Kehl, Sharifi, Lehndorff and Khormali2017b). The oldest strata probably reach the Lower Pleistocene (Wang et al., Reference Wang, Wei, Taheri, Khormali, Danukalova and Chen2016). Previous luminescence studies provide a geochronologic framework for loess–paleosol sequences and sand dunes in the wider study area of northern Iran (Frechen et al., Reference Frechen, Kehl, Rolf, Sarvati and Skowronek2009; Lauer et al., Reference Lauer, Frechen, Vlaminck, Kehl, Lehndorff, Shahriari and Khormali2017a, 2017b; Rahimzadeh et al., Reference Rahimzadeh, Khormali, Gribenski, Tsukamoto, Kehl, Pint, Kiani and Frechen2019). These studies indicate that loess–paleosol sequences in this area span the interval from Marine Isotope Stage (MIS) 7 to MIS 1 (~220 to ~9 ka), whereas the sand dunes mainly accumulated in the Early Holocene (10–8 ka). The section at Chenarli (37°42′55.50″N, 55°49′13.10″E) is located in the southern Kopet Dagh fold belt and in the easternmost NILP (Fig. 1), at 490 m above sea level (m asl). A mean annual precipitation (MAP) of ~450 mm and a mean annual air temperature of 17°C characterize the currently semiarid climate. A typic xeric soil moisture regime is dominant in the area, and soil moisture is high from October to March and then drops sharply in summer, while average monthly air temperature reaches its peak of 28°C in July–August (Khormali et al., Reference Khormali, Shahriari, Ghafarpour, Kehl, Lehndorff and Frechen2020).
MATERIAL AND METHODS
Spectrophotometric analysis
The sequence was sampled at 4 cm stratigraphic resolution, which resulted in a total of 826 samples for spectrophotometric analyses. Determination of the colorimetric properties was conducted by measuring the diffuse reflected light for the <2 mm fraction from all samples, using a Konica Minolta CM-5 spectrophotometer. The measurements followed a standardized procedure (2° standard observer and illuminant C) according to Eckmeier et al. (Reference Eckmeier, Egli, Schmidt, Schlumpf, Nӧtzli, Minikus-Stary and Hagedorn2013). The spectrophotometric analysis covers the visible light range from 360 to 740 nm in 10 nm increments. The obtained spectral information was converted to the Commission Internationale de l'Eclairage (CIE) using the SpectraMagic NX software (Konica Minolta). Color planes are defined in the CIE (L*a*b*) system by the Cartesian axes a* and b*, which coincide at the achromaticity point. The a* axis extends to the complementary colors red (+a*) and green (−a*), and the b* axis extends to the complementary colors yellow (+b*) and blue (−b*). A third axis normal to a* and b* defines the lightness, L*(Scheinost and Schwertmann, Reference Scheinost and Schwertmann1999).
Reflectance data were processed to obtain percent reflectance in standard color bands (Judd and Wyszecki, Reference Judd and Wyszecki1975), that is, violet = 400–450 nm, blue = 450–490 nm, green = 490–560 nm, yellow = 560–590 nm, orange = 590–630 nm, and red = 630–700 nm. Percent reflectance in these color bands was calculated by dividing the percentage of reflectance in a color band by the total reflectance in a sample. First-derivative values of the color spectrum, expressed as percent per nanometer and plotted at the midpoint of the 10 nm calculation interval, are more amenable to interpretation than the untransformed reflectance spectra. Peak heights in first-derivative curves can represent a variety of minerals, specifically iron oxides (Deaton and Balsam, Reference Deaton and Balsam1991). Hematite has a peak at 565–575 nm, and goethite has two first-derivative peaks, one at 525–535 nm and the other at 435 nm (Deaton and Balsam, Reference Deaton and Balsam1991). The hematite and goethite concentrations in the studied samples are calculated from peak heights centered at 565 and 435 nm for hematite and goethite, respectively.
Magnetic analyses
Low-frequency susceptibility (χlf) and frequency-dependent susceptibility (χfd%) of all 826 samples were determined from measurements at frequencies of 505 and 5050 Hz in a 400 A/m field using a Magnon VFSM susceptibility bridge. The χfd% is expressed as χfd (%) = [(χlf – χhf)/χlf] ×100, where χlf is the low-field magnetic susceptibility and χhf is the high-field magnetic susceptibility. In addition, 22 samples were selected from modern soil, paleosols, and loessic C horizons (hereafter LCH), which correspond to the highest and lowest χlf values of each loess unit, respectively, for isothermal remanent magnetization (IRM), susceptibility of anhysteretic remanent magnetization (χARM), and temperature-dependent low-field susceptibility (χ-T) measurements.
The ARM imparted in a peak alternating field of 100 mT with a superimposed static bias field of 100 μT is magnetic concentration dependent and also grain-size dependent and particularly sensitive to grains with stable single domain (SD) behavior. ARM was induced using a Magnon AFD 300 demagnetizer, and χARM was calculated by dividing mass-normalized ARM values by the bias field applied during ARM acquisition. The IRM was acquired stepwise from 0 to 2.75 T, backfield IRMs were then imparted stepwise from 0 to 300 mT, employing a Magnon PM II pulse magnetizer and 2-G Enterprises Model 760 cryogenic magnetometer for measurements. The “saturation” IRM (SIRM) is here defined as the IRM value measured at the 2.75 T step, even though samples were not completely saturated.
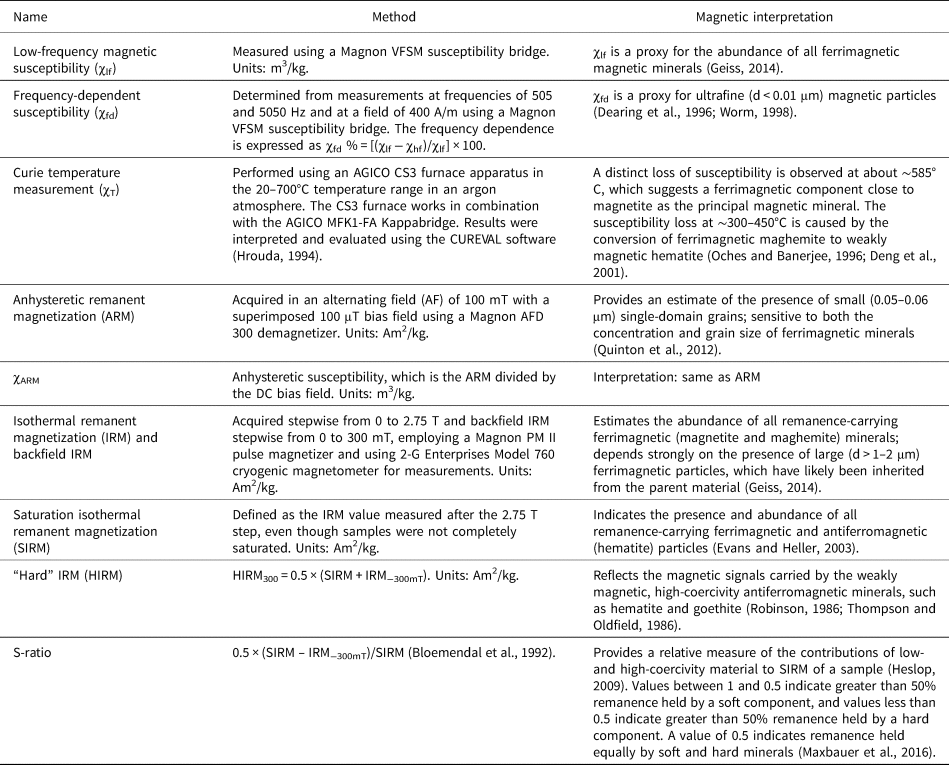
The χ-T measurements were carried out using a MFK1-FA Kappabridge system in combination with an AGICO CS3 furnace (Advanced Geoscience Instruments, Brno, Czech Republic) in the 20–700°C temperature range in an argon atmosphere to minimize oxidation. Results of temperature experiments were interpreted and evaluated using the software package CUREVAL (Hrouda, Reference Hrouda1994). The magnetic parameters, methods, and magnetic interpretation used in this study are listed in Table 1. All magnetic measurements were made at the Grubenhagen rock magnetic laboratory of the Leibniz Institute for Applied Geophysics (LIAG) in Hanover, Germany.
Magnetic parameters used in this study.

Granulometric analysis
Particle-size distributions were determined for the same samples analyzed for ARM, IRM, and χ-T measurements by means of laser diffractometry using a Beckman-Coulter LS 13320 PIDS (Beuselinck et al., Reference Beuselinck, Govers, Poesen, Degraer and Froyen1998; Machalett et al., Reference Machalett, Oches, Zӧller, Hambach, Mavlyanova and Markovic2008). We followed the standard sample protocol of Machalett et al. (Reference Machalett, Oches, Zӧller, Hambach, Mavlyanova and Markovic2008), using the Fraunhofer theory for evaluating grain-size spectra without removing organic matter and carbonates from samples before the particle-size measurements. The samples were pretreated for at least 12 h in overhead tube rotators in a 1% ammonium hydroxide solution for particle disaggregation and dispersion before analysis. This method yields lower clay content than the pipette analyses, owing to a different measuring principle (Beuselinck et al., Reference Beuselinck, Govers, Poesen, Degraer and Froyen1998). We therefore chose the sum of particles with sizes <5.5 μm in diameter to estimate the clay percentage. The 5.5 μm diameter was also applied to the grain-size data set of the Toshan loess–paleosol section (Vlaminck et al., Reference Vlaminck, Kehl, Lauer, Shahriari, Sharifi, Eckmeier, Lehndorff, Khormali and Frechen2016, 2018) in the NFAM for comparison with our results.
Radiocarbon dating
One radiocarbon age was determined using charcoal pieces from the Cky2 horizon (~10.3 m) of loess unit (LU) 2. Pretreatment involved standard acid–alkali–acid extraction; isotope measurements were conducted in the Cologne accelerator mass spectrometry lab facilities, Germany (for full preparation method, see Rethemeyer et al. [Reference Rethemeyer, Fülöp, Höfle, Wacker, Heinze, Hajdas, Patt, König, Stapper and Dewald2013]). Conventional radiocarbon ages were calibrated using OxCal v. 4.3.2 (Ramsey, Reference Ramsey2017) and the IntCal13 calibration curve (Reimer et al., Reference Reimer, Bard, Bayliss, Beck, Blackwell, Ramsey and Buck2013). Calibrated ages are reported as age ranges at the 2-sigma confidence level (95.4%).
Luminescence dating
Luminescence dating was applied to seven samples (Table 2) from the Bw horizon of LU 1 (0.4 m), the Cy horizon of LU 1 (1.8 m), the Cy1 horizon of LU 2 (4.2 m), the Cky2 horizon of LU 2 (8.5 and 10.5 m), the Ckyz horizon of LU 4 (21.5 m), and the C1 horizon of LU 7 (28.3 m). All measurements were conducted in the luminescence laboratory at LIAG, Hanover, Germany. The luminescence samples were collected from the LCH using light-tight plastic and steel tubes. Further material was taken from the surrounding sediment for gamma spectrometry to determine uranium, thorium, and potassium (40K) concentrations. Nuclide concentrations were measured with a high-purity germanium type-N detector. The average dose rate of the loess units is 3.4 Gy/ka, values range from 3.34 ± 0.22 Gy/ka to 3.54 ± 0.22 Gy/ka. Dose-recovery tests were conducted. Six aliquots of each sample were bleached under a solar lamp for 5 h. After the signal was reset, the remaining dose was measured for three aliquots using the pIRIR225 protocol. For the other three aliquots, a well-known dose close to the expected natural dose was given. This dose was then treated as unknown, and we then tried to recover this dose. Anomalous fading was also measured after irradiating a similar dose to the equivalent dose (De) for each sample using three to four aliquots per sample. The De value, dose-recovery ratio, and fading rate were calculated for pIRIR225 signals. The mean measured dose residual value was then subtracted from the recovered doses, the ratio of (subtracted) measured dose/given dose was used as a quality check for the pIRIR225 protocol (Kehl et al., Reference Kehl, Vlaminck, Köhler, Laag, Rolf, Tsukamoto, Frechen, Sumita, Schmincke and Khormali2021), and g-values were determined following the procedure of Huntley and Lamothe (Reference Huntley and Lamothe2001).
Gamma spectroscopy and luminescence dating results.a

a Abbreviations: DR, dose rate; De, equivalent dose; (un)corr., (un)corrected.
b Huntley and Lamothe (Reference Huntley and Lamothe2001).
RESULTS AND DISCUSSION
Stratigraphy and age control of the Chenarli profile
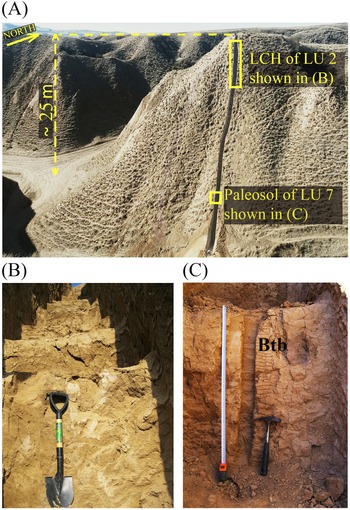
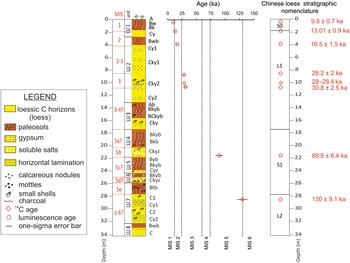
The Chenarli section is a 34-m-thick loess–paleosol sequence exposed in a stepped profile of an artificial trench dug down to in situ loess deposits along a steeply inclined northwest-facing slope (Fig. 2A). The section contains eight loess units separated by paleosols (see Fig. 3 for stratigraphy). The loess units at Chenarli are correlated tentatively to Marine Isotope Stages (Martinson et al., Reference Martinson, Pisias, Hays, Imbrie, Moore and Shackleton1987), and are ordered from oldest (LU 8) to youngest (LU 1) (Fig. 3). The eight loess units at Chenarli are defined based on the International Stratigraphic Guide (Salvador, Reference Salvador1994), in which loesses are stratigraphic units but soils and paleosols are not. Soils and paleosols developed within predeposited loess stratigraphic units and mark the boundaries between loess stratigraphic units.
The studied section at Chenarli with yellow boxes indicating locations of the loessic C horizons (LCH) in loess unit (LU) 2 and paleosol of LU 7. Close-up view of (B) the LCH of LU 2 and (C) Btb horizon of LU7 in A. Photographs by A. Ghafarpour.

Stratigraphic section at Chenarli, with bedding characteristics, buried soils (paleosols) with recognized horizons, and radiocarbon and luminescence ages (see Table 2 for details). The sequence was divided into a suite of sedimentary units (see text). In the stratigraphic column, A, B, and C represent the master soil horizons within loess units (Soil Survey Staff, 2014). Lowercase letters are used as suffixes to designate specific subordinate distinctions within horizons. The suffix symbol meanings are as follows: b, buried genetic horizon; k, accumulation of secondary carbonates; t, accumulation of silicate clay; w, development of color or structure; y, accumulation of gypsum; z, accumulation of soluble salts (Soil Survey Staff, 2014). Marine Isotope Stage (MIS) ages are adopted from Martinson et al. (Reference Martinson, Pisias, Hays, Imbrie, Moore and Shackleton1987). A tentative comparison with Chinese loess stratigraphic nomenclature (Kukla and An, Reference Kukla and An1989) is also shown (right-hand side).

The loess record at Chenarli extends from >130 ± 9.1 ka to the Early Holocene. The uppermost LU 1 yielded a luminescence age of 9.8 ka ± 0.7 (CHE-3858; Table 2) and hosts the modern soil that formed under steppe-like vegetation. The modern soil is a 2-m-thick, A-Bw-Bk-Cy profile and is classified as a haploxerept in the USDA soil taxonomic system (Soil Survey Staff, 2014). We note that the degree of modern soil development was surprising to us in view of the absence of calcic horizons, which modern soils typically have in the study area (Sharifigarmdareh et al., Reference Sharifigarmdareh, Khormali, Scheidt, Rolf, Kehl and Frechen2020). Calcic horizons in the modern soil may be lacking because of episodic erosion in the relatively unstable loess hillslopes. Feldspar grains yielded an age of 13.01 ± 0.9 ka for the Cy horizon of LU 1 (Table 2). Hence, loess deposition in LU 1 has intensified, probably coinciding with the onset of the Younger Dryas event.
LU 2 (Fig. 2B) is ~9 m thick, and consists of largely pedogenically unaltered eolian deposits including calcium carbonate, gypsum, and soluble salts (Fig. 3). The upper contact of LU 2 is demarcated by a weakly developed paleosol (Bwb). A luminescence sample from 20 cm below this paleosol, 4.2 m below the surface, produced an age estimate of 16.5 ± 1.5 ka (Table 2). Therefore, this weakly developed paleosol in LU 2 probably formed during the Bølling-Allerød interstadial and may have been coeval with the last transgression of the Caspian Sea (Khvalynian highstand), beginning at ~16 ka (Chepalyga, Reference Chepalyga, Yanko-Hombach, Gilbert, Panin and Dolukhanov2007). Some mollusk shells and centimeter-scale charcoal pieces are present 9–10.5 m below the surface (Fig. 3). A 4.5-m-thick loess accumulation (Cy1 and Cky1 horizons) in LU 2 appears coeval with the last glacial maximum (LGM; defined as the period ~26–19 ka in Clark et al. [2009]). Feldspar grains from the Cky2 horizon of LU 2, at 8.5 and 10.5 m, returned luminescence ages of 28.2 ± 2.0 ka and 30.8 ± 2.5 ka, respectively (Fig. 3, Table 2). These ages are consistent with a radiocarbon age of 29–28.4 cal ka BP (COL5898.1.1) obtained on a piece of charcoal found in this horizon at a depth of ~10.3 m (Fig. 3). Together, these ages from LU 2 point to a relatively long period of loess deposition spanning between ca. 30.8 ka and 16.5 ka. The Cy2 horizon occurs in the lower part of LU 2, which indicates ~2.5 m of loess accumulation before 30.8 ± 2.5 ka. (Fig. 3).
LU 3 ranges from ~13 to 17.5 m below the surface. At the top of this unit, a 5- to 7-cm-thick weak Ab horizon is present. The upper 2 m of LU 3 represents a pedogenically altered, dark-brown soil with secondary gypsum and calcium carbonate (Bkyb and BCkyb horizons). Small mollusk shells are present in the paleosol and Cky horizon of LU 3 (Fig. 3). The underlying LU 4 comprises the Bkyb, Bkb, and Ckyz horizons, including carbonate nodules and mollusk shells. Soluble salts are present in the lower 1.7 m (Ckyz) of this unit. Luminescence dating from the Ckyz horizon of LU 4 yielded an age of 89.6 ± 6.4 ka (Table 2), which correlates well with MIS 5b, and therefore we infer that the paleosol of LU 4 probably formed during MIS 5a (Fig. 3).
The upper parts of LU 5 and LU 6 are pedogenically altered (Byb and Bkyb horizons), while the Cyz horizon of the LU 5 and Ckyz horizon of LU 6 reflect eolian depositional phases, and contain small mollusk shells (Fig. 3). The uppermost 1.8 m of LU 7 (Fig. 2C) is a well-developed paleosol (Btb horizon) that has visibly clear signs of clay lessivage and Fe mottles. The upper 0.7 m of this Btb horizon lies at a depth of ~26.2 m below the surface and contains pieces of charcoal and small mollusk shells. The age of the upper C1 horizon of LU 7, immediately below the Btb horizon, at a depth of about 28.3 m, is 130 ± 9.1 ka (Fig. 3, Table 2). Therefore, periods of pedogenesis between ca. 89.6 ± 6.4 and 130 ± 9.1 ka in LU 5-7 probably date to MIS 5c and 5e (Fig. 3). The basal ~4 m of this unit has millimeter-scale horizontal laminations. The lowermost LU 8 is moderately sorted with diffuse millimeter- to centimeter-scale horizontal laminations. The upper contact of LU 8 is demarcated by a weakly developed paleosol (Bwb; see Fig. 3).
In combination the stratigraphic record and luminescence ages provide a tentative chronologically constrained depositional record at Chenarli. Comparison with other loess–paleosol sequences in northern Iran (see Fig. 9 in “Periods of Loess Deposition and Pedogenesis from MIS 5d to the Holocene”) sheds further light on the paleoclimatic history of the northern Iranian loess records.
Diachronic change in iron oxides and implications for magnetic susceptibility enhancement
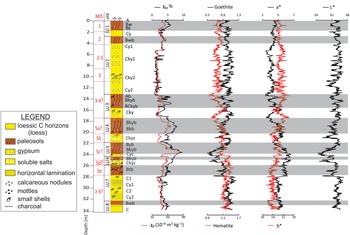
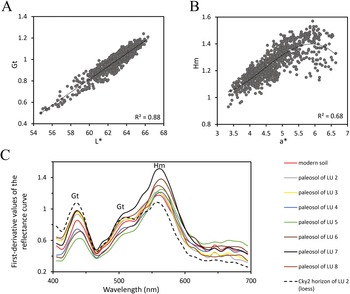
L* values vary between 54.7 and 66.3, and maxima in L* values are observed in the LCH of the studied sequence, while the modern soil and paleosols have the lowest values (Fig. 4). Determination of soil color yields b* values of 10.74–15.33 (Fig. 4). The b* values have similar trends to the L* values, although b* values do not contrast strongly between paleosols and LCH, probably because of accumulation of carbonate, gypsum, and soluble salts in the paleosols. In marked contrast, a* values, which range from 3.34 to 6.64, are noticeably higher in the modern soil and paleosols than in LCH (Fig. 4). The DRS goethite peak at 435 nm correlates positively with L* values of the studied samples (Fig. 5A), while a* values have a positive correlation with the hematite peak at 565 nm (Fig. 5B).
Stratigraphic variation of low-frequency susceptibility (χlf), frequency-dependent susceptibility (χfd%), goethite, hematite, a*, b*, and L*values. Gray bars mark the modern soil and paleosols within the loess units.

Scatter plots of (A) first-derivative values of the 435 nm goethite peak vs. L* values, (B) first-derivative values of the 565 nm hematite peak vs. a* values, (C) first-derivative values of the reflectance curve vs. wavelength for the Cky2 horizon of LU 2 (black dashed line) and selected paleosol samples from loess unit (LU) 1 to LU 8. The peaks indicate the presence of Fe (oxyhydr)oxides (Gt, goethite; Hm, hematite) in the samples. The highest first-derivative 565 nm peak height (Hm) is observed in the paleosol of LU 7, while the goethite peak at 435 nm is higher in the Cky2 horizon of LU 2 than in the paleosols (see text). When both hematite and goethite occur, the hematite peak at 565 nm overwhelms the 525–535 nm goethite peak, and goethite tends to increase the area under the hematite peak, causing the shoulder at 525–535 nm (Balsam and Damuth, Reference Balsam, Damuth, Paull, Matsumoto, Wallace and Dillon2000).

The highest L* values (Fig. 4) and goethite content in the Cky2 horizon of LU 2 (Fig. 5C) suggest eolian goethite input during the period of loess accumulation dating to about late MIS 3–MIS 2. In contrast, the paleosols of LU 4-LU 7 have higher a* values (Fig. 4) and hematite concentration compared with those from other paleosols and modern soil (Fig. 5C). Therefore, greater pedogenic hematite formation in LU 4-LU 7 paleosols offers an analog of environmental response to more seasonal wet–dry cycles during MIS 5. Additionally, DRS results indicate a decline in goethite concentration in the modern soil and paleosols compared with LCH, while hematite formation is at its maximum in the modern soil and paleosols (Fig. 4). Therefore, our DRS data suggest lower goethite formation and/or dehydroxylation compared with hematite during burial, but greater pedogenic hematite formation during pedogenesis, coupled with warmer and more seasonal climatic conditions (Jiang et al., Reference Jiang, Liu, Roberts, Dekkers, Barrón, Torrent and Li2022 and references therein). This finding is consistent with previous studies, which suggest that hematite formation reaches its maximum in Mediterranean and subtropical soils with extended dry seasons (Cornell and Schwertmann, Reference Cornell and Schwertmann2003; Maxbauer et al., Reference Maxbauer, Feinberg and Fox2016). In addition, at least in part, hematite formation in the modern soil and paleosols may be the result of seasonal moisture in the study area that links pedogenic hematite formation with local MAP, potential evapotranspiration, and the soil moisture budget. We note that with our DRS data it is not possible to discriminate pedogenic hematite from eolian hematite input in the modern soil and paleosols. Hence, the possibility of eolian hematite must be considered when interpreting results for the paleosols.
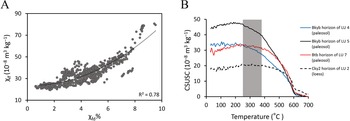
Stratigraphic variations of χlf and χfd% are shown in Figure 4. χlf in LCH ranges between 19.4 and 31 × 10−8 m3/kg and χfd% varies between 0.6% and 3.5%. The modern soil and paleosols have higher χlf and χfd% than LCH. In addition, positive correlation between χlf and χfd% (R 2 = 0.78; Fig. 6A) and elevated χlf and χfd% values point to an increased superparamagnetic (SP) fraction due to pedogenesis in paleosols. Higher a* values in the modern soil and paleosols compared with LCH are accompanied by high χlf and χfd% values (Fig. 4). However, in the Btb horizon of LU 7, χlf and χfd% are significantly reduced when a* values are high (Fig. 4). Therefore, compared with χlf and χfd%, the a* value might be a more reliable paleoclimatic indicator (Hu et al., Reference Hu, Du, Guan, Xue and Zhang2014) in the loess–paleosol sequences of the NILP and NFAM (Ghafarpour et al., Reference Ghafarpour, Khormali, Balsam, Forman, Cheng and Song2021a). We also ascribe the increased hematite content and χfd% values in the modern soil and paleosols (Fig. 4) to the fact that in well-developed soils and paleosols, magnetic enhancement is due to the transformation of weakly magnetic, Fe-rich phases into strongly ferrimagnetic particles and also hematite and goethite. Increased χfd% and hematite content were also observed in the modern soil and paleosols of the Mobarakabad section (Ghafarpour et al., Reference Ghafarpour, Khormali, Balsam, Forman, Cheng and Song2021a). Therefore, we postulate that pedogenic magnetite/maghemite and hematite formation in the paleosols of NILP and NFAM was almost certainly governed by similar climatic conditions, with alternating wet−dry cycles (Maher et al., Reference Maher, MengYu, Roberts and Wintle2003; Orgeira et al., Reference Orgeira, Egli, Compagnucci, Petrovsky, Ivers, Harinarayana and Herrero-Bervera2011), which are consistent with the current Mediterranean climate in the area. This implies that the local hydroclimate must be considered when interpreting soil hematite contents.
(A) χlf vs. χfd% of the studied samples and (B) the magnetic susceptibility (CSUS) heating curves from the Cky2 horizon of loess unit (LU) 2, the Bkyb horizons of LU 4 and LU 5, and the Btb horizon of LU 7 at Chenarli. The gray bar highlights a gradual susceptibility decrease starting from ~280–400°C during heating of the buried horizon samples in LU 4, LU 5, and LU 7, which indicates the conversion of ferrimagnetic maghemite to weakly magnetic hematite, even though the shallower slope of susceptibility loss at ~300°C in the Btb horizon of LU 7 could be due to only a smaller amount of maghemite. The χ-T curves of samples from the Cky2 horizon of LU 2 suggest the absence of pedogenic magnetite/maghemite (see text).

Magnetic enhancement/dissolution mechanisms in loess units
The χ-T curves of representative samples from Cky2 horizon of LU 2 and paleosols (Bkyb horizons of LU 4 and LU 5, and Btb horizon of LU 7) of the Chenarli section are shown in Figure 6B. They suggest the existence of hematite with Néel temperature of 675°C in both the LCH and paleosols. Noticeable humps at ~280–400°C in Bky(b) horizons of modern soil and paleosols are caused by the conversion of ferrimagnetic maghemite to weakly magnetic hematite (Sun et al., Reference Sun, Banerjee and Hunt1995; Oches and Banerjee, Reference Oches and Banerjee1996; Deng et al., Reference Deng, Zhu, Jackson, Verosub and Singer2001). However, the distinctly shallower slope of susceptibility loss at about 300°C in the Btb horizon of LU 7 may be due to a small amount of maghemite (Fig. 6B). A χ-T heating curve for the Cky2 horizon of LU 2 suggests an absence of pedogenic magnetite/maghemite (Fig. 6B).
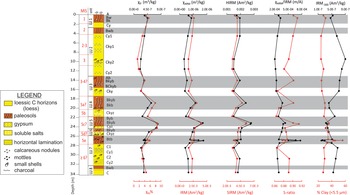
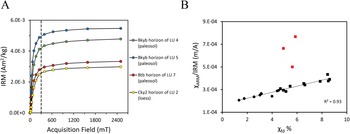
χARM (0.34 to 1.74 × 10⁻⁶ m3/kg) and IRM (1.62 to 4.02 × 10⁻³ Am2/kg) have higher values in paleosols than in LCH (Fig. 7). Variations of IRM at a backfield of 300 mT (IRM−300 mT) and SIRM of selected samples are summarized in Figure 7. The measured IRM acquisition curves undergo a major increase below 300 mT (Fig. 8A), which supports the interpretation of a dominant contribution from magnetite and maghemite. The slight increase between 300 and 2500 mT is consistent with the presence of hematite (Fig. 8A). ARM generally represents fine SD grains (Geiss, et al., Reference Geiss, Egli and Zanner2008), and therefore the increase in χfd% and χARM values in the paleosols (Fig. 7) indicates that the magnetically enhanced horizons contain mixtures of (ultra)fine ferrimagnetic particles and SD grains. The magnetic grain size–dependent ratio χARM/IRM of samples ranges from 2.06 × 10⁻⁴ m/A in LCH to 7.67 × 10⁻⁴ m/A in the modern soil and paleosols (Fig. 7). Also, a strong correlation (R 2 = 0.93) exists between χARM/IRM and χfd%, with the exception of samples from the Btb horizon of LU 7 (Fig. 8B). χARM/IRM is used to estimate the relative abundance of small and stable SD particles (Geiss and Zanner, Reference Geiss and Zanner2006). The magnetic grain-size distribution of the LCH is characterized by the lowest percentage of fine SP and SD particles and highest fraction of coarse-grained particles, as indicated by minima in χfd% and χARM/IRM (Fig. 7). Therefore, higher χARM/IRM values and χfd% in the modern soil and paleosols than in LCH (Fig. 8B) suggest that in situ production of such magnetic particles causes magnetic enhancement of the modern soil and paleosols. In addition, strong correlation between χARM/IRM and χfd% (Fig. 8B) suggests a single consistent magnetic enhancement mechanism in the modern soil and paleosols, that is, addition of fine magnetic particles. However, samples from the Btb horizon of LU 7 follow a different pattern (red in Fig. 8B).
Stratigraphic column with magnetic properties and clay content of modern soil loessic C horizons (LCH) and paleosol samples in the Chenarli section. Gray bars mark the modern soil and paleosols within the loess units. χARM, susceptibility of anhysteretic remanent magnetization; IRM, isothermal remanent magnetization; SIRM, “saturation” IRM; HIRM, “hard” IRM.

(A) Isothermal remanent magnetization (IRM) acquisition curves for selected samples from Chenarli (same samples as in Fig. 6B). The dashed vertical line at 300 mT is shown to aid distinction between low- and high-coercivity portions of the IRM acquisition curves. (B) The ratio of the susceptibility of anhysteretic remanent magnetization (χARM) to IRM vs. χfd% of the studied samples. With increasing pedogenesis from loessic C horizons (black circles) to paleosols (black squares), both χfd% and χARM/IRM increase. Higher χARM/IRM values indicate a greater abundance of single-domain magnetic particles and higher χfd% suggests an increase in ultrafine magnetic particles. There is a noticeable anomaly in the samples from the Btb horizon of LU 7 (red squares).

The granulometric properties indicate clay (<5.5 μm) proportions between 24.2% and 55.9%, with higher values in the modern soil and paleosols than in LCH (Fig. 7). The well-developed Btb horizon of LU 7 has the highest clay content (~38% to 56%). High χARM/IRM values combined with a large clay fraction in the modern soil and paleosols (Fig. 7) indicate that finer SD ferrimagnetic particles are relatively concentrated in clay fractions, which is associated mostly with pedogenesis. Accordingly, high χARM/IRM but low values of χfd% and χlf in the Btb horizon of LU 7 indicate a dominance of SD particles over SP particles, possibly because of the grain size–dependent vertical migration of smaller SP grains downward and to washing out of SP grains from this horizon. This would require high χfd% values below this horizon, which is not the case. In addition, it is unlikely that the increased SD magnetite fraction resulted from an increased detrital input, because the high clay content in the Btb horizon of LU 7 does not suggest coarser sediments and increased detrital input.
Another explanation for low χlf and χfd% values in the Btb horizons of LU 7, which probably formed during MIS 5e, could be high amounts of paramagnetic clays (Geiss and Zanner, Reference Geiss and Zanner2007). However, previous studies indicate that in the loessic modern soils of northern Iran, increasing clay content corresponds to both χlf and χfd% increases, although clays are weakly magnetic (Pourmasoumi et al., Reference Pourmasoumi, Khormali, Ayoubi, Kehl and Kiani2019; Sharifigarmdareh et al., Reference Sharifigarmdareh, Khormali, Scheidt, Rolf, Kehl and Frechen2020). In addition, high χlf and χfd% values are observed in the Btb horizons of loess–paleosol sequences of northern Iran (Ghafarpour et al., Reference Ghafarpour, Khormali, Balsam, Karimi and Ayoubi2016; Vlaminck et al., Reference Vlaminck, Kehl, Rolf, Franz, Lauer, Lehndorff, Frechen and Khormali2018). This apparent contradiction may be because chlorite represents one of the dominant detrital clay minerals in the LCH of northern Iran (Khormali and Kehl, Reference Khormali and Kehl2011; Ghafarpour et al., Reference Ghafarpour, Khormali, Balsam, Karimi and Ayoubi2016). It is susceptible to weathering and provides free Fe for secondary ferrimagnetic mineral formation (e.g., Spassov et al., Reference Spassov, Heller, Kretzschmar, Evans, Yue and Nourgaliev2003; Torrent et al., Reference Torrent, Liu, Bloemendal and Barrón2007; Peng et al., Reference Peng, Hao, Oldfield and Guo2014). Therefore, magnetic mineral concentration through lessivage, removal of carbonates (Singer et al., Reference Singer, Verosub, Fine and TenPas1996), and chlorite weathering (He et al., Reference He, Liu, Chen, Sheng, Ji and Chen2018; Hyodo et al., Reference Hyodo, Sano, Matsumoto, Seto, Bradák, Suzuki, Fukuda, Shi and Yang2020; Ye et al., Reference Ye, Yang, Fang, Zan, Tan and Yang2020) are likely in these Bt(b) horizons. This might explain why high χlf and χfd% are observed in the Bt(b) horizons of loess–paleosol sequences in northern Iran. A more likely explanation for the high χARM/IRM ratio but low χfd% and χlf values in the Btb horizon of LU 7, and the one that is preferred here, is the selective dissolution of SP particles in preference to SD under anoxic conditions (see “Last Interglacial (MIS 5e)”).
Grain-size dependence of hematite proxies in the modern soil and paleosols
The “hard” IRM (HIRM) ranges between 1.49 and 2.78 × 10⁻³ Am2/kg and increases systemically with increasing pedogenesis in the modern soil and paleosols (Fig. 7). The S-ratio varies between 0.86 and 0.91, with higher values in the modern soil and paleosols than in the LCH (Fig. 7). Elevated HIRM values and S-ratios in the modern soil and paleosols compared to the LCH indicate an increase in the total high-coercivity mineral content, coincident with a relative increase in low-coercivity minerals (Fig. 7). Also, DRS data suggest higher hematite content in the modern soil and paleosols compared with the LCH (Figs. 4 and 5C). Therefore, increasing HIRM values in the modern soil and paleosols are interpreted to represent higher contributions of hard hematite to remanence and/or relatively rapid oxidation of pedogenic magnetite and maghemite to hematite (and possibly goethite). Lower S-ratio values in the LCH of LU 3-7 compared with LCH of LU 2 (Fig. 7) suggest the additional presence of high-coercivity minerals such as hematite or goethite during MIS 2–MIS 3 loess accumulation in LU 2. High S-ratio values (>0.88) in the modern soil and paleosols compared with LCH indicate that the pedogenically produced magnetic signal is caused predominantly by magnetite or maghemite.
Quinton et al. (Reference Quinton, Dahms and Geiss2012) suggested that S-ratio changes represent relative changes in hematite abundance, while HIRM changes might also be indicative of shifts in coercivity of other minerals (Liu et al., Reference Liu, Roberts, Torrent, Horng and Larrasoaña2007). The S-ratio will underestimate the relative hematite fraction and HIRM will underestimate the absolute hematite concentration (Roberts et al., Reference Roberts, Zhao, Heslop, Abrajevitch, Chen, Hu, Jiang, Liu and Pillans2020). In the paleosol (Btb horizon) of LU 7, both HIRM and S-ratio are low, in contrast to the modern soil and other paleosols (Fig. 7). In addition, DRS has the highest hematite peak at 565 nm in the paleosol of LU 7 compared to the modern soil and other paleosols (Fig. 5C). However, the low HIRM in the Btb horizon of LU 7 suggests that the magnetization in this paleosol is not considerably impacted by hematite or goethite. Hence, the most plausible explanation for the low S-ratio and HIRM values but high hematite peak at 565 nm in this paleosol is that very fine-grained SP hematite is undetected by HIRM because these grains do not hold a stable remanence. However, SP hematite contributes to the DRS signal. It is also possible that strong weathering coupled with short-term reducing conditions during MIS 5e favored SP particle depletion (reflected in low χfd% values), and promoted transformation of SD magnetite/maghemite particles to (SP) hematite (low S-ratio) in the Btb horizon of LU 7, although eolian input of (SP) hematite to the paleosol is possible. Therefore, low HIRM values in the well-developed paleosol of LU 7 compared with the modern soil and other paleosols suggest that HIRM cannot be used alone as a proxy for the absolute concentration of magnetically hard minerals if their coercivity values are unknown (Liu et al., Reference Liu, Roberts, Torrent, Horng and Larrasoaña2007; Quinton et al., Reference Quinton, Dahms and Geiss2012). Furthermore, the degree of Al-substitution may influence the HIRM of high-coercivity minerals (Liu et al., Reference Liu, Roberts, Torrent, Horng and Larrasoaña2007), a factor that cannot be evaluated with our data set.
Paleoenvironmental and paleoclimatological implications
Last interglacial (MIS 5e)
As discussed in “Stratigraphy and Age Control of the Chenarli Profile,” the well-developed paleosol (Btb horizon) of LU 7 almost certainly formed during MIS 5e. Occasional charcoal finds in this paleosol provide evidence for burning and might suggest warm and dry months within MIS 5e in the area, comparable with current natural summer fires in the NILP. Furthermore, during dry months, microbial organic matter decomposition increases, soil pH tends to be more alkaline due to evapotranspiration, and the oxygen diffusion rate increases (White et al., Reference White, Blum, Bullen, Vivit, Schulz and Fitzpatrick1999). Hence, under oxic conditions (during dry months) in which evapotranspiration exceeds precipitation, both SP and SD grains form. In contrast, we postulate that dominant rainfall during wet seasons in MIS 5e resulted in carbonate leaching and lower soil pH, with clay accumulation and Fe mottling in the Btb horizon of LU 7. This produced stagnant conditions accompanied by a sharp depletion of dissolved oxygen in which SP particles may dissolve because of their smaller sizes and higher surface area to volume ratio, but SD particles are preserved (Yamazaki et al., Reference Yamazaki, Abdeldayem and Ikehara2003). This may explain why the χfd% of the Btb horizon of LU 7 is low, while χARM/IRM values in this paleosol are high (Fig. 7).
Magnetite dissolution is widespread in gleyed soils (e.g., Dearing et al., Reference Dearing, Hay, Baban, Huddleston, Wellington and Loveland1996; Maher, Reference Maher1998; Guo et al., Reference Guo, Zhu, Roberts and Florindo2001; Chlachula, Reference Chlachula2003; Blundell et al., Reference Blundell, Dearing, Boyle and Hannam2009; Roberts, Reference Roberts2015) and has also been observed in the strongly developed paleosols with Btb horizons that formed in MIS 5e at Mobarakabad, Toshan, and Neka-Abelou in the NFAM. These MIS 5e paleosols have lower magnetic susceptibilities (χlf and χfd%) than the overlying paleosols (Ghafarpour et al., Reference Ghafarpour, Khormali, Balsam, Karimi and Ayoubi2016; Vlaminck et al., Reference Vlaminck, Kehl, Rolf, Franz, Lauer, Lehndorff, Frechen and Khormali2018; Kehl et al., Reference Kehl, Vlaminck, Köhler, Laag, Rolf, Tsukamoto, Frechen, Sumita, Schmincke and Khormali2021). Magnetic depletion is also observed in the Btb horizon of the MIS 5e paleosol of loess–paleosol sequences in the Czech Republic in which coarse-grained ferrimagnets were preserved, while pedogenic conditions were not favorable for the production and/or preservation of fine and ultrafine magnetic grains (Oches and Banerjee, Reference Oches and Banerjee1996). Such a lack of correlation between χlf and degree of pedogenesis and paleoprecipitation has also been observed in magnetically depleted paleosols of Chinese loess deposits (e.g., Guo et al., Reference Guo, Zhu, Roberts and Florindo2001; Han et al., Reference Han, Liu, Zhao, Zhang, Lü and Chen2020). Considering the fact that precipitation patterns in the Czech Republic and China are distinctly different from those of northern Iran, we hypothesize that the magnetic depletion in these paleosols was controlled mainly by intense pedogenesis under excessive soil moisture conditions that changed soil redox conditions, rather than rainfall seasonality.
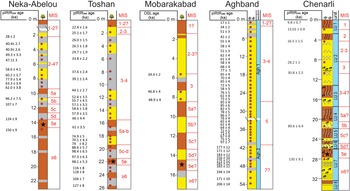
The absence of a well-developed MIS 5e paleosol with Btb horizon at the Aghband section (Fig. 9) in the northern NILP (Fig. 1) compared with Neka-Abelou, Toshan, Mobarakabad, and Chenarli is consistent with the pronounced modern north–south gradient from (semi)arid to subhumid climates. This supports the idea that similar climatic gradients may have existed during paleosol formation in the NFAM and NILP (Khormali and Kehl, Reference Khormali and Kehl2011; Khormali et al., Reference Khormali, Shahriari, Ghafarpour, Kehl, Lehndorff and Frechen2020; Kehl et al., Reference Kehl, Vlaminck, Köhler, Laag, Rolf, Tsukamoto, Frechen, Sumita, Schmincke and Khormali2021). However, during MIS 5e, the eastern NILP experienced more humid conditions than in the Holocene, which is reflected in formation of a well-developed Btb horizon in LU 7 at Chenarli compared with weakly developed Bw and Bk horizons of the modern soil in LU 1.
Comparison between the stratigraphy of the Chenarli section with simplified stratigraphic sections of loess–paleosol sequences at Neka-Abelou (36°38′43″N, 53°19′15″E, 105 m asl), Toshan (36°49′01″N, 54°25′25″E, 145 m asl), Mobarakabad (37°09′32″N, 55°18′14″E, 310 m asl), and Aghband (37°37′06″N, E 55°09′27″, 183 m asl) in northern Iran (for locations of sections, see Fig. 1). Loess horizons in the simplified stratigraphic sections of Neka-Abelou, Toshan, Mobarakabad, and Aghband are shown in yellow, weakly developed paleosols (Bwb, BCb, CBb, horizons) in gray, and well-developed paleosols (Bkb, Btb, Btkb, and Btgb horizons) in brown. See Fig. 3 for bedding characteristics and symbol legend of the Chenarli section. Marine Isotope Stage (MIS) ages are adopted from Martinson et al. (Reference Martinson, Pisias, Hays, Imbrie, Moore and Shackleton1987). Stars indicate paleosols that probably formed during MIS 5e in which magnetic depletion occurred. Source data are from Kehl et al. (Reference Kehl, Vlaminck, Köhler, Laag, Rolf, Tsukamoto, Frechen, Sumita, Schmincke and Khormali2021) for Neka-Abelou, Vlaminck et al. (Reference Vlaminck, Kehl, Rolf, Franz, Lauer, Lehndorff, Frechen and Khormali2018) for Toshan, Ghafarpour et al. (Reference Ghafarpour, Khormali and Forman2017) for Mobarakabad, and Lauer et al. (Reference Lauer, Vlaminck, Frechen, Rolf, Kehl, Sharifi, Lehndorff and Khormali2017b) for Aghband.

Periods of loess deposition and pedogenesis from MIS 5d to the Holocene
The presence of gypsum and soluble salts in the Ckyz horizon of LU 4 indicates that gypsum and soluble salts were not leached after deposition, which suggests that loess accumulated under dry climates during MIS 5b (Fig. 3). Similarly, LCH of LU 5 and LU 6 are characterized by salt and gypsum accumulation and preservation. The gypsum presence in the LCH of all loess units was probably sourced from the nearby Kopet Dagh marly structures (Karimi et al., Reference Karimi, Khademi, Kehl and Jalalian2009; Lauer et al., Reference Lauer, Vlaminck, Frechen, Rolf, Kehl, Sharifi, Lehndorff and Khormali2017b). The sources of soluble salts in the LCH of LU 4–LU 6 may relate to terrestrial sediments enriched by salts during the late Khazarian transgression epoch between 130 and 76 ka (Yanina, Reference Yanina2012; Tudryn et al., Reference Tudryn, Chalié, Lavrushin, Antipov, Spiridonova, Lavrushin, Tucholka and Leroy2013). A further assumption is that non-glacial erosion of nearby tectonically active mountains (Alborz and Kopet Dagh) produced fine silt-sized sediment in the area that was then carried into dry basins by fluvial transport of seasonal rivers (Ghafarpour et al., Reference Ghafarpour, Khormali, Meng and Tazikeh2021b). Under this scenario, further silt-sized particles can be produced by salt weathering in dry basins (Smith et al., Reference Smith, Wright and Whalley2002; Muhs, Reference Muhs and Elias2007), where silts can be deflated easily to become dust that formed the salt-rich LCH (Ckyz and Cyz horizons; see Fig 3) in LU 4 to LU6.
The fact that the paleosols of LU 4 and LU 5 have the highest χlf and χfd% (Fig. 4) may reflect the formation of these paleosols in MIS 5a and 5c, respectively (Fig. 9), in accordance with previous reports of high χlf and χfd% values in MIS 5a and 5c paleosols in northern Iranian loess–paleosol sequences (Vlaminck et al., Reference Vlaminck, Kehl, Rolf, Franz, Lauer, Lehndorff, Frechen and Khormali2018; Kehl et al., Reference Kehl, Vlaminck, Köhler, Laag, Rolf, Tsukamoto, Frechen, Sumita, Schmincke and Khormali2021). Based on this correlation, which is supported by luminescence ages of 89.6 ± 6.4 ka and 130 ± 9.1 ka for samples CHE-3866 and CHE-3870, respectively, the Cky horizon of LU 3 probably started to accumulate with the onset of MIS 4 and the Ckyz horizon of LU 6 may indicate a loess depositional episode during MIS 5d.
The paleosol in LU 3 indicates a period of pedogenesis before ca. 30.8 ± 2.5 ka, probably during early-middle MIS 3 (Fig. 9). The timing of this period of pedogenesis may be comparable with paleosol formation during MIS 3 at Neka-Abelou (~49.3 to 40.4 ka), Toshan (~44.1 to 39.1 ka), and Mobarakabad (~46.8 to 34.4 ka) in the NFAM (Fig. 9) and with loess records from the lower Danube basin (Markovic et al., Reference Markovic, Bokhorst, Vandenberghe, McCoy, Oches, Hambach and Gaudenyi2008; Fitzsimmons et al., Reference Fitzsimmons, Marković and Hambach2012), western central Europe (Fischer et al., Reference Fischer, Hambach, Klasen, Schulte, Zeeden, Steininger, Lehmkuhl, Gerlach and Radtke2019), some Eurasian loess records (e.g., Dodonov et al., Reference Dodonov, Sadchikova, Sedov, Simakova and Zhou2006; Rousseau et al., Reference Rousseau, Boers, Sima, Svensson, Bigler, Lagroix, Taylor and Antoine2017; Hlavatskyi and Bakhmutov, Reference Hlavatskyi and Bakhmutov2021), and the Remizovka loess section in central Asia (Fitzsimmons et al., Reference Fitzsimmons, Sprafke, Zielhofer, Günter, Deom, Sala and Iovita2018). The sequence at Chenarli thus corroborates the notion of multiple loess depositional episodes separated by pedogenesis during MIS 3 in northern Iran.
Deposition of loess (Cy2 horizon of LU 2) on top of the paleosol of LU 3 may have been coeval with loess accumulation between ~40.4 and 28 ka at Neka-Abelou, ~44.1 and 29.7 ka at Toshan, and partially with loess deposition after 34.4 ka in the Mobarakabad and Aghband sections (Fig. 9). The presence of carbonate and gypsum and charcoal pieces (Fig. 3) in the Cky2 horizon of LU 2 (~10.3 m below the surface) provides evidence of dry conditions and a natural fire in the NILP. Luminescence ages of LU 2 confirm that loess deposition continued into the late MIS 2 (16.5 ± 1.5 ka). Therefore, our data and emerging chronologies from other loess records in northern Iran and semiarid central Asian loess sites (cf. the Remizovka and Maibulak sections in Kazakhstan; Fitzsimmons et al., Reference Fitzsimmons, Sprafke, Zielhofer, Günter, Deom, Sala and Iovita2018) indicate that significant loess accumulation took place during middle-late MIS 3.
The LGM loess in LU 2 (Cy1 and Cky1 horizons) at Chenarli correlates well with loess deposition between ~25.1 and 22.4 ka at Toshan. An LGM loess was not detected in the Neka-Abelou, Mobarakabad, and Aghband sections due to the lack of age control, but this period of dust accumulation was detected in previous dating (Frechen et al., Reference Frechen, Kehl, Rolf, Sarvati and Skowronek2009). The LGM depositional phase in Chenarli and Toshan is consistent with dating of loess elsewhere in Eurasia, with peak loess accumulation during the LGM (e.g., Antoine et al., Reference Antoine, Rousseau, Moine, Kunesch, Hatte, Lang, Tissoux and Zöller2009; Stevens et al., Reference Stevens, Adamiec, Bird and Lu2013; Fitzsimmons and Hambach, Reference Fitzsimmons and Hambach2014; Fitzsimmons et al., Reference Fitzsimmons, Sprafke, Zielhofer, Günter, Deom, Sala and Iovita2018), and is also consistent with the widely accepted model for colder, drier climates at this time in central Asia (Ding et al., Reference Ding, Ranov, Yang, Finaev, Han and Wang2002; Vandenberghe et al., Reference Vandenberghe, Renssen, van Huissteden, Nugteren, Konert, Lu, Dodonov and Buylaert2006; Machalett et al., Reference Machalett, Oches, Zӧller, Hambach, Mavlyanova and Markovic2008) and with a clearly defined LGM dust flux peak in the Chinese Loess Plateau (Kang et al., Reference Kang, Roberts, Wang, An and Wang2015). The period of pedogenesis (Bwb horizon of LU 2) during late MIS 2 at Chenarli (Fig. 9) was not observed in the Neka-Abelou, Toshan, Mobarakabad, and Aghband sections because of topographic effects, hillslope soil erosion, and/or insufficient age control in these loess records. In contrast, comparable paleosols are observed in loess–paleosol sequences at Stayky (ca. 16.4 ± 1.6 ka) and Roksolany (R-S1 pedocomplex [Dofinivka interstadial]) in Ukraine (Rousseau et al., Reference Rousseau, Antoine, Gerasimenko, Sima, Fuchs, Hatte, Moine and Zoeller2011; Hlavatskyi and Bakhmutov, Reference Hlavatskyi and Bakhmutov2020), and Nilka and KS15-05 sections in the Ili Basin, central Asia (Yang et al., Reference Yang, Forman, Song, Pierson, Mazzocco, Li, Shi and Fang2014; Wang et al., Reference Wang, Jia, Xia, Liu, Gao, Duan, Wang, Xie and Chen2019).
The loess depositional phase (Cy horizon) in LU 1 may coincide with the Younger Dryas chronozone and is potentially coeval with arid conditions and the spreading of desert and steppe vegetation before 11.5 ka, inferred from pollen analyses of a deep-marine sediment core from the south basin of the Caspian Sea (Leroy et al., Reference Leroy, Kakroodi, Kroonenberg, Lahijani, Alimohammadian and Nigarov2013). Similarly dry conditions with high dust flux and desert vegetation during the Younger Dryas were reported for loess records from Xinjiang, China, and southern Tajikistan (Chen et al., Reference Chen, Jia, Chen, Li, Zhang, Xie, Xia and Huang2016; Yang et al., Reference Yang, Li, Liu, Zan, Liu, Kang, Murodov and Fang2020).
CONCLUSIONS
The loess–paleosol sequence at Chenarli provides detailed insights into Late Quaternary environmental change in northeastern Iran. Positive correlation between the hematite DRS peaks, S-ratios, and χfd% values in the modern soil and paleosols suggest pedogenic formation of several iron minerals, including magnetite, maghemite, and hematite. The NILP during the last interglacial (MIS 5e) experienced higher precipitation than during the Holocene. High χARM/IRM, but low χlf and χfd% values in the well-developed MIS 5e paleosol suggest that SD particles are preserved in preference to SP particles under reducing conditions due to size selectivity, leading to magnetic depletion in this paleosol. The low HIRM values in the well-developed LU 7 paleosol imply that HIRM cannot be interpreted simply in terms of the absolute concentration of magnetically hard minerals. MIS 5b loess deposition at ca. 89.6 ± 6.4 ka is associated with dry conditions, deduced from the presence of carbonate, gypsum, and soluble salts in the Ckyz horizon of LU 4. Comparison of our data with other paleoenvironmental records indicates that the period of pedogenesis in LU 3 may correlate to MIS 3, for which pedogenesis is documented in other northern Iranian, European, and central Asian loess records. Loess accumulation in Chenarli increased overall before ca. 30.8 ± 2.5 ka, peaked during the LGM, and continued until around ca. 16.5 ± 1.5 ka, which may have been coeval with substantially increased loess accumulation between 38 and 18 ka in central Asia.
Acknowledgments
This study is a part of the PhD thesis done at Gorgan University of Agricultural Sciences and Natural Resources, Iran. This work is based upon research funded by the Iran National Science Foundation (INSF) under the project no. 99006758. We thank Kathrin Worm for ARM and IRM measurements and Daniel Maxbauer for helpful discussion. The constructive comments of reviewers Christoph E. Geiss, Dmytro Hlavatskyi, Andrew P. Roberts, and Pengxiang Hu and editors Jaime Urrutia Fucugauchi and Derek Booth on previous versions of the article are highly appreciated.