


INTRODUCTION
Marine phytoplankton is responsible for approximately half of the world's primary production, and by linking ecological and biochemical processes they play an important role in global biogeochemical cycles (Field et al., Reference Field, Behrenfeld, Randerson and Falkowski1998). Marine protists control the biogeochemical cycling of many elements in the ocean. Besides carbon (C), elements like nitrogen (N), phosphorus (P), silicon (Si), iron (Fe), manganese (Mn), nickel (Ni), copper (Cu) and zinc (Zn) are accumulated by phytoplankton in surface waters and exported to depth as sinking biogenic particles (Twining et al., Reference Twining, Baines, Vogt and de Jonge2008). The stoichiometric relation between the most common biological elements, known as the Redfield ratio, has lately been applied to other bioactive elements (Redfield Reference Redfield1934; Twining et al., Reference Twining, Baines, Vogt and de Jonge2008). The ratio may diverge from the Redfield ratio as organisms may have different growth strategies and therefore have different element requirements, owing to external variation in nutrient and light conditions or varying microbial metabolism (Klausmeier et al., Reference Klausmeier, Litchman and Levin2004; Arrigo, Reference Arrigo2005). Ecological stoichiometry provides a framework for linking this variation to species interactions, food web dynamics and nutrient cycling (Sterner & Elser, Reference Sterner and Elser2002). Understanding how these cycles work and affect the ecosystem, and how nutrient stoichiometry is affected by abiotic and biotic factors is important for our knowledge of environmental and global changes.
Elemental analysis can be determined by several different techniques. The most common is CHN analysis where the elements are analysed by combustion. Elements such as P and Si in PM on filters can be analysed chemically (Grasshoff et al., Reference Grasshoff, Ehrhardt and Kremling1983). Inductively coupled plasma mass spectrometry (ICP-MS) is a method that has low detection limits and requires small sample volume (Sansoni, Reference Sansoni1987), but the elements C and N cannot be quantified (Ho et al., Reference Ho, Quigg, Finkel, Milligan, Wyman, Falkowski and Morel2004). Neither are light elements like C and N quantified by flame atomic absorption spectrometry (FAAS) or graphite furnace atomic absorption spectrometry (GFAAS), two of the most widespread analytical techniques for trace element determination (Wu et al., Reference Wu, He, Luo and Hou2009). The trace element composition of suspended PM may also be analysed using energy-dispersive X-ray fluorescence (EDXRF) (Barrett et al., Reference Barrett, Resing, Buck, Buck, Landing and Measures2012). All these methods determine a bulk mean for a measured property. In addition, there are techniques for single cell elemental analysis, such as transmission electron microscope (TEM)–X-ray microanalysis (Fagerbakke et al., Reference Fagerbakke, Heldal and Norland1996), synchrotron radiation X-ray fluorescence (SXRF) used for elements within the range from Cl to Ba (Twining et al., Reference Twining, Baines, Fisher, Maser, Vogt, Jacobsen, Tovar-Sanchez and Sanudo-Wilhelmy2003; Bobrov et al., Reference Bobrov, Phedorin, Leonova and Kolmogorov2005) and laser microprobe mass analyser (LAMMA) (Seydel et al., Reference Seydel, Haas, Rietschel and Lindner1992).
Wavelength dispersive X-ray fluorescence is used for a range of industrial applications because it is an excellent technique in multi-element determination (Bonvin et al., Reference Bonvin, Yellepeddi and Buman2000). It has the advantages of simple sample preparation and fast analysis, it yields reproducible results and has low analysis costs (Garivait et al., Reference Garivait, Quisefit, de Chateaubourg and Malingre1997; Bonvin et al., Reference Bonvin, Yellepeddi and Buman2000). In addition, the fact that the method is non-destructive allows the samples to be reanalysed later, by other techniques (Mahrok & Shamoon, Reference Mahrok and Shamoon2008).
In this study we have tested the application of WDXRF, using a thin layer method, in order to analyse and quantify all the important elements in marine particles harvested on filters. Advantages and disadvantages of different filter types have been evaluated. Detection limits and uncertainty of measurements have been established. A procedure that includes preparation of samples by filtration, choice of filters and establishment of standards has been developed, and tested on samples from natural seawater.
MATERIALS AND METHODS
Instrument
Wavelength dispersive XRF (WDXRF) analysis determines the amounts of elements in a sample through detection of element-characteristic X-rays that are emitted when a sample is irradiated with X-ray photons of sufficient energy. Irradiation typically liberates an inner K-shell electron, the vacancy from which is immediately filled by an outer-shell electron, usually from the L-shell. The surplus energy from this process is emitted as a characteristic X-ray. The X-ray emitted may be identified by a detector, or in some cases may be absorbed by other elements in the sample and re-emitted with lower energy (secondary enhancement).
Currently, WDXRF is used almost exclusively for ‘infinitely thick’ samples, i.e. samples sufficiently thick to completely absorb radiation from the rear of the sample (Garivait et al., Reference Garivait, Quisefit, de Chateaubourg and Malingre1997). Such analyses are widely used for industrial purposes, for example in metallurgy, geology and cement and plastic production. Software and computational models are well-established for such analyses.
A wavelength dispersive sequential spectrometer (Bruker AXS S4 Pioneer, Spectra Plus) was used. The main components of this instrument are a rhodium X-ray tube as emission source, a sample chamber with vacuum seal, collimators and crystal lattices to separate characteristic X-rays, and detectors (scintillation counter and flow counter). The X-ray tubes' voltage and current, collimator and crystal type are optimized to give best signal-to-noise ratio for each element analysed (line mode). The instrument is also equipped with extra crystals for C (OVO-C) and N (OVO-N). It has 30 sample cups with anti-background scattering cups for 47 mm filters. Elements were analysed using a fixed, optimized goniometer setting. Each element was measured until the analytical error due to relative statistical error was lower than 0.3%, but not for longer than 30 s. The settings used for the different elements are given in Table 1. All WDXRF results are based on the intensities (kilocounts per second—kcps), and the analysis time for a sample is ~12 min. The instrument measures total amount of the elements and does not distinguish between different chemical forms.
The values of the instruments settings, obtained for carbon (C), nitrogen (N), silicon (Si), phosphorus (P), calcium (Ca) and iron (Fe).

kV, kilovolts; mA, milliampere; dg, degrees.
In this study, WDXRF is used to measure elemental composition of thin (micrometer range) samples consisting mainly of light elements immobilized on filters. Four considerations unique to thin sample analysis by WDXRF are: the properties of filters may limit element analysis; absorption of X-rays by the sample is limited to light elements (C, N, and O); secondary enhancement can be neglected and there is no need for dead time correction; and count rates are generally below 5 kcps.
WDXRF sample preparation
The following types of filters (47 mm) were used: GF/F (Whatman), polycarbonate membrane filters (Poretics Corp.), Anodisc (Whatman), teflon omnipore membrane filters (Millipore) and SKC silver membrane filters (Poretics corp.) (Table 2). Volumes between 150 ml and 2000 ml were filtered, depending on particle density and filter type. For each new box of filters we analysed four unused filters as blank.
Filter properties (material, pore size and thickness, µm) and filter background counts (kcps) with standard deviation of the mean (N = 4), for polycarbonate (PC), anodisc (ANO), GF/F, teflon (TEF) and silver (SKC).

µm, micrometre; kcps, kilocounts per second; Stdev, standard deviation of the mean.
All filtrations were performed using a borosilicate funnel for 47 mm diameter filters (Millipore mod. C10716) and a vacuum pump operated at −200 mbar pressure. The window of the WDXRF sample holder, where the filter is placed for analysis, has a diameter of 33.8 mm. The glass funnels used for filtration have slightly larger and variable diameter (34.2–36.6 mm). The differences in funnel diameter will introduce a maximum 3% error into our measurements. We measure three or four replicates for each sample.
After filtration a variable amount of ions from the seawater is left on the filter, which is most pronounced for ANO filters. When dried, NaCl crystals are formed on the filters causing absorption of X-ray signal from particles and background, especially for C and N (Figure 1B). We removed excess salt by rinsing with 5 ml reverse osmosis (RO) water after filtration which reduced the amount of Na and Cl by more than 99% on ANO filters. To test whether RO water had a detrimental effect on PM we alternatively rinsed with 5 ml 500 mM solution of lithium fluoride (LiF), neither of which contain elements that may interfere with the elements of interest in the measurements. There were no significant differences between the two rinsing procedures for the elements analysed. After rinsing, the filters were placed on a clean paper to drain off excess water and left to dry and subsequently stored in Petri dishes until analysis.
Images from scanning electron microscope of the different filters used: (A) GF/F; (B) anodisc; (C) polycarbonate; (D) silver; (E) teflon.

Calibration and estimation
The net signal intensity of an element from particles on the filter is calculated as the difference between the total sample filter signal intensity (kcps) and the signal intensity from unused filters as blank. This is valid if the contribution from the filter itself is not reduced by absorption by particles. For samples with particles with low (equivalent to an organism of size 5 µm) mass thickness (mass/area) the internal absorption of X-rays will be small and the net signal will be proportional to the amount on the filter.
Calibration factors for C and N were determined by analysing cultures of Synechococcus sp. and natural samples using a CHN analyser (Flash 2000 NC, ThermoFisher Scientific). In addition, varying thicknesses of C were coated onto GF/F filters using an Agar Turbo Carbon Coater, and measured by WDXRF. This alternative approach is based on the reduction in fluorescence signal from oxygen (present as silicate) due to absorption from C. The mass thickness of C was estimated by applying the mass absorption coefficient of C for O (12.38 cm2 mg−1, table 14.3 in Goldstein et al., Reference Goldstein, Newbury, Echlin, Jo, Romig, Lyman, Fiori and Lifshin1992). For other elements, calibration factors were determined by preparing a solution of known concentration (Na2SiO3 for Si and FeCaCl5 for Ca and Fe) and applying a small volume as a thin layer on a glass or silver plate, which was subsequently analysed by WDXRF (Table 3). For elements like silicate, calcium and iron there will not be any strong absorption, as the materials we collect on filters have an electron density as for biological material, and in addition a particle size which will not interfere with the analysis for the elements is mentioned.
Calibration factors (µg/kcps ± SER) and detection limits (µg/filter) for elements (carbon, nitrogen, silicon, phosphorus, calcium and iron) on different filters (polycarbonate, anodisc, GF/F, teflon and silver).
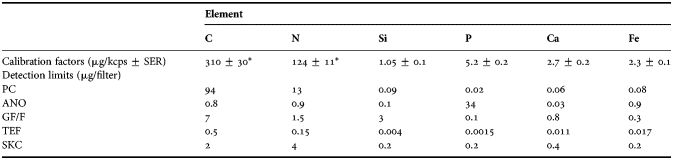
*, from anodisc filter (see Figure 2); µg/kcps, micrograms per kilocounts and second; µg/filter, micrograms per filter; SER, standard error of the regression.
To estimate the amount of an element on a filter of an unknown sample, the net signal from an element is multiplied by its calibration factor, assuming that the internal absorption in the particles is low. Detection limits were calculated as three times the standard deviation of blanks (Table 2). Replicate measurements show that the precision of the method is better than 5% when the sample signal is well above the background signal.
Analysis of natural seawater samples
To measure the elemental composition of PM in seawater using the different filters, samples were taken weekly from March to June 2008, and August 2010 to May 2011, in Raunefjord, close to the Marine Biological Station, Norway (60°16.0′N 005°11.6′E). During 2008, samples for phytoplankton and bacteria were taken in addition, for comparison with WDXRF data. Identification and counts for some of the most common species and genera of diatoms and dinoflagellates were obtained by the sedimentation method of Utermöhl (Reference Utermöhl1931), using inverted light microscopy on samples preserved with pseudo-lugol (Verity et al., Reference Verity, Whipple, Nejstgaard and Alderkamp2007). Biovolume was estimated, and C content calculated for the phytoplankton community using the methods of Menden-Deuer & Lessard (Reference Menden-Deuer and Lessard2000) and Olenina et al. (Reference Olenina, Hajdu, Edler, Andersson, Wasmund, Bruch, Göbel, Gromisz, Huseby, Huttunrn, Jaanis, Kokkonen, Ledaine and Niemkiewicz2006). Autotrophic picoeukaryotes (<2 µm), two populations of nanoeukaryotes (2–5 µm and 6–10 µm), cyanobacteria and heterotrophic bacteria numbers were determined using a FACSCalibur flow cytometer (FCM, Becton Dickinson) (Marie et al., Reference Marie, Brussaard, Partensky and Vaulot1999, Paulino et al., Reference Paulino, Egge and Larsen2008). In addition we show selected data from a mesocosm experiment in Ny Ålesund, Spitsbergen (Thingstad et al., Reference Thingstad, Bellerby, Bratbak, Borsheim, Egge, Heldal, Larsen, Neill, Nejstgaard, Norland, Sandaa, Skjoldal, Tanaka, Thyrhaug and Topper2008).
RESULTS
The success of WDXRF for quantitative element analysis of seawater PM is dependent upon filter properties. Ideally, filters should be composed entirely of elements which are not targeted by analysis. This would ensure a low background signal, which in turn would improve signal-to-noise ratio. Furthermore, there should be a linear relationship between the signal and the amount of the element.
Filter properties
As shown by electron scanning microscope (SEM) examinations and information given by the producers, the filters we use have different properties (Figure 1; Table 2). Membrane filters like anodisc (ANO) and polycarbonate PCTE (PC) have very precise pore sizes and regular pore distribution, while omnipore teflon hydrophilic filters (TEF) and GF/F have a matrix structure. Particularly in GF/F, the matrix is relatively open and particles tend to be trapped at some depth into the filter matrix, causing the X-ray signal from their elements to be absorbed (e.g. Synechococcus sp., Figure 2). This will limit the accuracy of quantitative analysis with these filters. The degree of penetration into the matrix will depend on particle size and is difficult to correct for. Until a more quantitative relationship between particle size distribution and signal is established, we must consider the results from GF/F as semi-quantitative. The PTFE forms a relatively open, anisotropic matrix, which causes these filters to become more elliptical when drying. The non-circular shape of the filters will introduce error into WDXRF measurements, as the area with material on the filter, after drying, does not match the opening of the filter holder.
Calibration of WDXRF for carbon (A) and nitrogen (B) based on CHN measurements. Filled circles refer to Synechococcus sp. cultures filtered on anodisc, and open circles on GF/F. In addition, circles with cross refer to carbon coated GF/F filters.

Detection limits for the C, N, P, Si, Ca and Fe for the different filters are given in Table 3. Filters with high content, i.e. high background values, of elements of current interest will obscure the WDXRF measurement (Table 2). The first problem with high background values is the error introduced by subtracting two high values. The second, and more serious problem, is that a high signal peak from filter background is vulnerable to X-rays absorbed by the particles on the filters (see Discussion). This is the case for C on PC, P on ANO and Si on GF/F. Even though N is not a major constituent of PC filters, this element cannot be precisely measured due to crosstalk from a strong C peak with energy close to that of N. An appropriate filter should have low background counts. GF/F filters have low content of the key biological elements and should therefore be potentially suitable for C, N and P. The ANO filters are suitable for C, N, Si and Ca, but due to their hydrophilic properties, seawater deposits salt as crystals on the filter surface. If not rinsed, these salt crystals will cause absorption of signal from light elements, and also skew the results of other elements as ions in seawater are retained in the particle fraction. The PC filters that do not readily bind ions from seawater are suitable for Si, P, Ca, but also for heavier elements (Na–Fe). The background from SKC filters is relatively low for most elements of biological interest, but is higher than ANO filters for C and N. The SKC filters were included in the present study to characterize the filters, but were not further utilized for analysis of samples mainly due to high costs. The lower C content of TEF filters as compared to PC filters should, therefore, make them promising for measuring N and O, as well as heavier elements.
Determination of calibration factors
Calibration factors for the elements C and N were determined by CHN analysis using Synechococcus sp. cultures (Figure 2A, B). Estimated calibration factors with standard error of the regression coefficient for C were 88 ± 10 µg kcps−1 (r = 0.99) on GF/F and 30 ± 3 µg kcps−1 (r = 0.99) on ANO filters (Figure 2A). For N the corresponding values were 340 ± 30 µg kcps−1 (r = 0.99) on GF/F, and 124 ± 12 µg kcps−1 (r = 0.99) on ANO filters (Figure 2B). For C coated GF/F filters, the calibration constant was 30 ± 1 µg kcps−1, identical to that for Synechococcus sp. on ANO filters. These lower slopes of C and N on GF/F compared to ANO (Figure 2A) shows that there is a loss of C and N signal from Synechococcus sp. culture caused by matrix absorption when using GF/F filters.
The detection limits reported in Table 3 are sufficiently low to allow filtration of volumes for which the net signal exceeds the detection limits by a factor greater than five. Repeated measurements of four unused filters gave coefficients of variation (CV) less than 0.01, for all elements measured, suggesting that WDXRF measurement itself contributes very little to the total error. The main sources of error are introduced during the filtration process and handling of filters. The following CVs for net signal among replicates for combinations of filters and elements were observed: ANO filters—C = 0.08 and N = 0.06; PC filters—Si = 0.08, P = 0.11, Ca = 0.3, Fe = 0.08. To improve precision, 3–4 replicates were analysed for each sample, and calibration factors were determined with a relative error better than 0.07. In order to avoid variability between batches of filters, filter blanks were analysed for each new box of filters in parallel with samples as described previously (Norrman, Reference Norrman1993).
X-rays generated in particles may be absorbed as they pass through the particle (Goldstein et al., Reference Goldstein, Newbury, Echlin, Jo, Romig, Lyman, Fiori and Lifshin1992). This absorption will depend on mass thickness and the elemental composition of the particle. Lighter elements are generally most vulnerable to absorption and heavier elements are the most effective absorbers. Elements will also absorb X-rays from other elements which have slightly higher energy (e.g. C will absorb X-rays from N) (Goldstein et al., Reference Goldstein, Newbury, Echlin, Jo, Romig, Lyman, Fiori and Lifshin1992). This cannot easily be corrected for, and it implies that there is an upper mass thickness limit of particles that we can be accurately analysed by WDXRF, as mentioned previously.
The linear relation between signal output from WDXRF, and elemental quantity was tested by filtering increasing volumes of natural seawater through ANO (100–1000 ml) and GF/F (100–4000 ml) filters. The relationship between volume filtered and elemental quantity measured per filter was linear up to ~90, 23 and 7 µg for C, N, and Si (r > 0.99), respectively for ANO filters (Figure 3A, B, C). At higher mass thickness the relationship tends to saturate due to absorption. For GF/F filters, the relationship was linear up to 750, 116 and 30 µg/filter for C, N and P (r > 0.99), respectively (Figure 3D, E, F).
Relation between volume filtered (ml) and measured element quantity (µg/filter), on anodisc filters: (A) carbon; (B) nitrogen; (C) silicon, and on GF/F filters: (D) carbon; (E) nitrogen; (F) phosphorus.

Examples of WDXRF measurements on particulate matter from natural samples
Elemental composition of PM in seawater was measured using WDXRF and assessed in the context of a time-series fjord sampling programme, and from a mesocosm experiment (see Thingstad et al., Reference Thingstad, Bellerby, Bratbak, Borsheim, Egge, Heldal, Larsen, Neill, Nejstgaard, Norland, Sandaa, Skjoldal, Tanaka, Thyrhaug and Topper2008).
SILICON
The sampling from Raunefjord in 2008 started on 5 March, before initiation of the yearly spring diatom bloom (Dale L. Evensen, personal communication). Particulate silicon concentrations varied between 9 and 254 µg l−1, and corresponded well with the two distinct diatom blooms, both dominated by Skeletonema sp. (Figure 4A, D). When the diatoms peaked at the end of May in Raunefjord, Si concentration corresponded to 28 pg cell−1 assuming that all Si came from diatom cells (Figure 4A, D). As Skeletonema sp., which made up more than 90% of the total diatom community, has a Si content of only 2.6 pg cell−1 according to Paasche (Reference Paasche1980), the diatom frustules could not have accounted for all the measured Si.
Time-series development of elements (µg l−1) and microorganisms (cells l−1), from Raunefjord, 2008: (A) silicon and (B) iron from polycarbonate filters, measured in WDXRF; (C) carbon, nitrogen and phosphorus from GF/F filters, measured in WDXRF and calculated carbon; (D) diatoms; (E) nanoeukaryotes 1, nanoeukaryotes 2 and Emiliania huxleyi; (F) average of total bacteria with standard deviation, Synechococcus sp. and picoeukaryotes.

While microscope counts of diatoms are based on cells, Si from WDXRF analysis includes other Si-rich structures such as empty or broken frustules, or silt particles. If we do size-fractionated filtration, Si will also be found in fractions that are much smaller than the size of diatom frustules. An example of a condition like that can clearly be seen in a study performed in mesocosms, where a nearly monospecific bloom of a small (5–10 µm) diatom, Thalasiossira sp., occurred (Figure 5A) (Thingstad et al., Reference Thingstad, Bellerby, Bratbak, Borsheim, Egge, Heldal, Larsen, Neill, Nejstgaard, Norland, Sandaa, Skjoldal, Tanaka, Thyrhaug and Topper2008). There was a simultaneous increase in diatom numbers, and chlorophyll-a (Chl-a) and particulate Si in the fractions 5–10 and >10 µm (Figure 5). From day eight there is also a strong increase of Si in the fractions <5 µm, which continued after Chl a and cell numbers had reached their maximum. This increase in Si for the smaller fractions cannot be explained with living cells, which lead us to conclude that the Si-signals are from small pieces of broken diatom scales. Also Paasche & Østergren (Reference Paasche and Ostergren1980) reported that a certain amount of the particulate Si (µg l−1) were in a form that could not be recognized under the light microscope. The increase of total particulate Si from day 0–10 in the mesocosm (0CSi) was 586 µg l−1, which is slightly higher but comparable to the cumulative Si-consumption during the same period, ~484 µg l−1 (Thingstad et al., Reference Thingstad, Bellerby, Bratbak, Borsheim, Egge, Heldal, Larsen, Neill, Nejstgaard, Norland, Sandaa, Skjoldal, Tanaka, Thyrhaug and Topper2008, Supplementary Information).
Development of a diatom bloom in a mesocosm in Ny Ålesund (Spitsbergen) 2007 (see also Thingstad et al., Reference Thingstad, Bellerby, Bratbak, Borsheim, Egge, Heldal, Larsen, Neill, Nejstgaard, Norland, Sandaa, Skjoldal, Tanaka, Thyrhaug and Topper2008, mesocosm 0CSi, Supplementary Information): (A) numbers (ml−1) of the small diatom Thalassiosira sp.; (B) chlorophyll-a (µg l−1) in fractions 0.22–1; 5–10; and >10 µm; (C) concentration of Si (µg l−1) in the fractions 0.22–1; 1–5; 5–10; and >10 µm on polycarbonate filters.

CARBON, NITROGEN AND PHOSPHORUS
Wavelength dispersive X-ray fluorescence measurements of C, N and P from Raunefjord on GF/F filters show similar, albeit less pronounced patterns as Si, all peaking during the aforementioned diatom blooms (Figure 4A, C, D), suggesting that diatoms contribution also to these elements was quite important. All planktonic organisms contain C, N and P, and populations of autotrophic and heterotrophic organisms will contribute to these element pools. Total C and total N concentrations ranged from 68 to 410 µg l−1 and from 11 to 56 µg l−1, respectively. Overall, measured total C was consistent with estimated C of the different living organism according to Menden-Deuer & Lessard (Reference Menden-Deuer and Lessard2000), Olenina et al. (Reference Olenina, Hajdu, Edler, Andersson, Wasmund, Bruch, Göbel, Gromisz, Huseby, Huttunrn, Jaanis, Kokkonen, Ledaine and Niemkiewicz2006) and a conservative estimate of 20 fg C cell−1 assumed for heterotrophic bacteria.
The data series from Raunefjord in 2008 (Figure 4) was characterized by a high seasonal microbial biomass. A comparison between GF/F, PC, ANO and TEF filters from autumn 2010 to summer 2011 to evaluate the stoichiometric balance of marine particles across different seasons is shown in Figure 6. There is a good agreement in WDXRF signals for C and reasonable agreement for N, between GF/F and ANO filters, which also appears in the molar C/N ratios on these filters (Figures 6A, B & 7A). The C/N molar ratios varied between 3.6 and 6.8 during autumn and spring, and were slightly lower (2.1–3.9) during winter. Nitrogen and phosphorus may also be measured on TEF filters, but these filters showed high variation for N concentration when compared to measurements on GF/F and ANO filters. This can be redrawn by the low molar N/P from TEF filters, that deviate strongly from those of GF/F filters (Figure 7B). Phosphorous measurements on PC and TEF filters were comparable, while GF/F yielded relatively lower values of P when the total microbial biomass was high (Figure 6C). In general, molar N/P ratios from GF/F filters ranged between 10 and 16 for autumn and spring, and were slightly higher during winter (Figure 7B).
Time-series from Raunefjord: (A) for carbon (on anodisc and GF/F filters); (B) for nitrogen (on anodisc, GF/F and teflon); (C) for phosphorous (on polycarbonate, GF/F and teflon); (D) for iron (on polycarbonate and teflon).

Time-series from Raunefjord: (A) C/N (mol/mol) ratios (on anodisc and GF/F); (B) N/P (mol/mol) ratios (on anodisc and teflon), all with standard errors.

Because of the high variation in N measurement on TEF filters, and the error that can be introduced as these filters take an elliptic shape when drying, the authors do not recommend TEF filters for WDXRF analysis. Although GF/F filters have high detection limit for the elements we are interested in (Table 3), these filters give reliable results at low biomass, but more variable at high. Comparison of filters based on detection limits and results from natural samples show that ANO filters give the best results for C and N, and PC the best results for P, Ca and Fe (Table 3; Figures 2A, B, 6 & 7).
CALCIUM
Measurement of total particulate Ca in the 2010 series was in the range of 2–142 µg l−1 (Figure 8). Emiliania huxleyi (size 5–8 µm) is the most common pelagic calcifying species in Norwegian coastal water and is responsible for producing annual blooms of variable intensity and duration following the spring diatom bloom (Heimdal et al., Reference Heimdal, Egge, Veldhuis and Westbroek1994). The total numbers of E. huxleyi and WDXRF measurements of particulate Ca show a high covariation for this year. During the same time period in 2008 concentration of Ca (10–40 µg l−1) and E. huxleyi numbers (5 × 10⁵ cells l−1) were much lower, and we found no pattern of covariation between Ca concentration and E. huxleyi numbers by FCM analysis. The Ca contribution from E. huxleyi can be estimated by assuming 10–15 coccoliths per cell, and a Ca content of 0.67 pg per coccoliths (Fagerbakke et al., Reference Fagerbakke, Heldal and Norland1996; Paasche Reference Paasche2002). Although observed free coccoliths (15–20 per cell) will add to the Ca signal for a period in May, the increase in Ca during May and early June may originate from calcite/aragonite particles found in marine waters, with possible bacterial origin (Heldal et al., Reference Heldal, Norland, Erichsen, Thingstad and Bratbak2012).
Time-series, from Raunefjord, calcium (µg L−1) in 2008 (solid line) and in 2010 (dotted line); Emiliania huxleyi numbers (cells l−1) in 2008 (filled circles—data obtained from flow cytometry) and in 2010 (open circles—data obtained from scanning electron microscopy).

IRON
For the 2010–2011 series there is a small correspondence between Fe and C, N, P in PM and the Fe content was in the range of 1–5 µg l−1 (Figure 6D). In the 2008 series the covariance was weak (Figure 4B). No precautions were taken to avoid contamination from the boat or the equipment used. In previous studies, the Fe/P ratio (mmol/mol) was measured to be 3.6–7.5, for natural planktonic assemblage and suspended PM collected from the field (Ho et al., 2003; and references therein). In most of these studies, samples were collected using a phytoplankton net with 44–76 µm mask widths, and are accordingly not comparable to the filtration methods used in our study. Data from our 2010–2011 samples on PC filters showed an average Fe/P ratio (mmol/mol) of 470 ± 390 (SD). Iron bound to microalgae assemblages, colloidal and organically complexed iron fractions associated with phytoplankton blooms (Öztürk et al., 2002a, b), and iron sequestering bacteria (Heldal et al., Reference Heldal, Fagerbakke, Tuomi and Bratbak1996) and iron containing mineral particles (SEM elemental mapping, Heldal, unpublished) are concluded to be the main sources of iron in these samples.
DISCUSSION
Wavelength dispersive X-ray fluorescence analysis is the only non-destructive method available for element analyses at a bulk level, therefore the purpose of the current study was to develop WDXRF for quantitative measurements of elemental content of PM from the marine environment. High-quality data for biologically important elements, for example the C:N:P ratio (Redfield, Reference Redfield1934) in marine PM, are required for many aspects in marine science, particularly when making reliable element budgets in microbial community studies, and for testing and validating of mathematical models.
As described, the procedure will measure total amount of elements. However, for both ANO and GF/F filters we can distinguish between particulate inorganic carbon (PIC) and particulate organic carbon (POC) by an acid (HCl) vapour treatment of the filters, where all C in calcium carbonate will escape. This was tested on samples from Raunefjord 2010, where we measured the total C on filters before and after acid vapour treatment. For acid treated ANO and GF/F filters C in the PIC fraction (mainly calcium carbonate) amounted to 4.5% and 5.2% of the total C, respectively. GF/F filters can also be burned to remove all organic C and then re-analysed. We get a small increased chlorine signal by fuming with HCL. This interference was low for the ANO and teflon filters and higher for GF/F filters. We measured Ca after fumigation and in general we found small differences for ANO and teflon filters compared to pre-fumigated filters (~2%). The reduction of Ca on GF/F filters was considerably higher (~20%). We have no explanation for these differences.
Since the method is based on harvesting PM on filters, it therefore shares some problems with other filtration-based methods, such as retention dependence on particle loading and size distribution, clogging, cell disruption and passage of small cells during filtration (Altabet et al., Reference Altabet, Bishop and McCarthy1992; Sondergaard & Middelboe, Reference Sondergaard and Middelboe1993; Nayar & Chou, Reference Nayar and Chou2003). In addition there are some problems that are more specific to WDXRF, for example, that the elemental composition of the filters will limit the elemental measurement when the filter background for a specific target element is high. Composition of the filter matrix constrains the applicability of C and N analyses on PC and TEF filters, Si analyses on GF/F filters and P on ANO filters. Imprecise positioning of the measurement area on the filter will also contribute to the uncertainty of the measurements.
Absorption of X-ray signal from the sample by the filter matrix was an issue with GF/F filters, and, to a lesser degree, with TEF filters. In addition X-rays may be absorbed by the particles being analysed. An approximate estimation of absorption of elements as a function of size for spherical particle with a typical elemental composition of algae can be computed by applying mass extinction coefficients. We estimate that for such a particle with diameter of 4.5 μm, 20% of the N signal will be absorbed but only 8% for C, and even less for heavier elements (Goldstein et al., Reference Goldstein, Newbury, Echlin, Jo, Romig, Lyman, Fiori and Lifshin1992). Multiple layers of particles on the filter will also increase signal absorption. For light elements the technique is therefore most suitable for samples with small particle sizes and particles harvested on filters at a density of less than a monolayer.
The present study presents several approaches that may be used to reduce the effect of these errors and shortcomings of WDXRF analysis. Several filter types are used to yield optimal measurements for all elements of interest. The ANO filters combined with PC filters will cover all major elements of biological interest. The effect of particle loading on retention and absorption may be controlled by filtering 3–4 different volumes and using measurements from the linear part of the signal/volume relationship. The effect of absorption by the filter matrix or within the particles can to some extent be included in the calibration procedure by using typical particle loads and size distribution, but in rapidly changing environments this still represents a challenge for the method.
Adsorption of ions to the filter matrix is a source of error most pronounced in GF/F filters. The borosilicate matrix in those filters have a huge surface area and binding sites that may lead to adsorption of a broad range of ions, e.g. PO4 3−and Cu2+ (M. Heldal, personal communication). Since the concentration of soluble reactive phosphorus (PO4 3−) may vary in seawater samples, the use of P analyses on GF/F filters should be interpreted with caution.
In seawater, the elemental content of Na+, Cl−, Mg2+ and SO4 2− are 0.469, 0.546, 0.052 and 0.028 mol/kg, respectively (Libes, Reference Libes1992). These ions will in variable amounts adsorb to the filter matrix or be left on the surface after drying of the filters, and consequently contribute to the signal, but also act as an absorber of X-ray signal from light elements in PM on the filters. These phenomena were least pronounced when using PC filters. The influence of adsorbed ions or salt left on the filters was reduced by rinsing filters with reverse osmosis water prior to WDXRF analysis.
It is well-establish that the ions listed above occur in biological material, but mainly as osmolytes, and are thus of less importance in bulk analyses of marine PM. Other elements of interest in marine biomass are Mn and As, the former because it is bound to certain bacterial structures (Heldal et al., Reference Heldal, Fagerbakke, Tuomi and Bratbak1996), and the latter as a structural analogue to PO4 3−. Due to very low concentrations of these elements, volumes of seawater greater than those utilized in the present study must be filtered if WDXRF is to detect these trace elements.
Fractionated serial filtration can give further information about the elemental composition of size-classes of marine particles, including microorganisms. As filtration probably is the main source or error for WDXRF analysis, this will also influence measurements by fractionation on multiple filters. Preliminary studies show that fractionation on a series of filters using, for example, 60 µm, 10 µm, 5 µm, 1 µm and 0.2 µm filters, without exception gave higher values for the sum of filters compared to direct harvesting on the filter with lowest pore size. The discrepancy is in the range of 20–30% for elements like phosphorous, and the result changes for various samples, possibly as a consequence of changes in plankton community structures. From SEM studies we observe a wide range of particles smaller than the pore size trapped on the filters. These fractions may contribute to the overestimation we observe for harvesting by successive filtrations.
Wavelength dispersive X-ray fluorescence analysis of seawater PM shows promise for integration into routine monitoring programmes together with more traditional and more commonly used methods. The preparation of samples is simple and the measurement itself is automated. The method is fast, and has a precision and accuracy good enough (Table 3) to make its result valuable in this field of work (relative error better than 0.07). It will within a single measurement provide information on a set of elements of interest for example Si and Ca levels as proxy for development of blooms of certain phytoplankton groups like diatoms and coccolithophores, respectively.
CONCLUSIONS
We have developed, calibrated and tested a method to analyse elemental content in particles on filters using WDXRF. The main benefits of the method are: simple sample preparation and the wide range of elements that can be measured. These include elements of biological interest such as C, N, P, Si and Ca but also elements that are not easily measured with other techniques such as Fe. Oxygen can also be measured, but was not addressed in this study. The method is non-destructive allowing samples to be analysed with another method or reanalysed after combustion or treatment in acid vapour. From our experience with different filter types we recommend ANO for C and N and PC for heavier elements.
The actual measurement of X-ray signals is done with a small error as can be seen from the low detection limits reported for the method. Our calibration factors have relative errors of approximately 10%. Most of the errors are introduced by the filtration and the subsequent handling of the filters: variation diameter of glass funnels and imprecise centring of filters causing the measured area to be different from the filtered area. Relative errors better than 10% can be obtained by using three to four replicates.
Internal absorption of X-rays from light elements like C and N will also put an upper size limit to the particles that can reliably be measured, making the method most suitable for microbiological samples. Within the limitations mentioned, the method has an adequate precision (5%) and accuracy (10%) to be a valuable supplement in the field of ecological stoichiometric studies along with complementary methods like flow cytometry, and nutrient analysis.
ACKNOWLEDGEMENTS
We would like to thank Tomas Sørlie and Mette Hordnes for assistance during sampling, Dale L. Evensen for providing phytoplankton data, and Jessica L. Ray for comments and linguistic corrections of the manuscript. We also thank the anonymous referees for comments and suggestions to improve this paper.
FINANCIAL SUPPORT
This work was financially supported by the Research Council of Norway through the Project 184860 MERCLIM (Marine Ecosystem Response to a changing CLIMate), the International Polar Year project 175939/S30 ‘PAME-Nor’ and by EU-ERC project MINOS ref.nr. 250254.



