I. INTRODUCTION
A homogeneous distribution of primary dendrite arm spacing is required to achieve uniform distribution of mechanical properties in castings.Reference Tewari, Weng, Ding and Trivedi
1
The primary dendrite arm spacing was generally measured using the area method as
 $\sqrt {{A/N}} $
by inherently assuming a square distribution of dendrites, where N is the number of dendrites in this given area A transverse to the growth direction. However, statistical analysis such as minimal spanning tree (MST)Reference O’Dell, Ding and Tewari
2
–
Reference Luo, Su, Li, Guo, Yang and Fu
10
shows that a 6-fold symmetry is dominant in the distribution of primary dendrite arms, indicating that the assumption of square distribution is not strictly valid. In addition, numerous research has empiricallyReference Vandyoussefi, Kerr and Kurz
11
–
Reference Zhong, Li, Liu, Lü, Zou and Fu
14
and theoreticallyReference Biswas, Hermann, Wendrock, Priede, Gerbeth and Buechner
15
demonstrated the existence of an allowable range of stable primary dendrite arm spacing (λ1), which cannot be characterized by the conventional area counting method. Thus, statistical analysis is more applicable to study the primary dendrite arm spacing (λ1) and distribution of primary dendrite arms.
Statistical analysis on the primary dendrite arm spacing includes two aspects: the range of the primary dendrite arm spacing that can be characterized by the MST and the distribution of number of nearest neighbors that can be characterized by the Voronoi polygon.Reference Billia, Jamgotchian and Nguyen Thi 3 The MST, which is proposed by Dussert et al.,Reference Dussert, Rasigni, Rasigni, Palmer and Llebaria 16 is a commonly used approach in statistical analysis when studying order and disorder in a distribution of points. MST is a connected curve without any closed loop, and when it is applied to analyze the range of primary dendrite arm spacing, it contains all the cell/dendrite centers, for which the sum of the edge weights is minimum. The range of the dendrite arm spacing can be characterized by the average length and standard deviation of MST. The Voronoi polygons surrounding the cell/dendrite centers contain the nearest neighbors of each center, which can be used to analyze the frequency distribution of nearest neighbors for cellular/dendritic microstructures.Reference Billia, Jamgotchian and Nguyen Thi 3
Although the primary dendrite arm spacing has been studied in many peritectic alloys,Reference Han and Trivedi 17 – Reference Kaya, Çadırlı, Keşlioğlu and Maraşlı 23 distribution of dendrites has never been statistically analyzed in dendritic solidification of peritectic alloys to our knowledge. The main objective of this study was to examine the dendrite arrays in directionally solidified Sn–36 at.% Ni alloys over a range of growth rates (2–200 μm/s). First, the distribution of primary dendrites of the primary Ni3Sn2 phase in the transverse section was studied using statistical analysis including the MST and Voronoi polygon; then, dependence of primary dendrite arm spacing (λ1) of primary Ni3Sn2 intermetallic phase on growth rate (v) was analyzed; and finally, the disorder in distribution of primary dendrites was also discussed.
II. EXPERIMENTAL PROCEDURES
The Sn–36 at.% Ni alloy from pure Ni and Sn (99.9%) was induction melted and as-cast rods of 3 mm in diameter and 110 mm in length were machined from the ingot by a spark machining. Samples were melted and directionally solidified in a Bridgman-type furnace consisting of a resistance furnace, a water-cooled liquid metal bath filled with a liquid Ga–In–Sn alloy, and an adiabatic zone, which is located between the heater and the cooler, as previously described.Reference Fan, Li, Su, Guo and Fu 24 The samples were placed into 99.99% pure alumina crucibles of 4/5.5 mm diameter (inside/outside diameter) and length of 150 mm. Temperature profiles were measured using a PtRh30–PtRh6 thermocouple inserted down the center of the samples, and the temperature gradient close to the solid–liquid interface deduced from the temperature profiles was approximately 20 K/mm.
For each experiment, the furnace was heated to 1.250 °C to melt the alloy during 2 h and then was held for 30 min to homogenize the melt. Solidification of Sn–36 at.% Ni peritectic alloy was carried out at different growth rates (2, 5, 10, 15, 20, 40, and 200 μm/s) under a constant temperature gradient (20 K/mm) in the Bridgman-type apparatus. After reaching a growth distance of 30 mm, the samples were quickly quenched into the liquid Ga–In–Sn alloy to preserve the solid–liquid interface. The samples were longitudinally and transversally sectioned, polished, and etched with a solution of 10 g FeCl3, 20 mL HCl, and 180 mL H2O for further analysis. The microstructures of the samples were observed with optical microscopy and scanning electron microscopy (Quanta 200F, FEI Company, Hillsboro, OR). Phase analysis was carried out by using x-ray diffraction (Rigaku D/max-RB, Tokyo, Japan) with monochromatic Cu Kαradiation.
III. RESULTS AND DISCUSSION
A. Microstructure of directionally solidified Sn–36 at.% Ni alloy
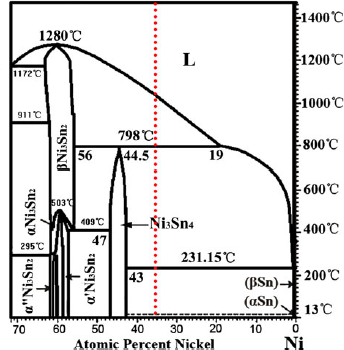
The relevant part of Sn–Ni phase diagram is shown in Fig. 1, and the initial alloy concentration in the present study is shown as the dotted line. Under equilibrium solidification, Sn–36 at.% Ni alloy undergoes three reactionsReference Schmetterer, Flandorfer, Richter, Saeed, Kauffman, Roussel and Ipser 25 :
-
(i) T L = 1040 °C: L → Ni3Sn2;
-
(ii) T P = 798 °C: L + Ni3Sn2 → Ni3Sn4; and
-
(iii) T E = 231.15 °C: L → Ni3Sn4+ Sn,
The relevant part of Sn–Ni binary phase diagram.Reference Schmetterer, Flandorfer, Richter, Saeed, Kauffman, Roussel and Ipser 25

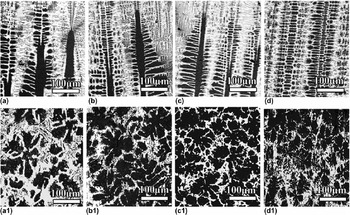
where T L, T P, and T E correspond to the liquidus, the peritectic, and the eutectic temperatures, respectively. Figure 2 shows the microstructure of solid–liquid interface in both longitudinal and transverse section of directionally solidified Sn–36 at.% Ni peritectic alloys at different growth rates. The dark gray and white phases correspond to the primary phase and eutectic phase, respectively. As the growth rate increases, the primary dendrite arm spacing gradually decreases.
Morphology of the solid–liquid interface of directionally solidified Sn–36 at.% Ni peritectic alloys at different growth rates: (a), (a1) v = 10 μm/s; (b), (b1) v = 20 μm/s; (c), (c1) v = 40 μm/s; and (d), (d1) v = 200 μm/s.

B. Typical statistical analyses used in this study
In this work, the statistical analyses include two steps: identification of the centers of mass, which can represent the primary dendrite arms first, and then study on distribution of these centers using the MST and Voronoi polygon, respectively. Although these analytical techniques have already been described in detail,Reference Tewari, Weng, Ding and Trivedi 1 a brief explanation still needs to be presented here for relatively less concentration on these techniques in the field of solidification.
1. Identification of centers of mass
To carry out the statistical analysis on the primary dendrites, the center of mass of the individual dendrite has been selected as its characteristic representation. Centers of mass can be identified either by a manually located electronically recorded technique or by a computer-aided pattern recognition technique.Reference Hui, Tiwari, Wu, Tewari and Trivedi 26 The former can provide more reliable results considering that the dendritic morphology is not symmetric with respect to its center of mass. Therefore, the analyses presented here are based on the manually identified method.
2. Minimal spanning trees
The definition of MSTs was proposed by Dussert et al.Reference Dussert, Rasigni, Rasigni, Palmer and Llebaria 16 to study order and disorder of particles of an aggregated lithium thin film deposited on a dielectric substrate. In the present work, the MST is a connected graph without any closed loop computed using Prim’s algorithm.Reference Prim 27 It is an edge-weighted linear graph and consists of a set of nodes (the cell/dendrite centers for the case of cellular/dendritic solidification) and a set of edges, each edge being defined by a pair of cell/dendrite centers, with a weight assigned to each edge (the corresponding center-to-center distance).Reference Tewari, Weng, Ding and Trivedi 1 – Reference Noel, Jamgotchian and Billia 4 , Reference Vandyoussefi, Kerr and Kurz 11 , Reference Hui, Tiwari, Wu, Tewari and Trivedi 26 A MST contains all the cell/dendrite centers for which the sum of the edge weights is minimum.
3. Voronoi polygon
The Voronoi tessellation, which is also known as the Dirichlet tessellation, is an important construction in computational geometry. It is a tiling of space where each tile represents the space closest to a particular point.Reference Schroeder, Martin and Lorensen 28 In our analysis, according to Tewari et al.,Reference Tewari, Weng, Ding and Trivedi 1 the points are first triangulated, and then, mid-perpendiculars to the segments joining any two centers are drawn. The smallest convex polygons surrounding each point, which contain all its nearest neighbors, are defined. Therefore, the number of sides of a Voronoi polygon reveals the number of neighboring features. This technique can be used to examine the degree of disorder in the distribution of dendritic features in this study. And this technique is similar to the Wigner–Seitz construction that has earlier been used to analyze the frequency distribution of nearest neighbors for cellular microstructures.Reference Billia, Jamgotchian and Nguyen Thi 3
C. Statistical analyses of primary dendrite arm spacing λl
1. Typical statistical analysis
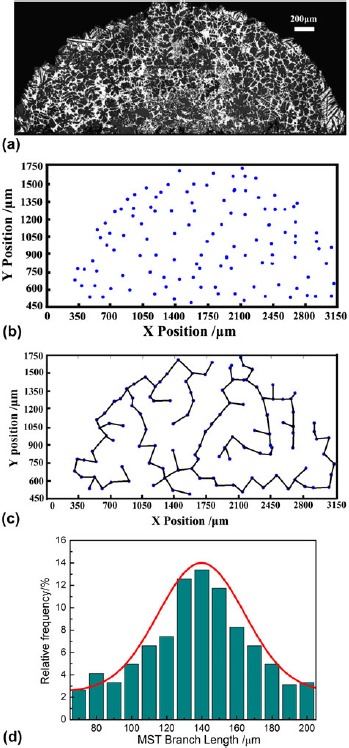
To clearly illustrate the typical microstructural analyses carried out in this study, the Sn–36 at.% Ni alloy sample, which was directionally solidified at 20 μm/s, was chosen as an example. The transverse view at a distance of 150 μm from the dendrite tips is presented in Fig. 3(a). Figure 3(b) shows the distribution of the center of mass of each dendrite. The X–Y coordinates of the dendrite centers were obtained by manually locating them on the magnified images of each dendrite. Figure 3(c) shows the corresponding MST,Reference Hu, Yan, Chen, Li and Fu 12 , Reference Pan, Huang, Lin and Zhou 18 – Reference Lu and Hunt 21 which represents the shortest total length of the branches to connect all the nodes in Fig. 3(b). The mean values of the branch lengths (m*) and their standard deviation (σ*) obtained from the MSTs have been used to provide a statistical measurement of the nearest-neighbor distribution as in cellular microstructures in Pb–Sb,Reference Tewari, Weng, Ding and Trivedi 1 Pb–T1,Reference Billia, Jamgotchian and Nguyen Thi 3 and succinonitrile (SCN)–acetoneReference Noel, Jamgotchian and Billia 4 alloys. Figure 3(c) also clearly shows the presence of nonuniform distribution across the cross section.
Typical microstructural analyses illustrated for directionally solidified Sn–36 at.% Ni peritectic alloy at growth rate of 20 μm/s: (a) transverse image of solid–liquid interface, (b) centers of mass of dendrites, (c) MST based on (b), and (d) frequency distribution of the branch lengths obtained from the MST.

A MST can be constructed for any distribution of points on a surface. There are a few specific cases in which, for a given distribution of cell/dendrite centers, the MST is not unique and locally varies depending on the node, which is selected to start its construction. Nevertheless, the important property of MST is that all the possible MSTs are equivalent so that the edge length histogram is unique, which legitimates the utilization of parameters that are deduced from the statistical analysis of that histogram to characterize the arrangement of the dendrite centers.Reference Billia, Jamgotchian and Nguyen Thi 3
Figure 3(d) shows the frequency distribution of the branch lengths corresponding to the MST shown in Fig. 3(c) and a Gaussian fit through the data, where the frequency (F) is given byReference Hui, Tiwari, Wu, Tewari and Trivedi 26 :
 $$F = A_0 \exp \left[ { - 0.5\left( {{{(X - A_1 )} \over {A_2 }}} \right)^2 } \right]\quad,$$
where A 0 is the amplitude, A 1 the center position, and A 2 the width of the fit curve. The experimentally determined branch length distribution shows a good fit to the normal distribution. For this sample, the r 2parameter (correlation coefficient) of the Gaussian fit is 0.94. The MST branch length distributions are used in the present work to represent the distribution of primary dendrite arm spacing.
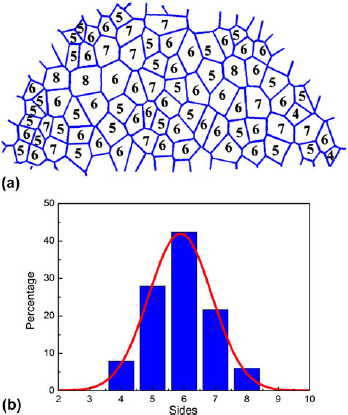
Figure 4(a) shows the Voronoi polygons corresponding to the dendrite center distribution in Fig. 3(b). For the sake of the accuracy of analysis, the connection to the current tree is restricted to the dendrites, which are in full view in the sampling window. Proportionally, as the surface area diminishes, more natural edges are therefore impeded, and the deviation from the real value increases. The numbers shown within each polygon indicate the corresponding number of nearest neighbors to each dendrite center. The relative frequency distribution of the number of nearest neighbors obtained from these Voronoi polygons is shown in Fig. 4(b). The r 2parameter of the Gaussian fit is 0.95.
Voronoi polygons directionally solidified Sn–36 at.% Ni peritectic alloy at growth rate of 20 μm/s: (a) number of nearest neighbors is indicated for each polygon and (b) relative frequency distribution of the number of nearest neighbors.

2. Variation of dendrite distribution with growth rate
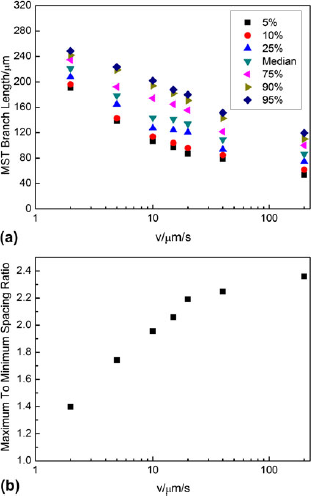
Figure 5 shows the growth rate dependence of the primary dendrite spacing (λ1) in directionally solidified Sn–36 at.% Ni alloy. Growth rate dependence of primary dendrite distribution (branch length distribution of the corresponding MSTs) is shown in Fig. 5(a). The 5th, 10th, 25th, 50th, 75th, 90th, and 95th percentile values of MST branch length are depicted. It can be observed that with the increase of growth rates, the values of λ1 gradually decrease. Furthermore, there exists a range of primary dendrite arm spacing, which first increases and then turns to decrease with increasing growth rates. As has been suggested by recent theoretical models,Reference Vandyoussefi, Kerr and Kurz 11 – Reference Dussert, Rasigni, Rasigni, Palmer and Llebaria 16 it is obvious from this figure that directional solidification of a binary alloy at a constant growth rate and temperature gradient does not produce a constant primary spacing; instead, there exists a range of spacing.
Growth rate dependence of primary dendrite distribution of directionally solidified Sn–36 at.% Ni alloys: (a) the range of primary spacing and (b) maximum to minimum MST branch length ratio.

The maximum to minimum spacing ratio, as indicated by the ratio of the 95th and 5th percentile MST branch lengths, as a function of growth rate is plotted in Fig. 5(b). This ratio indicates the stable range of the primary dendrite arm spacing during steady-state directional solidification. It increases from the value of 1.4 at the lowest growth rate, approaching the value of 2.4 at the highest growth rate in the present work. The existing range of this ratio indicates that the stable range of the primary dendrite arm spacing changed in an extensive range of growth rates. In Pb–Sb alloys,Reference Hui, Tiwari, Wu, Tewari and Trivedi 26 the ratio is only about 1.4 at lower growth rates, and Hunt and LuReference Hunt and Lu 29 suggest that this ratio to be about 2. The range of this ratio in this study basically falls into the range defined by previous research.
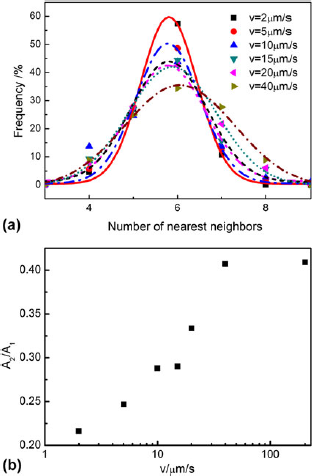
Figure 6(a) shows the frequency distribution of the coordination number (number of nearest neighbors) obtained from the Voronoi polygons of dendrite centers on the transverse sections of the directionally solidified Sn–36 at.% Ni alloys at different growth rates. It is interesting to note that for all the samples examined in this study, the most probable number of nearest neighbors was observed to vary within a narrow range. Despite the predominant number of the nearest neighbors appears to be six at each growth rate, the existence of other than hexagonal patterns cannot be ruled out in general, and there is considerable scatter in the data, which becomes more significant with increasing growth rate. This is indicated by the width parameter, A 2, that appears to increase with the increasing growth rate, as indicated in Fig. 6(b), which plots the A 2 to A 1ratio. Thus, as the growth rate increases, not only the relative scatter in the primary dendrite spacing increases, but also the scatter in the number of nearest neighbors increases.
Frequency distribution of the number of nearest neighbors obtained from the Voronoi polygons of dendrites on the transverse sections of directionally solidified Sn–36 at.% Ni alloys at different growth rates: (a) frequency and (b) the A 2/A 1ratio.

D. Disorder in distribution of dendrites
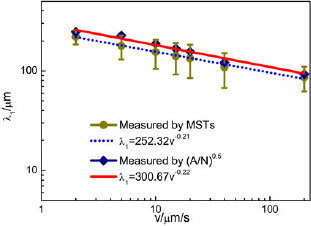
The distribution of primary dendrite arms can be identified by either the range of primary dendrite arm spacing or the number of the nearest neighbors obtained from the Voronoi polygon shown in Fig. 6(a). Figure 7 shows the values of primary dendrite arm spacing determined by the MST and conventional area counting method. The linear regression analysis of the values of primary dendrite arm spacing determined by the MST and conventional area counting method are shown as the dotted and solid lines, respectively: λ1 = 252.32v−0.21 and λ1 = 300.67v−0.22. The r 2parameters are 0.99 and 0.96, respectively. It can be observed from the linear regression analysis result that the values of primary dendrite arm spacing determined by the MST and conventional area counting method all decrease monotonously with increasing growth rates, and at a given growth rate, the values of the primary dendrite arm spacing measured by the conventional area counting method basically fall into the range determined by MST.
Comparison of the primary dendrite arm spacing determined by the MST with the spacing determined by the conventional area method in directionally solidified Sn–36 at.% Ni alloys.

The ranges of the primary dendrite arm spacing that are determined by the MST first increase and then turn to decrease with increasing growth rates. The range is associated with the disorder in distribution of primary dendrite arms, which is affected by both the growth rate and interdendritic convection. On the one hand, the microstructure appears to show the greatest ordering near the cell-to-dendrite transition,Reference Hui, Tiwari, Wu, Tewari and Trivedi 26 and as only dendrite morphology exists in this study, the side branching become more prominent as the growth rate increases; consequently, the disorder increases with increasing growth rates. On the other hand, the disorder caused by interdendritic convection will be reducedReference Hui, Tiwari, Wu, Tewari and Trivedi 26 due to decreasing composition variation across the solid–liquid interface as growth rate increases.Reference Hunt and Lu 29 Thus, interaction of disorder induced by growth rate and interdendritic convection results in that the disorder in distribution of primary dendrite arm will be most significant when the growth rate is close to 20 μm/s, which is consistent with the largest range of primary dendrite arm spacing at that growth rate. Thus, the first increase and then decrease of the range of primary dendrite arm spacing are observed.
However, the number of the nearest neighbors illustrated in Fig. 6(a) shows that the distribution of primary dendrite arms deviates from the hexagonal distribution more and more significantly with increasing growth rates, and the decrease of the disorder at higher growth rates discussed above does not occur. This can be attributed to two causes. First, there may be a scatter inherent in the primary spacing distribution,Reference O’Dell, Ding and Tewari 2 as indicated by the reported history dependence of primary spacing,Reference Schroeder, Martin and Lorensen 28 which is identified as disorder by the Voronoi polygon. Second, the Voronoi polygon can only indirectly characterize the disorder in distribution of primary dendrite arms by the deviation of distribution of primary dendrite arms from inherent hexagonal tessellation. Thus, inherent hexagonal tessellation of the distribution of primary dendrite arms identified by the Voronoi polygon does not necessarily mean the uniform distribution of primary dendrite arm spacing. Therefore, the disorder in distribution of primary dendrite arms can be more precisely determined by the MST.
IV. CONCLUSIONS
Statistical analysis of the primary dendrite arm spacing of primary Ni3Sn2phase has been carried out on the transverse sections of the directionally solidified Sn–36 at.% Ni peritectic alloy. The following conclusions can be drawn from this study.
-
(i) The Voronoi polygons of primary dendrites show that a dominance of six nearest neighbors exists in the distribution of the number of nearest-neighbor dendrites of the primary Ni3Sn2phase. There exists considerable disorder in this hexagonal distribution, which increases as the morphology becomes more branched dendritic with increasing growth rates.
-
(ii) The MSTs show that a range of primary dendrite arm spacing is present at the solid–liquid interface, which is identical to recent theoretical models. The range first increases and then turns to decrease with increasing growth rates, which can be attributed to interaction of disorder induced by growth rate and interdendritic convection. The disorder in distribution of primary dendrite arms can be more precisely determined by the MST as compared with the Voronoi polygon.
-
(iii) Comparison of the primary dendrite arm spacing determined by the MST with the spacing obtained by the conventional area counting method shows that the means of the primary dendrite arm spacing obtained by MSTs are always smaller than those obtained by the area method at different growth rates, and the values of the latter are basically in the range of the values of the former.
ACKNOWLEDGMENTS
This project was supported by the National Natural Science Foundation of China (Grants No. 51071062, 51274077, and 51271068), Open Project of State Key Lab of Mold and Die Technology of Huazhong University of Science and Technology (Grant No. 2011-P03), The Fundamental Research Funds for the Central Universities (Grant No. HIT. NSRIF. 2013002), and Project 973 (Grant No. 2011CB610406).