


INTRODUCTION
There is concern about sustainable resource management in order to reduce environmental constraints due to farming practice in intensive dairy farming in Europe. Farmers need to maximize the utilization of forages to reduce feed costs and to remain competitive in the market. However, to achieve reduced environmental constraints in Europe, farmers are forced to reduce their nitrogen (N) inputs as mineral N fertilizer. This may affect dairy farmers especially in nitrate-vulnerable zones, where many dairy farmers are located.
In this context, forage legumes are gaining renewed interest. Due to their ability to fix atmospheric N symbiotically and their high feeding value, forage legumes – as an alternative source of home grown proteins in Europe – contribute to the sustainability of dairy farming by reducing the need for concentrate supplementation and fertilization input (Fraser et al. Reference Fraser, Fychan, Jones and Pullar2000; Sleugh et al. Reference Sleugh, Moore, George and Brummer2000). However, the high crude protein (CP) content in forage legumes and its fast degradation rate compared to the amount of fermentable organic matter (OM) available in the rumen may lead to inefficient utilization of the N by ruminants, resulting in high N losses to the environment especially under grazing. This low N use efficiency (NUE) has an environmental impact through ammonia losses and nitrate leaching (Tamminga Reference Tamminga1996; Trott et al. Reference Trott, Wachendorf, Ingwersen and Taube2004). Although eutrophication of surface water and groundwater is decreasing for phosphorus (P), N is still a problem (Bach & Frede Reference Bach and Frede1998).
Although forage legumes are important sources of protein for ruminants, their protein is often poorly utilized by the animal. The literature suggests that the protein of forage legumes is extensively degraded in the rumen, resulting in a low bypass protein (Broderick Reference Broderick1995; Broderick & Albrecht Reference Broderick and Albrecht1997; Cassida et al. Reference Cassida, Griffin, Rodriguez, Patching, Hesterman and Rust2000). The CP fractionation provides a basis for the estimation of the protein quality of feeds for dairy cattle (Sniffen et al. Reference Sniffen, O'Connor, Van Soest, Fox and Russell1992; Dinn et al. Reference Dinn, Shelford and Fisher1998). It is assumed that a high proportion of Fraction A (FA; g CP/kg CP) indicates high amounts of non-protein N (NPN) in the rumen, with the potential to be lost via urine. Losses are enhanced especially when the amount of fermentable OM in the rumen is insufficient (Beever et al. Reference Beever, Losada, Cammel, Evans and Haines1986a, Reference Beever, Dhanoa, Losada, Evans, Cammell and Franceb). Fraction C (FC; g CP/kg CP) consists of indigestible N, which is completely excreted in faeces. Both FA and FC vary with forage species, cell wall proportion, presence of secondary compounds and proportion of fermentable OM in the rumen (Mason & Frederiksen Reference Mason and Frederiksen1979; Ombabi et al. Reference Ombabi, Südekum and Taube2001). The characteristic of FC may favour N recycling under grazing situations, because the N bound is not readily available for decomposition in soil and, consequently, for leaching and gaseous N losses (Mutabaruka et al. Reference Mutabaruka, Hairiah and Cadisch2007). Although this may be positively evaluated for nitrate-vulnerable zones in Europe, increasing the FC in forage and in the diet of ruminants should not decrease the amount of amino acids available for the host, which would reduce animal performance.
In northwest Europe, white clover (WC) is widely used due to its high nutritional value associated with improved animal performance, and its adaptation to grazing systems and environmental conditions (Vipond et al. Reference Vipond, Swift, Cleland, Fitzsimons and Hunter1997; Yarrow & Penning Reference Yarrow and Penning2001). However, due to the grass–arable option of grassland management, less persistent legume species may be appropriate alternatives to WC. Among forage legumes, the protein quality of WC could be inappropriate for a high NUE in ruminant nutrition. Previous studies have shown that the CP of WC consists of a great part of NPN (Gierus et al. Reference Gierus, Kleen, Taube, O'Mara, Wilkins, Lovett, Rogers and Boland2005), which might enhance low NUE (Beever et al. Reference Beever, Losada, Cammel, Evans and Haines1986a, Reference Beever, Dhanoa, Losada, Evans, Cammell and Franceb). In contrast, legumes that contain secondary plant compounds might be advantageous compared to WC. Studies with birdsfoot trefoil (BT), which contains condensed tannins, have shown lower protein degradation rates in the rumen compared to lucerne (LG; Cassida et al. Reference Cassida, Griffin, Rodriguez, Patching, Hesterman and Rust2000; Misselbrook et al. Reference Misselbrook, Powell, Broderick and Grabber2005). Similarly to condensed tannins, quinones found in red clover (RC) may also have such properties (e.g. Jones et al. Reference Jones, Muck and Hatfield1995; Dewhurst et al. Reference Dewhurst, Evans, Scollan, Moorby, Merry and Wilkins2003; Lee et al. Reference Lee, Tweed, Minchin and Winters2009). However, the benefits of forage legumes containing secondary plant compounds may be limited by the adaptation of the legume to the defoliation system and therefore its proportion in the mixture is important to ensure the desired effect. The forage quality of legume species and their adaptation to different defoliation systems may provide information about management options to optimize the botanical composition and coexistence with the companion grass, especially for grazing animals. The objective of the present study was to investigate the short-term influence of different forage legume species (Trifolium repens L., Trifolium pratense L., Medicago sativa L. and Lotus corniculatus L.) in binary mixtures with perennial ryegrass (Lolium perenne L.) subjected to three different defoliation systems (grazing, silage cutting and simulated grazing) on yield performance and forage quality.
MATERIALS AND METHODS
The experiment was established in 2003 and 2004 and carried out in the first production years of 2004 and 2005 on different sites of the Lindhof experimental farm of the University of Kiel in northern Germany (53°40′N, 10°35′E). This design was chosen to avoid confounding effects with sward age and year. The soil texture at the experimental site is sandy loam–loamy sand, with 63% sand (by volume), 30% silt and 7% clay, containing 15·1 g OM/kg. Table 1 shows the total monthly precipitation and average monthly temperatures for both experimental years and also the long-term values (1980–2005). The climate is oceanic-temperate with usually adequate rainfall during the vegetation periods (long-term average: 390 mm April–September) and mild winters.
Total monthly precipitation and average monthly temperature of both experimental years and long-term values (1980–2005)

WC (cv. Klondike), RC (cv. Pirat), BT (cv. Rocco) and grazing-type LG (cv. Ameristand) were sown in binary mixtures with perennial ryegrass (G, cv. Fennema). The sowing densities were 4, 8, 8 and 16 kg/ha for WC, RC, BT and LG in binary mixtures with G (15 kg/ha). The legume seed of BT and LG was inoculated with the specific rhizobial strains prior to sowing. All mixtures were sown each year at different sites within the experimental station as blank seeds in autumn after harvesting the main crop (wheat), topped once before winter, without using any mineral N fertilizer. The four mixtures are abbreviated as WC+G for the white clover/perennial ryegrass, RC+G for the red clover/perennial ryegrass, LG+G for the lucerne/perennial ryegrass and BT+G for the birdsfoot trefoil/perennial ryegrass.
The experiment consisted of a combination of (i) the four different mixtures with (ii) the three different defoliation systems. Plots were arranged in a split-plot design with three replicates as randomized blocks, resulting in 36 experimental units each year. The defoliation system was considered the main plot and mixture the subplots. For the silage cutting system, the mixtures were harvested every 50±5 days with the first cutting after half the ears of the ryegrass had emerged. In the simulated grazing system, the mixtures were harvested with a regrowth period of 30±3 days in 2004 and 2005; the first cut took place when the first node of the ryegrass was detectable. Swards managed in the simulated grazing system are comparable to the development stage of swards in the grazing systems, but without the effects of trampling and addition of animal excrements. For the cutting regime, 3×10 m plots were established. For the grazing system, mixtures were rotationally grazed five times (regrowth period of about 30 days) by Limousin heifers in 2004 and 2005. Grazing was performed with high stocking rates (60 heifers/ha, blocked by age and weight into two grazing groups) to realize short grazing periods of 2–5 days, in order to keep herbage loss and selective grazing to a minimum. Each individual grazed paddock was 1500 m² in size, for a total grazed area of 1·8 ha. For each grazing cycle, RC+G and LG+G were grazed first, while WC+G and BT+G were grazed approximately 7–10 days later, as only two groups of heifers were available. The forage stubble height was measured with a rising plate meter (Grasstec Ltd, Ireland) and if forage stubble height was c. 5 cm (estimated forage mass available of 300 kg dry matter (DM)/ha), the heifers were removed and transferred to the next grazing plot or to a supplemental pasture of similar botanical composition as the experimental pasture until the beginning of the following grazing cycle. To allow a uniform regrowth, the grazing plots were topped with a mulcher after the removal of heifers. Table 2 shows the annual number of grazing days, expressed in unit animal (1 UA=500 kg live weight (LW)) during the grazing season (UA×day/ha).
Total annual grazing days for the different mixtures under grazing
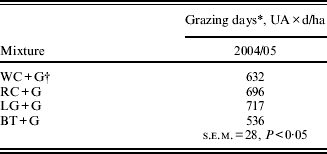
* Grazing days are expressed as unit animal (500 kg LW)×days/ha in the grazing season. The effect of year was higher for 2004 (P<0·05).
† WC+G: white clover/grass; RC+G: red clover/grass; LG+G: lucerne/grass; BT+G: birdsfoot trefoil/grass.
For the two cutting systems (silage cut and simulated grazing), the plots were harvested with a Haldrup forage harvester (Løgstor, Denmark) at a stubble height of 5 cm. Due to irregular sampling dates, the DM yield of grazing plots was measured by hand clipping squares of 0·25 m² per grazing plot before allowing the heifers to graze. To assure representative samples of the grazing plots, up to 10 squares were clipped and pooled per plot. The total annual DM yield represents the total annual forage on offer for the grazing animals, i.e. without subtracting DM losses of rejected biomass. Residual forage mass was measured by clipping squares of 0·25 m² to achieve less than 0·30 rejected biomass. To obtain the DM yield, a sub-sample of fresh herbage was dried at 58°C for 48 h and corrected for residual water content, by drying a sub-sample for 12 h at 105°C.
To calculate the annual net energy for lactation (NEL) and N yield, unfractionated bulk samples were dried and milled to pass through a 1 mm sieve (Cyclotech mill, Florida, USA, Tecator). Neutral detergent fibre (NDF) and acid detergent fibre (ADF) were analysed according to Van Soest et al. (Reference Van Soest, Robertson and Lewis1991) using a semi-automatic apparatus (ANKOM, USA). The NEL content was estimated with the following equation (Menke & Steingass Reference Menke and Steingass1988):

To calculate the annual N yield, the N content of the bulk samples was determined by a rapid combustion (850°C), conversion of all N products to N2, and subsequent measurement by thermoconductivity cell (elementar-analysator Vario MAX CN, Florida, USA; Elementar Analysensysteme, Germany).
For the botanical composition of the different mixtures, a fresh sub-sample of 150 g was separated into the fractions legume species, companion grass and weeds and dried at 58°C for 48 h for each single harvest date/grazing cycle.
Protein fractionation was performed following the recommendations of Licitra et al. (Reference Licitra, Hernandez and Van Soest1996). Briefly, FA represents the non-protein nitrogen and FC is considered to be the insoluble true protein, as measured by acid detergent insoluble nitrogen (ADIN). Fraction B (FB) is the true protein potentially degradable. In the present study, FB was calculated by subtracting FA and FC from total CP. All fractions are expressed as g CP/kg CP.
All forage quality parameters were analysed in a set of selected samples and after calibration, contents were estimated using near-infrared reflectance spectroscopy (NIRS). All samples were scanned twice with a NIR-Systems 5000 monochromator (Perstrop Analytical Inc., Silver Spring, Maryland, USA) over a wavelength range of 1100–2500 nm in 2 nm intervals. Calibration and validation statistics for the different forage quality parameters are shown in Table 3.
Statistical data of NIRS-calibration and -validation for CP, NDF, ADF, FA and C of the different legume/grass mixtures

* n: number of samples; Min–Max: minimal–maximal value; s.d.: standard deviation; s.e.c.: standard estimate for calibration; s.e.v.: standard error of estimation of independent validation samples.
Data were submitted to analysis of variance (ANOVA). With a significant F-test, means were separated using the Student's t-test (P<0·05). To avoid random significance between pair-wise comparison of means, the probabilities of previously planned contrasts were adjusted using the Bonferroni–Holm test (Horn & Vollandt Reference Horn and Vollandt1995). As typical sward mixture in northern Germany, WC+G mixtures were used as reference.
RESULTS
Considering agronomic performance a significant (P=0·009) mixture×system interaction was observed for annual DM yield (Table 4). Under the grazing system, the annual DM yield of WC+G was higher than all other mixtures. In contrast, no differences between WC+G and any other mixture could be found for the silage system. Considering the defoliation systems within each mixture, simulated grazing reduced the annual DM yield compared to the silage and grazing system.
Total annual DM yield, N yield and NEL yield of the different mixtures under different defoliation systems

* WC+G: white clover/grass; RC+G: red clover/grass; LG+G: lucerne/grass; BT+G: birdsfoot trefoil/grass.
A significant (P=0·044) mixture×system interaction was observed for the total annual N yield (Table 4). The BT+G produced lower N yield under simulated grazing and grazing compared to WC+G. Comparing the different defoliation systems within each mixture, higher N yield was only observed for WC+G for the grazing system. However, increasing legume proportion of any species was related to an increase in N yields of the mixtures (R 2=0·91, P<0·001 for silage, R 2=0·75, P=0·006 for simulated grazing and R 2=0·93, P<0·001 for grazing; Fig. 1).
The effect of legume annual DM yield on total annual DM yield (a–c) and N yield (d–f) of the different mixtures under different defoliation systems (silage: a, d; simulated grazing: b, e; grazing: c, f) of both experimental years. The abbreviations are: RC+G: red clover/grass-mixture; LG+G: lucerne/grass-mixture; BT+G: birdsfoot trefoil/grass-mixture; WC+G: white clover/grass-mixture. Each dot is an average over three replications within year.

A significant (P=0·031) mixture×system interaction for the total annual NEL yield was also observed (Table 4). Comparing the mixtures within defoliation systems, WC+G outperformed RC+G, LG+G and BT+G under grazing, while no differences were observed under silage cutting. BT+G was the only mixture that yielded less compared to WC+G in the simulated grazing system. For RC+G and BT+G, NEL yield under simulated grazing was lower compared to grazing or silage cutting.
The proportion of total annual DM yield represented by legume DM yield showed a significant (P=0·021) year×mixture×system interaction (Table 5). The legume proportion was a determinant for the DM yield in each mixture, except for grazing (R 2=0·83, P<0·001 for silage, R 2=0·56, P=0·021 for simulated grazing and R 2=0·12, P=0·209 for grazing; Table 5 and Fig. 1). Apart from WC+G, grazing decreased the legume proportion in all mixtures in comparison to the two cutting systems in 2004 (Table 5). The simulated grazing treatment resulted in higher legume proportion for all mixtures compared to silage cutting in 2005. Legume proportion of BT+G remained comparatively low in all defoliation systems in 2005. Weeds did not play an important role in any mixture and reached a proportion of 0·05–0·10 of the vegetation for the first harvest dates in some mixtures only.
Legume DM yield as the proportion of total annual DM yield of the different mixtures in 2004 and 2005 (s.e.m.=0·042)

* WC+G: white clover/grass; RC: red clover/grass; LG: lucerne/grass; BT: birdsfoot trefoil/grass.
Forage quality measures exhibited a significant year×mixture×system interaction for CP (P=0·01), NDF (P<0·001) and ADF (P=0·005) (Table 6). CP values varied from 99–199 g CP/kg DM. Compared to WC+G, BT+G had lower CP values under simulated grazing and under grazing. Under grazing, CP contents of RC+G and LG+G were higher than that of WC+G. In 2005, the silage cut showed lowest CP content for WC+G, RC+G and LG+G compared to the other systems. For WC+G, the CP content of the mixture under grazing did not differ from silage cut in both years. CP content was positively correlated with increasing legume proportion (R 2=0·77, P=0·003 for silage, R 2=0·51, P=0·028 for simulated grazing and R 2=0·92, P<0·001 for grazing; Fig. 2).
Contents of CP, NEL, NDF and ADF of the different legume/grass mixtures under the different defoliation systems

* WC+G: white clover/grass; RC+G: red clover/grass; LG+G: lucerne/grass; BT+G: birdsfoot trefoil/grass.
† Year×mixture×system: P=0·0632.
Impact of legume proportion (g/kg total DM) on total CP (g CP/kg DM) of the different legume/grass mixtures under (a) silage [y=0·15x+80·7]; (b) simulated grazing [y=0·11x+102·2] and (c) grazing [y=0·23x+79·2], where: WC+G: white clover/grass; RC+G: red clover/grass; LG+G: alfalfa/grass; BT+G: birdsfoot trefoil/grass. Each dot is an average over three replications within a year.

There was a significant (P=0·063) year×mixture×system interaction for the NEL content of mixtures (Table 6). Within defoliation systems, differences were only observed for BT+G under silage and simulated grazing cutting when compared to WC+G in 2004. The cell wall constituents varied considerably between legume species and the defoliation system, and for the two cell wall fractions in mixture within defoliation systems (Table 6). Higher NDF and ADF contents compared to WC+G occurred mainly for BT+G. In most cases, the silage cutting system resulted in higher cell wall constituents when compared to the simulated grazing system and the grazing system.
A significant year×mixture×system interaction was observed for FA (P=0·057) and FB (P<0·001), whereas only the mixture×system interaction was significant (P=0·004) for FC (Table 7). In the present study, in all mixtures and all defoliation systems, CP mainly consisted of FB, followed by FA, with FC representing the lowest proportion of CP, within a range of c. 50–110 g CP/kg CP. Differences to WC+G within defoliation systems mainly occurred for RC+G, showing lower FA and higher FC compared to WC+G. Grazing decreased the FA content of the mixtures compared to the simulated grazing system by, on average, 14% in both years. Consistent effects of the defoliation system on FB were observed in 2004 as grazing induced higher values compared to the cutting system for nearly all mixtures. In 2005, the effect of grazing on FB content for grazed mixtures almost disappeared. Contents of FC varied within mixtures and defoliation systems, but not between years. Differences between mixtures occurred mainly for RC+G, with higher values compared to WC+G for all systems (Table 7). In contrast, LG+G showed lower values for silage cut and grazing compared to WC+G. BT+G showed higher FC content compared to WC+G only under silage cutting. Grazing decreased FC content of all mixtures compared to the simulated grazing system by about 30–40%, while no differences between silage and simulated grazing were observed (Table 7).
Content of CP fractions of the different legume/grass mixtures under the different defoliation systems


* WC+G: white clover/grass; RC+G: red clover/grass; LG+G: lucerne/grass; BT+G: birdsfoot trefoil/grass.
DISCUSSION
The available N in soil through animal excreta (Schills et al. Reference Schills, Vellinga and Kraak1999; Trott et al. Reference Trott, Wachendorf, Ingwersen and Taube2004), the low persistence of the legume species under grazing, or a combination of both were essential factors for the differences between systems in the present study. The high agronomic performance of all mixtures under grazing compared to silage was probably a consequence of the increasing performance of the companion grass compensating for the lower legume yields (Table 5). In fact, with increasing N supply under grazing (Fig. 1), the gain in DM from the companion grass may have been higher than the DM loss of legume due to treading (Ennik Reference Ennik and Wright1981).
In the current study, grazing increased the NEL yield in almost all mixtures when compared to the simulated grazing, but not when compared to the silage cut (Table 4). A higher cutting frequency of the mixture seems to be disadvantageous for the NEL yield of legume–grass mixtures, confirming the results of other authors (Trott et al. Reference Trott, Wachendorf, Ingwersen and Taube2004; Skuodiene & Repsiene Reference Skuodiene, Repsiene, Lillak, Viiralt, Linke and Geherman2005). Assuming a lower regrowth rate in the simulated grazed management, which may be related to the lower N transfer from legumes, the companion grass could not compete with the forage legumes in this system. However, the increase in NEL yield is closely related to the total DM yield improvement over all systems and legume species (R 2=0·97, P<0·001). The high performance under grazing, although so frequently used as mixtures in the simulated grazing system, was probably caused by a high utilization efficiency of excreta N by the companion grass, resulting in the low WC proportion under grazing (Trott et al. Reference Trott, Wachendorf, Ingwersen and Taube2004). Nevens & Rehuel (Reference Nevens and Rehuel2003) mentioned the potential positive effect of nutrient return through animal excreta under grazing; however, in their study, effects of nutrient return were exceeded by negative effects like treading, selective grazing and frequent defoliation. The lower DM and NEL yield performances under grazing for sward mixtures of RC/grass, LG/grass and BT/grass compared to white clover/grass (WC+G) mixtures are also in accordance with findings of Brummer & Moore (Reference Brummer and Moore2000). In addition, treading may be also responsible for damage to legume plants such as RC and LG (Leach Reference Leach1983; Hermann et al. Reference Hermann, Russell and Barnhart2002). Although lower DM yield of LG/grass mixtures under grazing indicates less adaptation to this defoliation system, other authors have shown persistence under grazing of some LG cultivars (Kallenbach et al. Reference Kallenbach, Nelson and Coutts2002; Bouton & Gates Reference Bouton and Gates2003).
Forage quality varies greatly depending on species, botanical composition, maturity and growth conditions affecting animal performance (Buxton Reference Buxton1996; Yarrow & Penning Reference Yarrow and Penning2001; Deprez et al. Reference Deprez, Lambert, Decamps and Peeters2004). Differences between grasses and legumes are apparent in this regard. As illustrated in Fig. 2, the legume proportion in the present study was a determinant for the CP content of the mixture in all defoliation systems, but with different intensities. Legume proportion (DM basis) could explain the variation in CP content of the mixtures (Fig. 2), depending on the defoliation system. In the grazing system, 0·92 of the variation in legume content in the mixture explained the variation in CP content, which may be related to the N input by animal excrements and consequently the greater grazing days (Table 2). In fact, grasses are dependent on the available soil N, which may originate from the N transferred by forage legumes, plant debris or animal excrements. Under cutting, without additional N-input, legumes dominate in the sward and grasses are less competitive. In this case, the suitability of legume species relies on their adaptation to treading in grazing systems and to the cutting frequency to persist in cutting systems.
The increase in CP content of the mixtures was probably also influenced by the grazing days. Although the 2 years resulted in different amounts of grazing days, mostly explained by weather differences, the ranking of legume species is fairly similar, with BT having the lowest CP content and RC and LG the highest. These data suggest that the recycling of N in grazing systems through animal excreta is not only dependent on the amount of grazing days but also on the adaptation of the legume species to the grazing system, i.e. the achieved DM yield in mixture. Even in rotational grazing with the length of resting period suited to the mixture, regrowth rates are crucial for the productivity of forage legume mixtures. Accordingly, the high annual DM yield (1059 g DM/m²) of the WC mixture under grazing agrees with the findings of Williams et al. (Reference Williams, Abberton and Rhodes2003), who observed DM yields of 10·1–12·1 t DM/ha for several WC varieties in binary mixtures with perennial ryegrass under grazing. Because of its stoloniferous growth habit, WC is more tolerant towards frequent defoliation linked to a low stubble height compared to other legumes species (e.g. Vipond et al. Reference Vipond, Swift, Cleland, Fitzsimons and Hunter1997; Elgersma et al. Reference Elgersma, Nassiri and Schlepers1998; Frame Reference Frame2005).
Data comparing the protein quality of different legume/grass mixtures submitted to different defoliation systems according to its fractionation are scarce. Nevertheless, the FA values of the present study are consistent with the findings of Elizalde et al. (Reference Elizalde, Merchen and Faulkner1999), Shannak et al. (Reference Shannak, Südekum and Susenbeth2000) and Seguin et al. (Reference Seguin, Mustafa and Sheaffer2002). Seguin et al. (Reference Seguin, Mustafa and Sheaffer2002) also observed higher content of FA for LG compared to RC and Caucasian clover (Trifolium ambiguum M. Bieb.). Although not consistently observed throughout the two experimental years, the high contents of FA in LG mixtures might be unfavourable, suggesting that mixtures with LG may be disadvantageous with regard to the NUE in ruminant nutrition, when compared to WC mixtures.
As previous studies have observed, a low FA content for RC and BT (Broderick & Albrecht Reference Broderick and Albrecht1997; Cassida et al. Reference Cassida, Griffin, Rodriguez, Patching, Hesterman and Rust2000), decreasing proportion of FA and increasing proportion of FC for RC and BT mixtures were expected as a consequence of the condensed tannin content and the polyphenoloxidase activity of BT and RC, respectively. Because the forage legume in mixture is essential to obtain an improved protein quality in unfertilized swards, the positive influence on protein quality is mainly driven by the legume proportion in the mixture. This was observed in the present study. Whereas lower values of FA and higher values of FC were observed for RC compared to WC mixtures, differences between BT and WC were only observed for the simulated grazing in 2005. Such results are attributed to the low proportion of BT in mixture. Interestingly, grazing decreased FA and FC contents for nearly all mixtures compared to the cutting systems (Table 7). Due to the lower content of FC in grass, the decrease in FC content might be explained by the higher proportion of grass under grazing. Despite the lower legume proportion under grazing, changes in FC content between legume species may be related to the stress imposed at grazing compared to simulated grazing. Due to mechanical damage of grazed plants by treading of grazing animals, plants defence responses are induced (Eickler et al., Reference Eickler, Gierus, Kleen and Taubein press). This might involve the activation of oxidative enzymes such as polyphenoloxidase, peroxidase and lipoxigenase in plants at different intensities (Constabel & Ryan Reference Constabel and Ryan1998). After cell damage, polyphenoloxidase produces quinones, forming complexes with proteins, which may have resulted in the decreased FA of grazed plants and, especially for RC, an increased FC content (Table 7). The results suggest that using RC may lead to certain advantages in NUE. For BT, possible advantages due to its tannin content may have been reduced by the low legume proportion, especially under grazing. Although similar CP degradation rates of grasses and certain legumes have already been observed (Neutze et al. Reference Neutze, Smith and Forbes1993; Gierus et al. Reference Gierus, Herrmann and Taube2007), the defoliation system and the legume species in mixture are important to equilibrate the proportion of legumes in mixtures to avoid reduced NUE of ruminants.
Small differences in NEL content in the present experiment were observed in response to the defoliation system or forage legume species (Table 6). The values are within the ranges presented in the German feed tables for ruminants (Universität Hohenheim-Dokumentationsstelle 1997). With only few exceptions, all mixtures had at least 6 MJ NEL/kg DM, indicating the high-nutritional value of forage legume in mixture.
Mixtures containing upright growing legume species such as RC, LG and BT had higher NDF and ADF contents, which is in agreement with other authors (Sleugh et al. Reference Sleugh, Moore, George and Brummer2000; Mouriño et al. Reference Mouriño, Albrecht, Schaefer and Berzaghi2003; Nilsdotter-Linde et al. Reference Nilsdotter-Linde, Olsson, Hedqvist, Jansson, Danielsson and Christensson2004). High NDF and ADF contents reflect the higher stem proportion at sampling of mixtures compared to mixtures with the low-growing WC. However, such differences were observed only in silage cutting, where plants were harvested in a later development stage. The differences in NDF and ADF content between species may be confounded with the legume proportion in the mixture (Buxton Reference Buxton1996).
In conclusion, the legume proportion is an important feature for the forage quality as well as agronomic performance of different binary mixtures with legumes and grasses. WC was better adapted to the defoliation systems in the short-term, i.e. the first production year with grass. Due to its growth habit WC allows the companion grass to compete for light, and together with the transferred N resulted in improved N and NEL yields in comparison to the other mixtures.
BT did not persist under grazing and showed overall low N transfer to the companion grass, which resulted in low number of grazing days and N yield compared to WC. Unfortunately, the poor establishment of BT also resulted in unfavourable forage quality of the mixture and positive effects on protein quality were difficult to identify. Based on these results, BT/grass mixtures do not seem to be an appropriate alternative for WC/grass mixtures for the first production year in intensively managed swards. In contrast, the silage cut was more appropriate for BT under our conditions, where forage quality as well as yield performance were similar to RC and LG/grass mixtures.
While LG/grass mixtures showed equal or even higher forage quality, the results of CP fractionation indicate potential disadvantages on NUE. Particularly under grazing, higher CP contents and comparable high values for FA and lower values for FC of LG/grass mixtures compared to WC/grass mixtures may suggest high N losses to the environment. Consequently, on these grounds, LG/grass mixtures would not be an appropriate alternative for WC/grass mixtures.
For RC/grass mixtures, low proportion of FA, and higher proportion of FC indicated certain potential advantages for higher NUE using this forage legume. From the point of view of forage quality and performance, RC might be an alternative to WC in binary mixtures with grass for the first production year.
We thank the Wilhelm-Schaumann-Stiftung for the financial support of this study. We are indebted to Dr R. Loges for assistance in the NIRS analysis and K. Makoben for laboratory assistance. We also thank Dr G. Rave for assistance in the statistical analyses.



