INTRODUCTION
Winter wheat (Triticum aestivum L.) is widely cultivated in northern China, particularly on the Huanghuaihai Plain, which is one of the major winter wheat production areas in the country. However, high winter wheat yields in this area are limited by water shortages. For example, Tai'an is characterized by a warm temperate semi-humid continental monsoon climate; this region receives precipitation that typically reaches a maximum level of 200 mm during the winter wheat growing season. However, this precipitation level does not satisfy the requirements of winter wheat (Sacks et al. Reference Sacks, Deryng, Foley and Ramankutty2010), thus indicating that high yields depend primarily on irrigation. Half of global wheat production occurs in irrigated cropping regions that face increasing water shortages (Ramírez-Rodrigues et al. Reference Ramírez-Rodrigues, Alderman, Stefanova, Cossani, Flores and Asseng2016). For example, the Yaqui Valley is one of the most important wheat-producing areas in Mexico, comprising approximately 2 25 000 ha of irrigated cropland cultivated mainly during the winter season (Ortiz-Monasterio & Raun Reference Ortiz-Monasterio and Raun2007). The lack of surface water sources for irrigating the rapidly expanding wheat cultivation area has triggered a massive exploitation of groundwater resources (Sun et al. Reference Sun, Shen, Yu, Flerchinger, Zhang, Liu and Zhang2010); as a consequence, water levels have decreased and environmental problems have developed (Xia et al. Reference Xia, Liu and Jia2005). Agriculture is thus faced with the challenge of ensuring global food security by increasing yields, while minimizing environmental problems (Foley et al. Reference Foley, Ramankutty, Brauman, Cassidy, Gerber, Johnston, Mueller, O'Connell, Ray, West, Balzer, Bennett, Carpenter, Hill, Monfreda, Polasky, Rockström, Sheehan, Siebert, Tilman and Zaks2011; Tilman et al. Reference Tilman, Balzer, Hill and Befort2011). Therefore, water-saving agricultural techniques must be applied to prevent further overexploitation of groundwater resources and increase the yields of essential crops. Researchers have developed numerous effective irrigation patterns to achieve these initiatives such as limited irrigation, sub-surface drip irrigation and sprinkler irrigation (Kang et al. Reference Kang, Zhang, Liang, Hu, Cai and Gu2002; Payero et al. Reference Payero, Tarkalson, Irmak, Davison and Petersen2008; Thompson et al. Reference Thompson, Pang and Li2009; Abd El-Wahed & Ali Reference Abd El-Wahed and Ali2013).
Planting patterns such as row spacing and furrow planting can affect farmland microclimate, evapotranspiration (ET), yield and water productivity (WP). Li et al. (Reference Li, Hou, Jia, Han, Ren and Yang2013) determined that straw mulching and ridge mulching increased yields significantly; these techniques are beneficial for growing maize because soil temperature and moisture can be increased in rainfed areas. Appropriate row spacing can also affect the microclimate of winter wheat farmland (Eberbach & Pala Reference Eberbach and Pala2005). Verachtert et al. (Reference Verachtert, Govaerts, Lichter, Sayre, Ceballos-Ramirez, Luna-Guido and Dendooven2009) applied bed cultivation as an effective planting pattern to increase wheat and maize grain yields in Mexico. Deficit irrigation is another optimization strategy for reducing water usage and increasing water-use efficiency (Soundharajan & Sudheer Reference Soundharajan and Sudheer2009). Environmental factors such as light, water, soil temperature and relative humidity (RH) can affect crop growth (Wang et al. Reference Wang, Zhang, Zhou, Liu and Chen2015). Wang et al. (Reference Wang, Zhou and Chen2016) demonstrated that furrow planting and irrigation had a significant effect on ET, WP and grain yield. Therefore, the microclimate of winter wheat farmland utilizing deficit irrigation and various planting patterns should be investigated by applying precision sowing.
The present study aimed to improve the microclimate, support crop growth and increase yields and WP by applying precision sowing and deficit irrigation to winter wheat fields in northern China. This 3-year field experiment aimed to determine the effects of precision planting patterns combined with deficit irrigation conditions on: (i) farmland microclimates, including air and soil temperatures, RH, intercepted photosynthetically active radiation (iPAR), as well as (ii) winter wheat grain yields, ET and WP in northern China.
MATERIALS AND METHODS
Characterization of environmental conditions
This experimental research was conducted between 2011 and 2014 at the Agronomy Experimental Station of Shandong Agricultural University, Tai'an, China (36°10′N, 117°09′E, 134 m a.s.l.). This location is within the major winter wheat-producing region of the Huanghuaihai Plain.
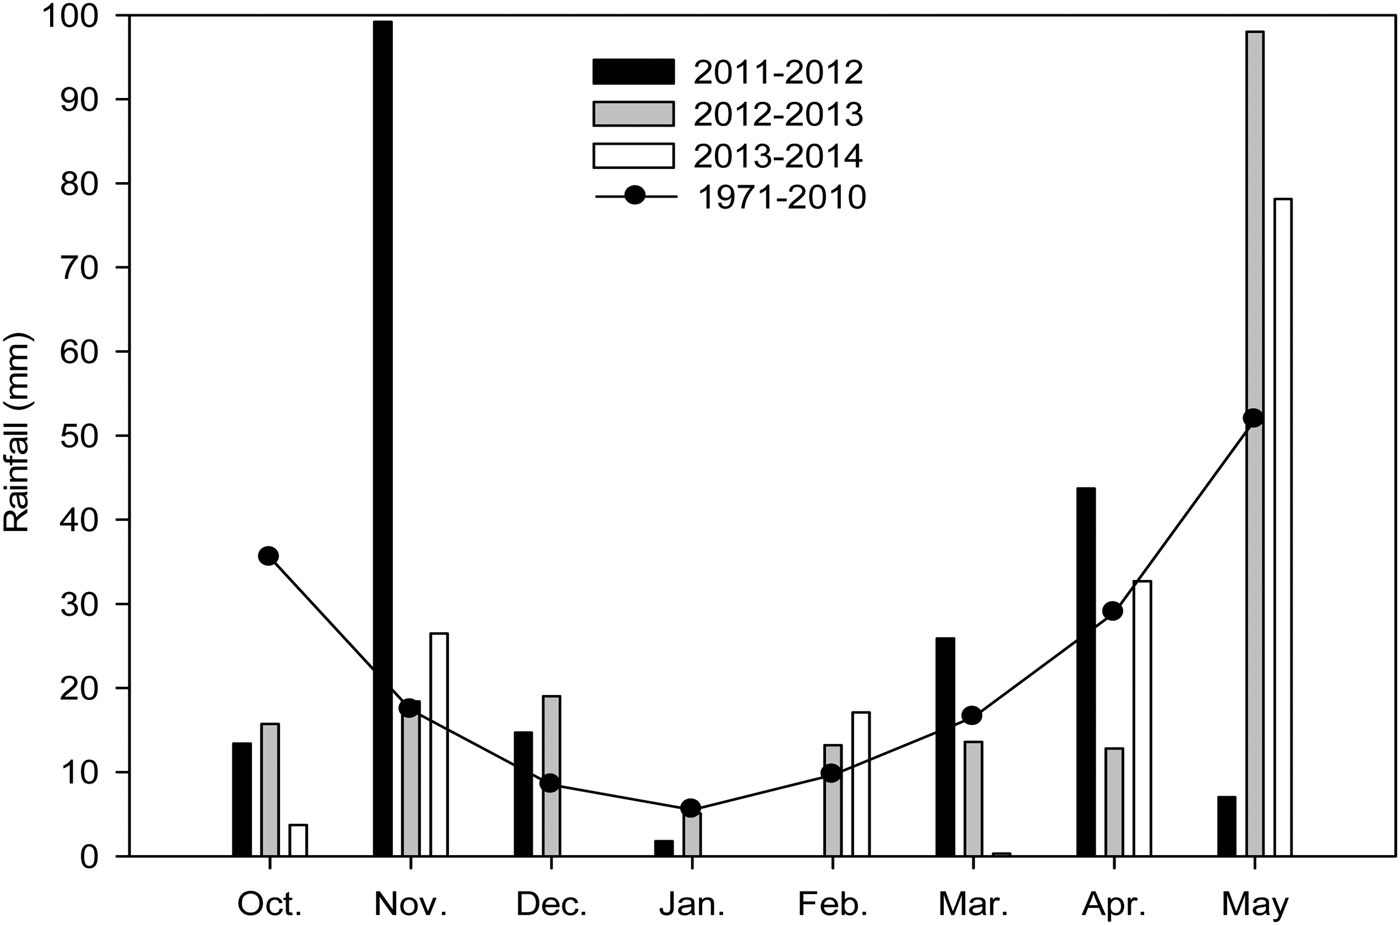
The area is characterized by a warm sub-humid continental monsoon climate. The mean temperature during the winter wheat growing season (October–June) is 15·1 °C with a maximum temperature of 26·2 °C in July and a minimum temperature of −1·7 °C in January. The average annual precipitation from 1971 to 2010 was 693·5 mm and 0·53 of the total precipitation was recorded in July and August throughout these years. The average annual sunshine was 2627 h and 196 days were frost free. Precipitation and solar radiation during the winter wheat growing seasons (from sowing to harvesting) were 205·8 mm and 2803 MJ/m2 in 2011/12, 195·8 mm and 2961 MJ/m2 in 2012/13 and 158·4 mm and 3245 MJ/m2 in 2013/14, respectively. Monthly rainfall and long-term average rainfall values are shown in Fig. 1. All weather data were collected at the Tai'an Agrometeorological Experimental Station, 500 m from the experiment site.
Monthly rainfall during the winter wheat-growing season in comparison with the long-term average 1971–2010.

Experiments were conducted in a silt loam soil with an average soil organic matter content of 16·3 g/kg, a total nitrogen (N) content of 1·3 g/kg, an available potassium (K) content of 95 mg/kg and an available phosphorus (P) content of 35 mg/kg at a pH of 6·9. These parameters were measured from a composite dried soil sample obtained from 0 to 20 cm soil depth.
Experimental design
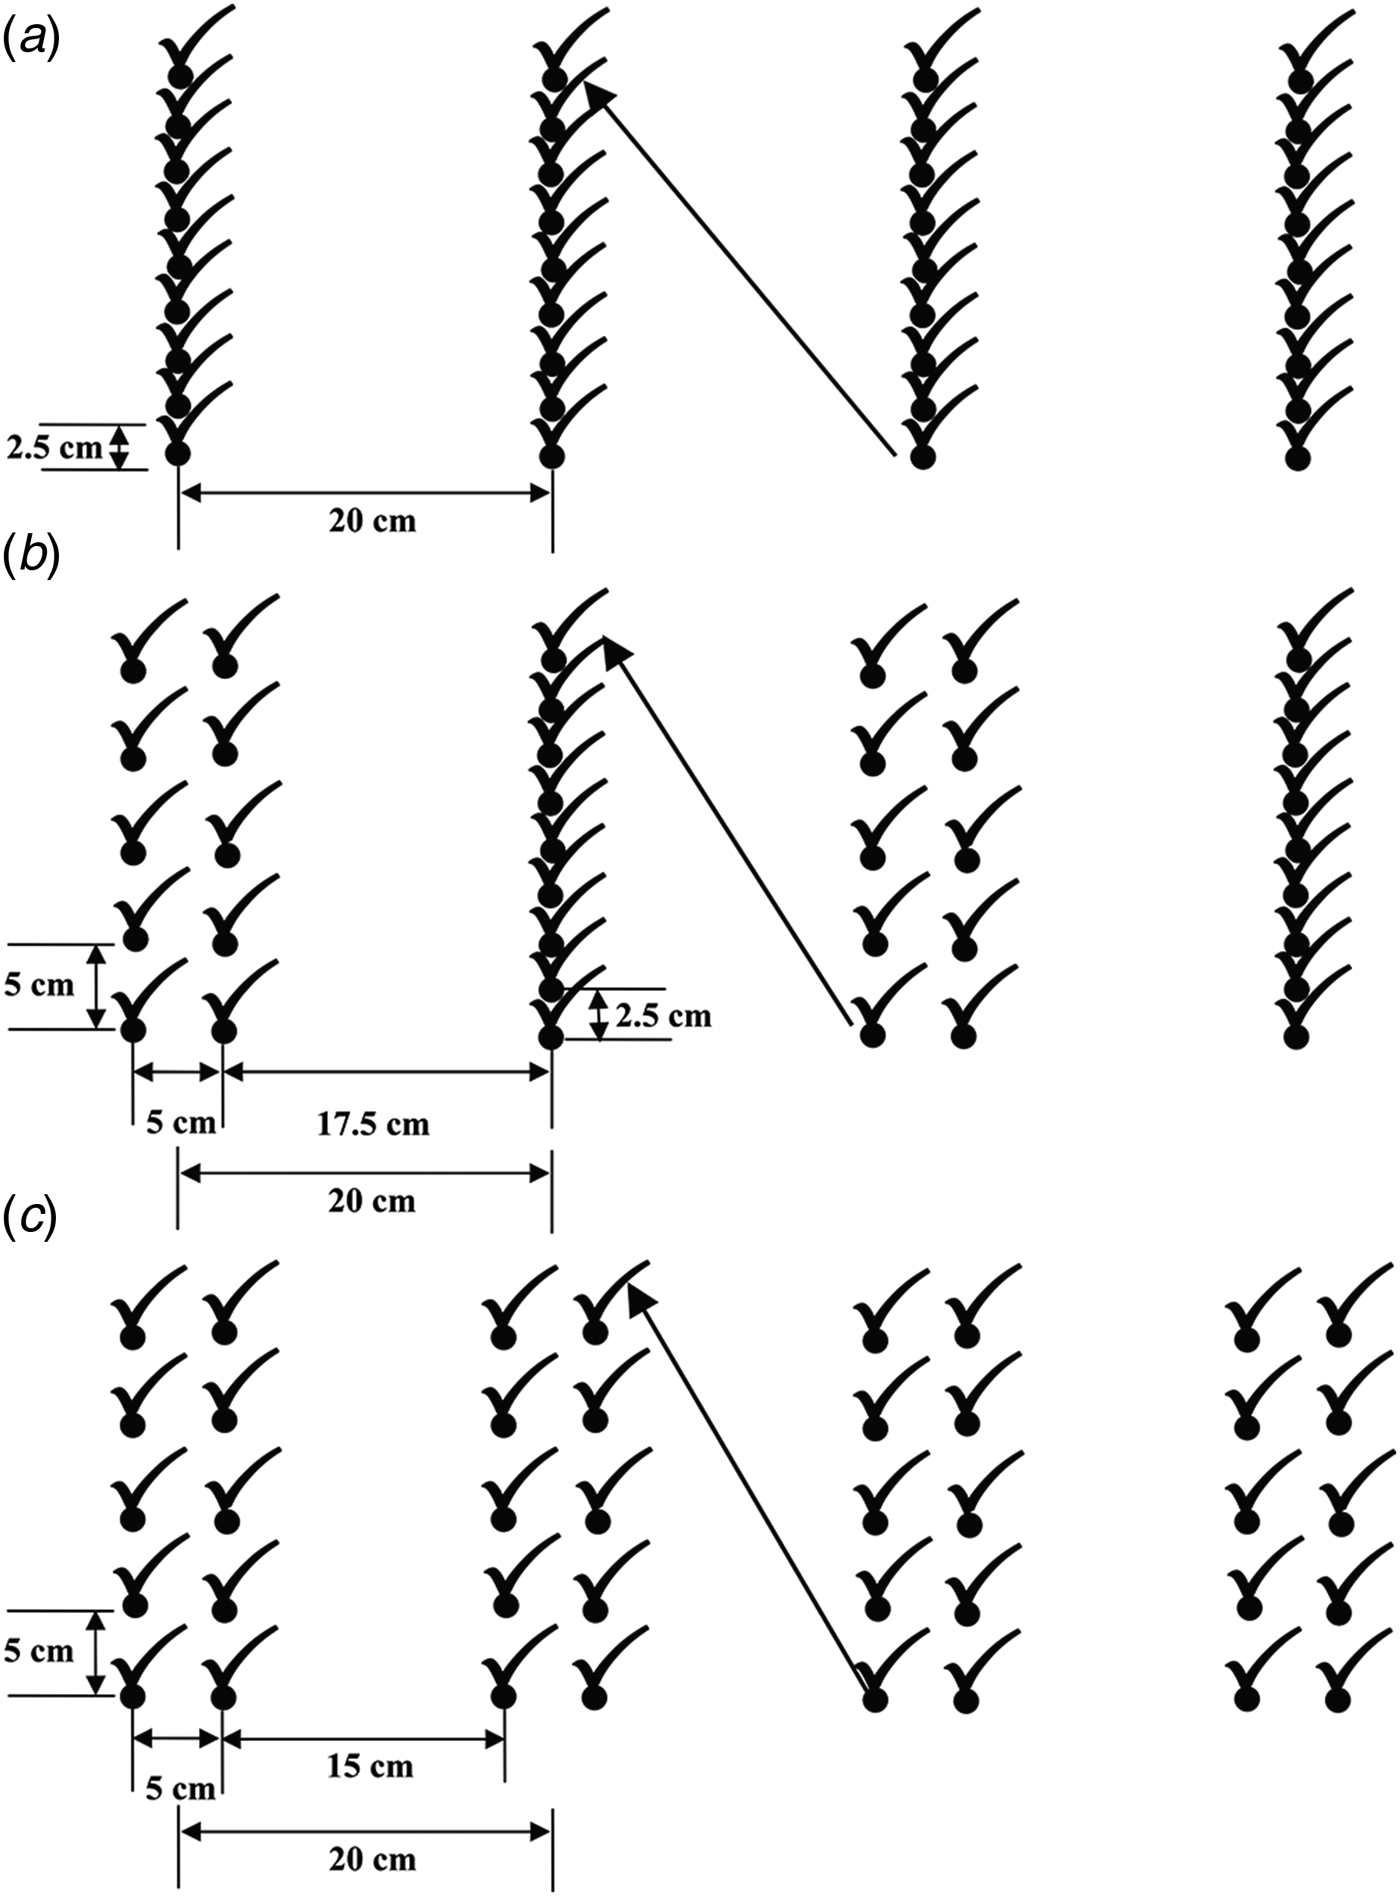
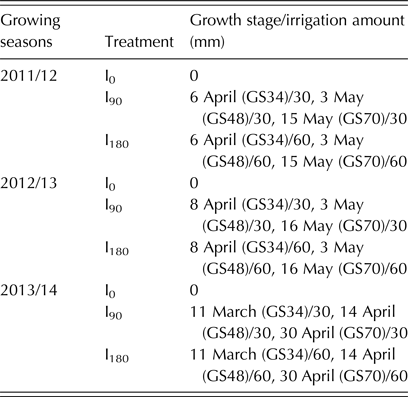
The research was conducted using a two-factor split-plot design. During the winter wheat growing season, annual rainfall was usually <200 mm and ET was >400 mm (Rizza et al. Reference Rizza, Ghashghaie, Meyer, Matteu, Mastrangelo and Badecke2012; Zhang et al. Reference Zhang, Zhou and Chen2016); thus, irrigation was needed to achieve high and stable winter wheat production. The main plot was exposed to the following three irrigation conditions: 0 mm (I0), 90 mm (I90) and 180 mm (I180); under I0, no irrigation was provided and the crop was rainfed only. The schedule and amounts of irrigation in 2011–14 are presented in Table 1. One-third of the total amount of irrigation was readily accessible and supplied to the culture pool directly from an outlet pump via plastic pipes. Concrete slabs, 15 cm wide, were placed at a depth of 200 cm on all sides of each plot and 0·1-mm-thick plastic film was placed along the concrete wall to prevent the lateral flow of soil water; all sides also protruded 10 cm above ground level to prevent runoff. The split-plot was designed for the following three precision planting patterns (Fig. 2): single row, alternating single and twin rows (hereafter referred to as ‘single–twin’), and twin row. Each experimental plot area was 3 × 3 m and each treatment was replicated three times.
Precision planting pattern schematic diagram. (a) single row; (b) single–twin row; (c) twin row. The arrows represent diagonal approach for measuring photosynthetically active radiation.

Treatments with timing, growth stage and irrigation amounts for winter wheat in 2011–14

The present study was part of an ongoing winter–summer maize rotation experiment. Winter wheat ‘Jimai 22’ was hand-planted at a density of 4 × 10⁶ plant/ha on 9 October 2011, 10 October 2012 and 9 October 2013 after maize had been harvested manually and stubble removed. In order to ensure the germination rate, two wheat seeds were sown in every hole; the seedlings were thinned by hand at 15 days after emergence to obtain a final population density of 2 × 10⁶ plant/ha. Before sowing the winter wheat, 261 kg/ha of di-ammonium phosphate, 384 kg/ha of urea and 210 kg/ha of K sulphate were applied as base fertilizers. Half of the total N (urea) was applied as a base fertilizer and top-dressing during the stem elongation stage (growth stage (GS) 30, Zadoks et al. Reference Zadoks, Chang and Konzak1974). In order to ensure seedling emergence under heavy drought, each plot was irrigated to 40 mm at sowing in 2013. Each plot contained 15 rows of winter wheat. The crops were harvested on 9 June 2012, 8 June 2013 and 5 June 2014.
Characterization of farmland microclimate
Diurnal soil temperatures were measured at GS49 and GS71 every 2 h on sunny days between 8 : 00 h and 16 : 00 h at a 5-cm soil depth with a geothermometer. In addition, RH at GS35, GS49, GS80 and the air temperature at GS49 and GS71 were measured for three replicates at 5 and 50 cm above the ground level in the same inter-row space with a Pocket Weather Tracker Kestrel 4000 (Nielsen–Kellerman Co., Boothwyn, USA). The position of the canopy was approximately 50 cm above ground level. A SunScan CAS (Delta T Devices Ltd., Cambridge, UK) was used to determine PAR. A 1·5-m linear sensor was placed diagonally to the inter-row to measure PAR at ground level at GS49 and GS71, for three replicates.
Evapotranspiration, grain yield and water productivity
The ET level was calculated using the soil water balance equation (Zhang et al. Reference Zhang, Kang, Ward, Ding, Zhang and Zheng2011);
 $$ET{\rm = \Delta} S + I + P - R - D$$
where ET is the evapotranspiration (mm) and ΔS is the change of soil water stored (mm) as measured to a soil depth of 120 cm. I is the amount of irrigation water (mm), P is precipitation (mm), R is surface runoff (mm), which was not found in the current experiment based on the current observation, and D is the downward flux below the crop root zone. The maximal soil moisture was found in the 120 cm soil layer after irrigation with 60 mm water: the mean value was 34·0, 33·2 and 32·8% at GS34, GS48 and GS70 in the 2011–14 growing seasons and was 31·5% after maximal daily rainfall (50·1 mm) on 26 May 2013, which was below field capacity (38·6%), D was ignored. Therefore, ET was calculated by using ΔS, I and P.
The crop yields of plots (area of 2 m2) were measured and data converted into yield (kg/ha). The WP formula was outlined as follows (Neal et al. Reference Neal, Fulkerson and Sutton2011):
 $$WP= Y/ET$$
where Y was the grain yield (kg/ha) of winter wheat.
Statistical analysis
All graphs were drawn with SigmaPlot 10·0 (SPSS Inc., Chicago, USA) and all data were analysed using the FIXED model via ANOVA. The planting pattern and water condition and their interaction effects were considered as fixed effects, and replication was considered as a random effect. Each site-year was considered as a fixed effect, where were unique based solely on the same site. The means were used in the Duncan's multiple range test. Effects were considered significant at P < 0·05 in statistical calculations.
RESULTS
Relative humidity at 5 and 50 cm above ground level
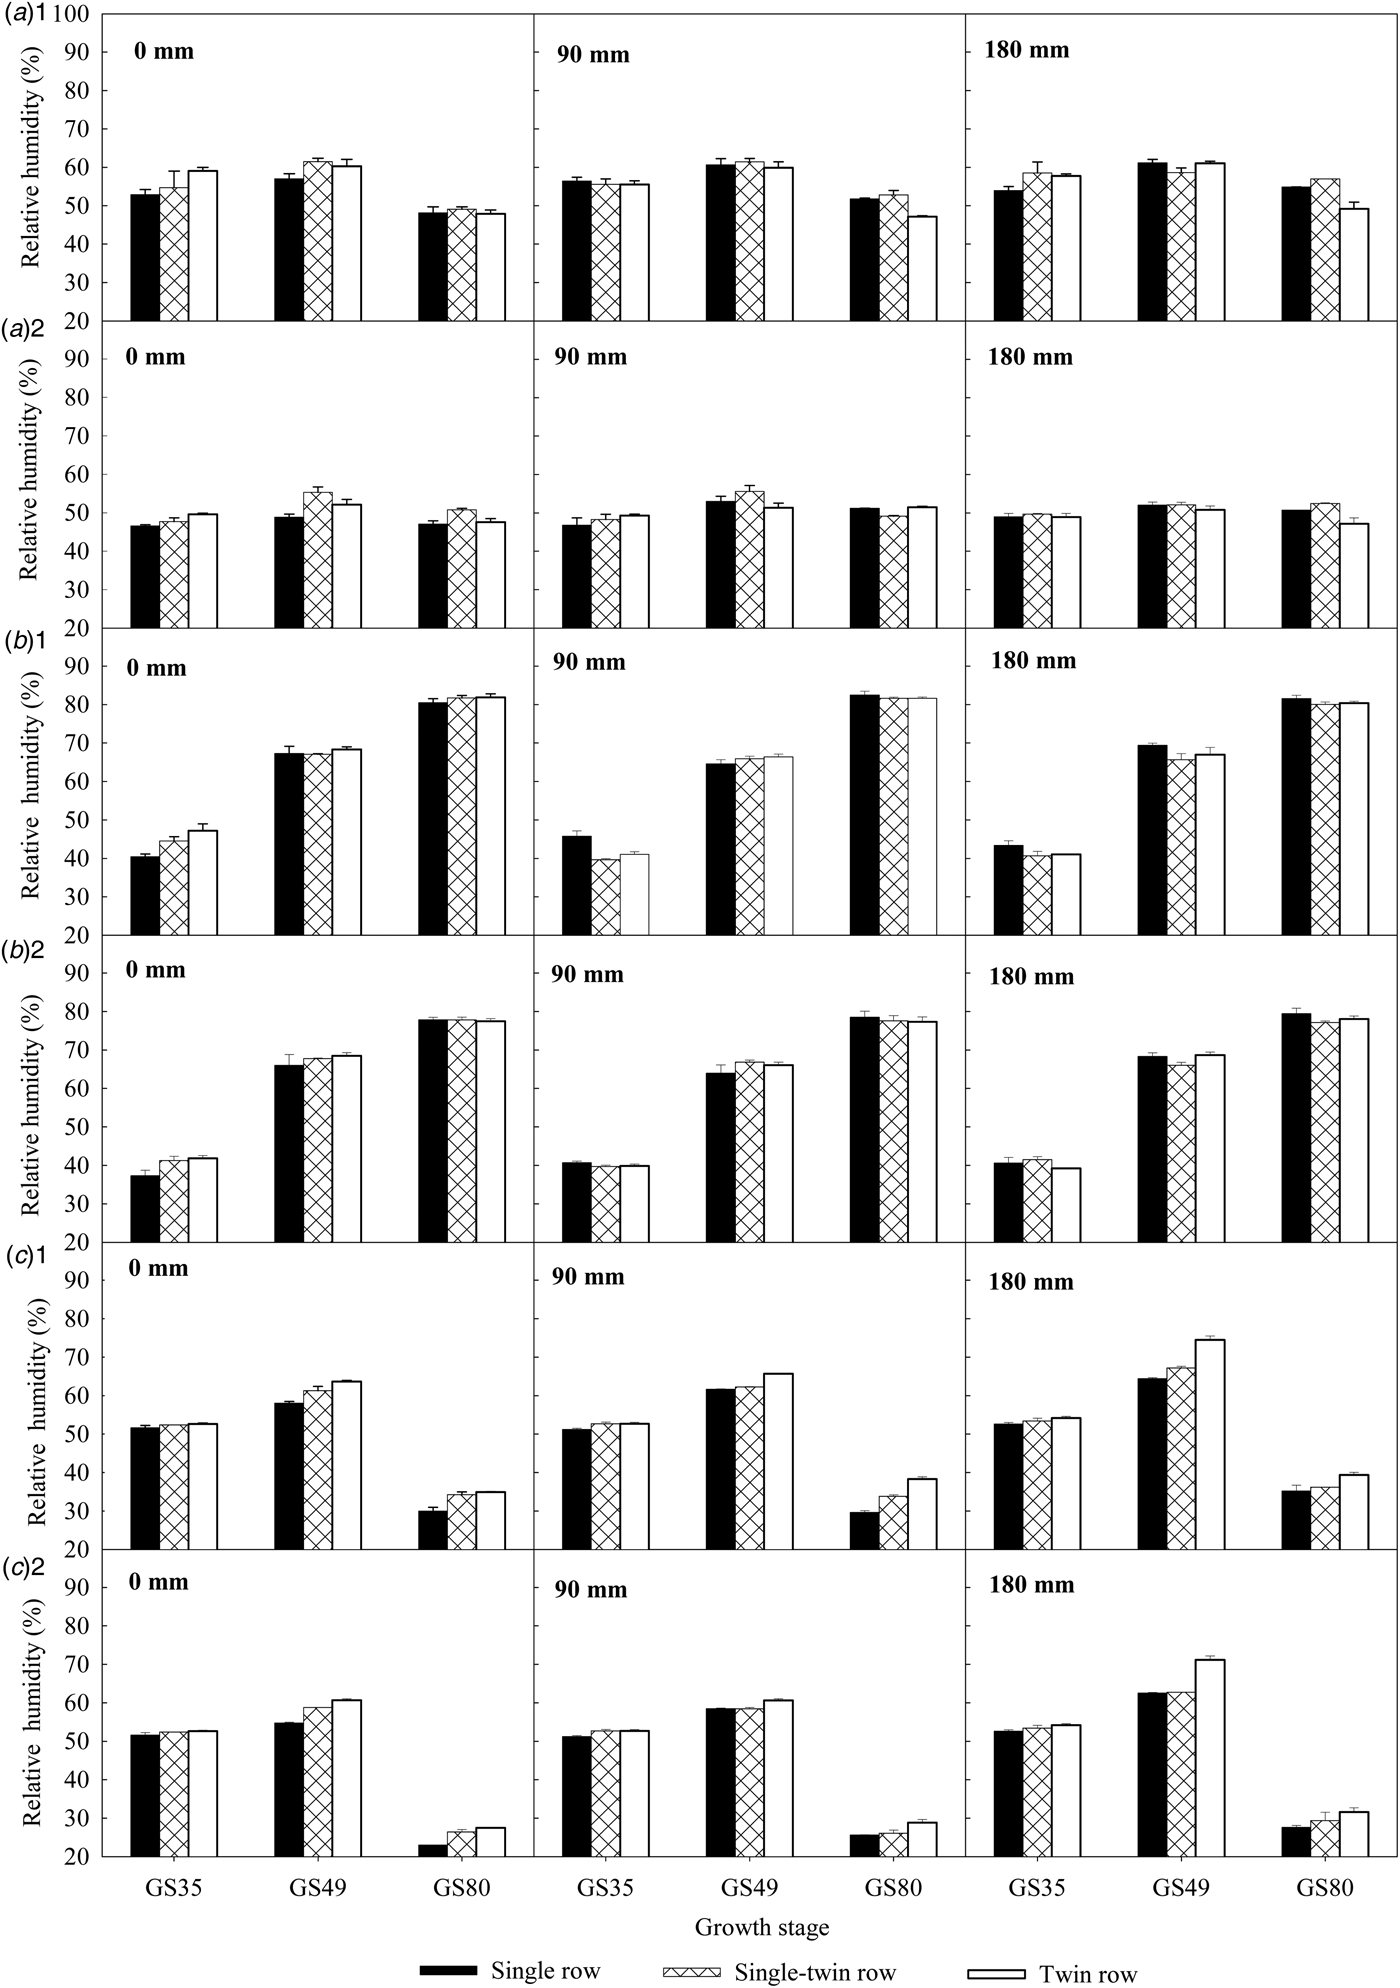
During the winter wheat growing seasons, at the same growth stage, RH was different at 5 and 50 cm above ground level for different precision planting patterns (Fig. 3). The RH of the twin row at 5 and 50 cm above ground level were significantly higher than that of the single row at I0 (P < 0·05); the RH levels at I90 and I180 did not differ significantly among the precision planting patterns. The average RH levels of the single, single–twin and twin rows were 52·3, 53·9 and 52·6% in 2011/12, 62·7, 62·4 and 62·9% in 2012/13 and 44·0, 42·3 and 47·5% in 2013/14, respectively. Thus, the average RH of the twin row pattern was higher than those of the other precision planting patterns.
Effects of planting pattern and irrigation on relative humidity of different growth stages. (a)1 and (a)2 were 5 cm and 50 cm above-ground in 2011/12, (b)1 and (b)2 were 5 cm and 50 cm above-ground in 2012/13, (c)1 and (c)2 were 5 cm and 50 cm above-ground in 2013/14; 0 mm, 90 mm, 180 mm were the irrigation amounts; bars = s.e.

The average RH levels at the I0, I90 and I180 conditions were 52·0, 53·1 and 53·6% in 2011/12, 62·6, 62·7 and 63·0% in 2012/13 and 43·3, 45·2 and 49·6% in 2013/14, respectively. The average RH levels at the I90 and I180 conditions were 2·1 and 3·1% (2011/12), 0·2 and 0·6% (2012/13) and 4·4 and 14·5% (2013/14) higher than that of the I0 condition, respectively.
The results obtained from 2011 to 2014 showed that the RH at both 5 and 50 cm above ground level increased as the amount of irrigation increased. At the same level of irrigation, the RH of the single row was significantly lower than those of the single–twin and twin rows (P < 0·05).
Diurnal air temperature at 50 cm above ground level
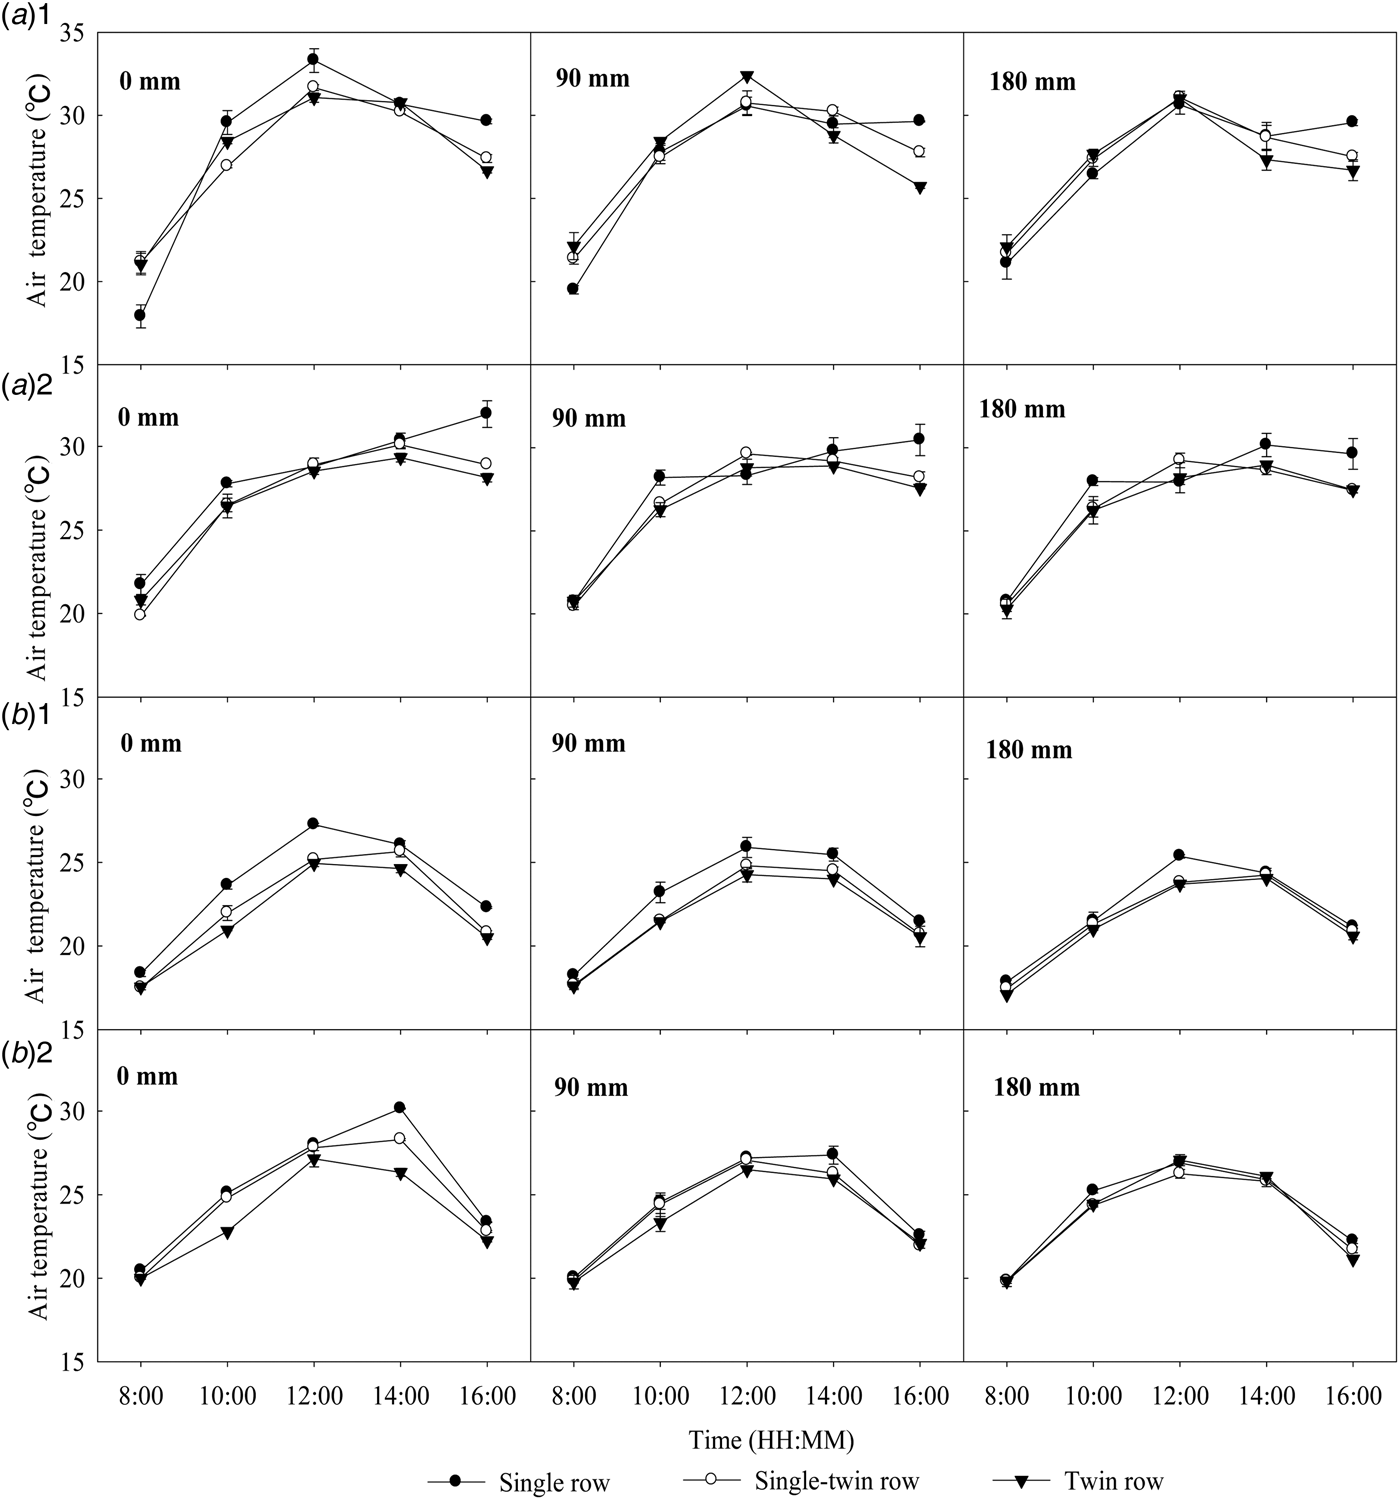
The change in diurnal air temperature at 50 cm above ground level showed a ‘∩’-shaped trend (Fig. 4). In 2012/13, the highest GS49 diurnal air temperature was obtained at 12 : 00 h and the diurnal air temperature was lower in the twin row than in the single and single–twin rows; the average diurnal air temperatures at I0, I90 and I180 were 27·8, 27·5 and 27·2 °C, respectively. The highest GS71 diurnal air temperature was obtained at 14 : 00 h and the average diurnal air temperatures at I0, I90 and I180 were 27·2, 26·9 and 26·6 °C, respectively.
Effects of planting patterns and irrigation on diurnal air temperature above-ground at 50 cm. (a)1 and (a)2 were GS49 and GS71 in 2012/13 and (b)1 and (b)2 were GS49 and GS71 in 2013/14; 0 mm, 90 mm, 180 mm were irrigation amounts; bars = s.e.

In 2013/14, the highest GS49 diurnal air temperature was obtained at 12 : 00 h and the diurnal air temperature was significantly lower in the twin row than in the single and single–twin rows (P < 0·05); the average diurnal air temperatures at I0, I90 and I180 were 22·5, 22·1 and 21·6 °C, respectively. The changes in diurnal air temperature at GS71were similar to those at GS49, when the diurnal air temperature of the twin row was significantly lower than that of the single row (P < 0·05); the average diurnal air temperatures at I0, I90 and I180 were 24·6, 23·9 and 23·8 °C, respectively.
The results obtained over 2 years showed that air temperature gradually decreased as the amount of irrigation increased. In addition, twin row and single–twin row patterns reduced the air temperature of the crop canopy.
Soil temperature at 5 cm depth
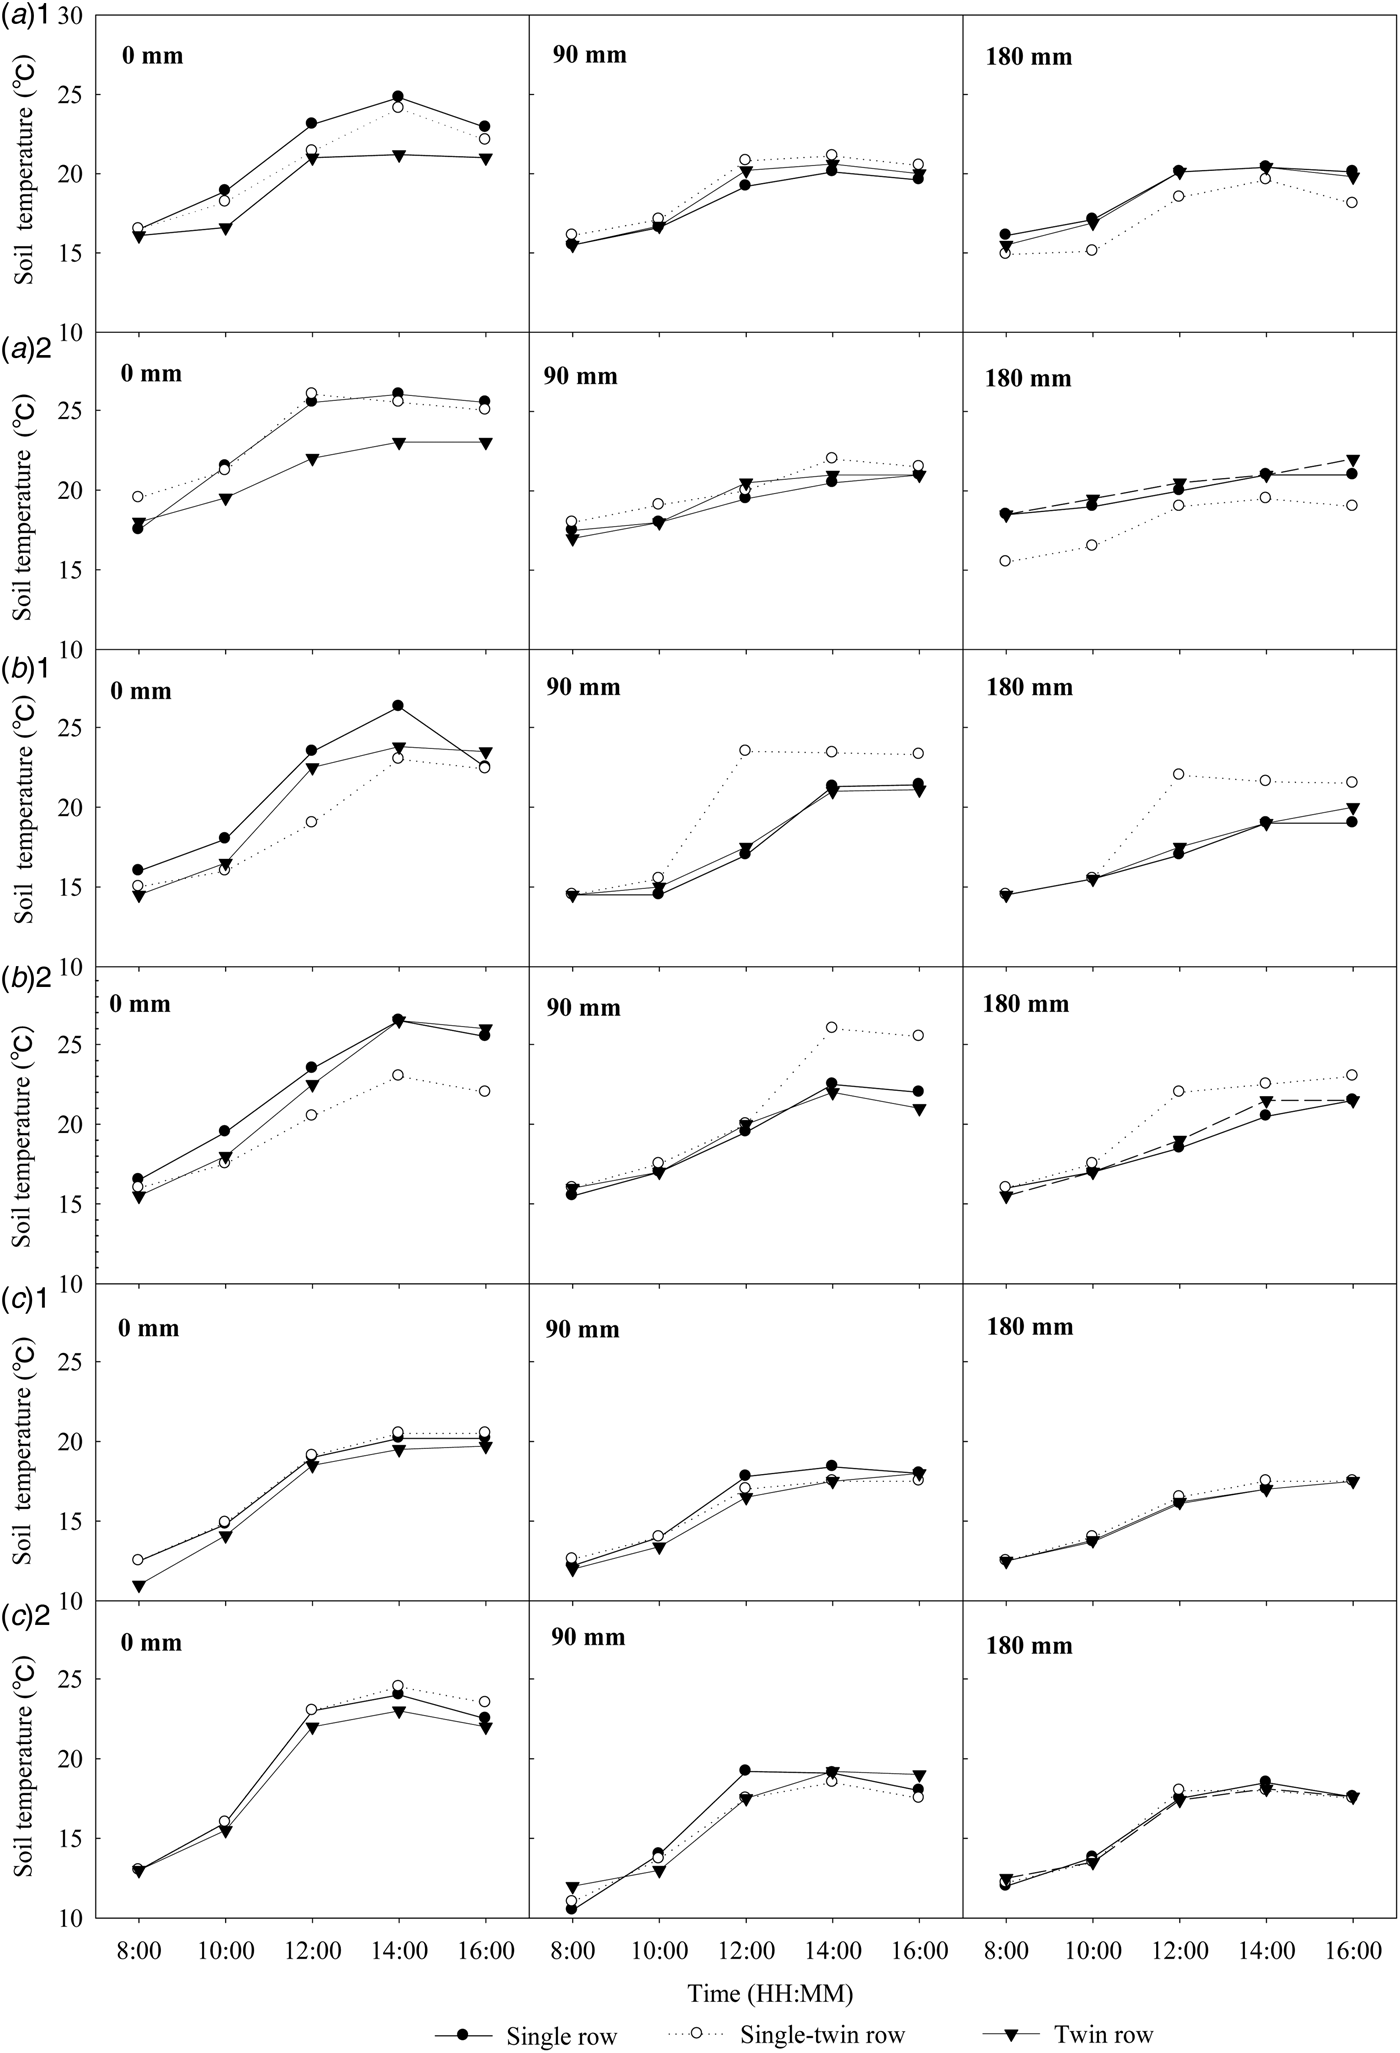
The soil temperature at 5 cm depth was higher in the afternoon than in the morning for all planting patterns. The maximum temperature was obtained at 12 : 00 h to 14 : 00 h from 2011 to 2014 (Fig. 5). The 5-cm soil temperatures at GS49 were lower than at GS71 for the same irrigation amount and high irrigation decreased soil temperatures. Soil temperatures of the single, single–twin and twin rows were 19·4, 18·9 and 18·8 °C (GS49), 20·8, 20·5 and 20·3 °C (GS71) in 2011/12, 18·7, 19·4 and 18·4 °C (GS49), 17·4, 17·2 and 17·0 °C (GS71) in 2012/13, 16·3, 16·3 and 15·8 °C (GS49), 17·3, 17·2 and 17·0 °C (GS71) in 2013/14, respectively.
Effects of planting patterns and irrigation on the 5 cm soil temperature. (a)1 and (a)2 were GS49 and GS71 in 2011/12, (b)1 and (b)2 were GS49 and GS71 in 2012/13, (c)1 and (c)2 were GS49 and GS71 in 2013/14; 0 mm, 90 mm, 180 mm were irrigation amounts.

The 3 years of experimental results showed that, in general, soil temperature decreased as the amount of irrigation increased. In addition, the twin row precision planting pattern promoted a decrease in soil temperature.
Proportion of intercepted photosynthetically active radiation
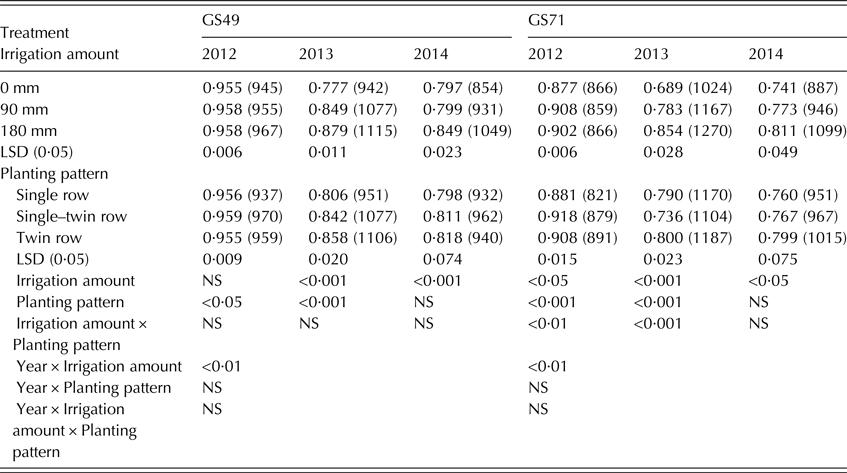
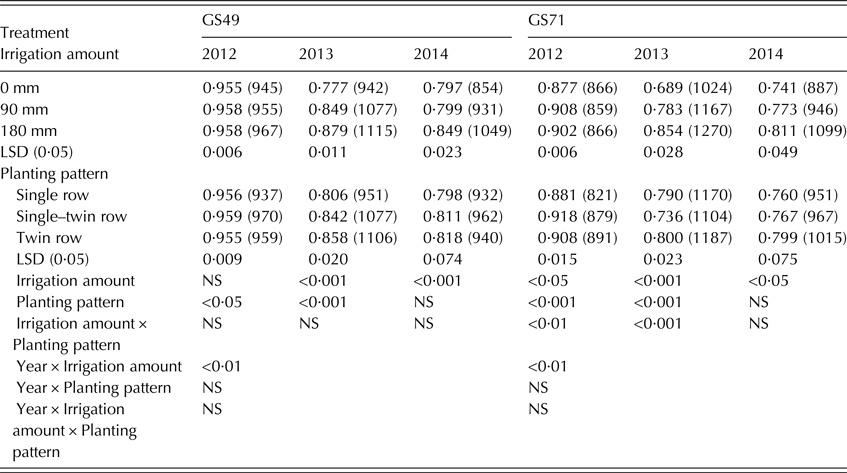
During the 2011 to 2014 winter wheat growing seasons, the single–twin and twin row iPAR were generally higher than the single row (Table 2). In 2012/13, the GS49 iPAR was significantly higher in the single–twin and twin rows than in the single row (P < 0·05). In 2013/14, the iPAR was significantly lower in the single row than in the single–twin and twin rows under I180 (P < 0·05).
Effects of irrigation amount and planting pattern on the proportion of intercepted photosynthetically active radiation and amount (μmol/m2/s, in brackets) in 2011–14
NS, not significant.
The results of the 3-year experiment showed that the iPAR increased with increased irrigation. The twin row planting pattern maintained a higher iPAR than those of the other two planting patterns. Irrigation significantly affected iPAR except at GS49 in 2012 (P < 0·05) and planting pattern significantly affected iPAR (P < 0·05) except at GS49 and GS71 in 2014. The planting pattern and irrigation interaction significantly affected iPAR at GS71 in 2012 and 2013 (P < 0·01). Year × irrigation amount significantly affected iPAR during 2011–14 (P < 0·01).
Yield, evapotranspiration and water productivity
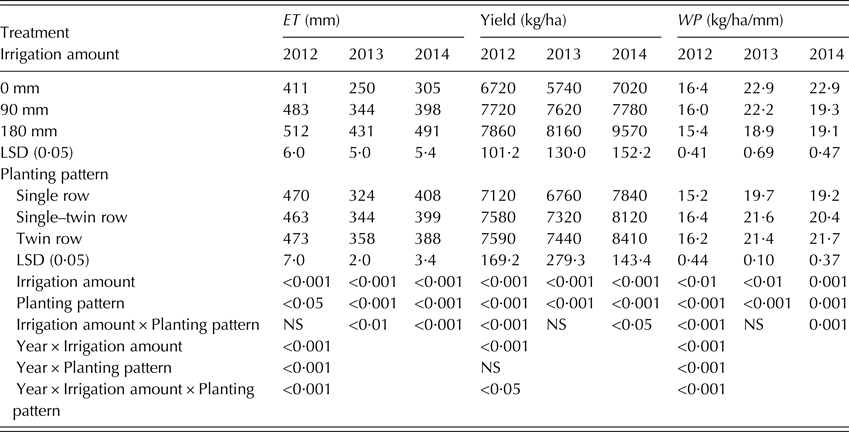
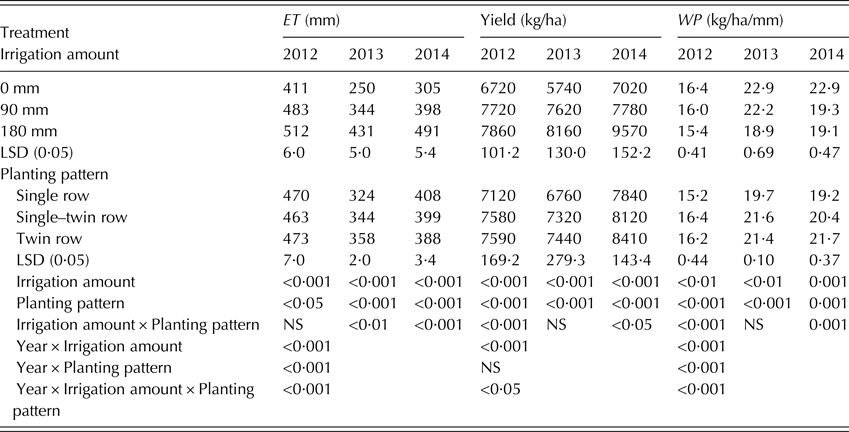
The results of the 3-year experiment showed that precision planting patterns and irrigation treatments significantly affected crop yield, ET and WP (Table 3). Planting pattern and irrigation had a significant effect on grain yields in 2013 and 2014 and the planting pattern and irrigation interaction significantly affected grain yields in 2012 and 2014 (P < 0·05). Compared with I0, I90 increased yield by 17·2 (2012), 32·2 (2013) and 10·8% (2014), respectively; compared with I90, I180 decreased yield by 5·2% in 2012, but increased it by 7·1 and 23·0% in 2013 and 2014, respectively. Grain yields in the twin row were significantly higher than those of the single row in all 3 years (P < 0·05), whereas no significant difference was noted between the twin and single–twin rows in 2012 and 2013. The order of grain yields for the three precision planting patterns was twin row > single–twin row > single row. Therefore, the twin row and single–twin row patterns increased crop yield.
Effects of planting pattern and irrigation amount on grain yield of winter wheat in 2011–14
NS, not significant.
Evapotranspiration increased gradually with increased irrigation levels (P < 0·05). Compared with I90 levels, the I180 levels increased ET by 5·6 (2012), 24·1 (2013) and 23·4% (2014), respectively; compared with I0 levels, the I90 levels increased ET by 18·0 (2012), 36·4 (2013) and 30·5% (2014), respectively. The ET means (from 2011 to 2014) of the single, single–twin and twin rows were 400·7, 402·0, and 406·3 mm, respectively. The WP decreased with increasing irrigation amount: at I180 it was 6·0, 16·8 and 0% lower than that of I90 in 2012, 2013 and 2014, respectively, while the WP of I90 was 0·6, 2·8 and 15·2% lower than that of I0 in 2012, 2013 and 2014, respectively. In 2012 and 2014, the WP of twin and single–twin rows was significantly higher than the single row (P < 0·05). In 2014, the WP of the twin row was 1·0 and 5·7% higher than the single–twin and single row, respectively. A variance analysis indicated that irrigation conditions and planting patterns had a significant effect on ET, yield and WP in all 3 years (P < 0·05). Irrigation and planting pattern significantly affected ET, yield and WP in 2012–14 (P < 0·01 and P < 0·05, respectively). The irrigation and planting pattern interaction had a significant effect on ET in 2013 and 2014 (P < 0·005) and on yield (P < 0·05) and WP (P < 0·001) in 2012 and 2014. Year × irrigation amount, year × planting pattern, and year × irrigation amount × planting pattern had a significant effect on ET, yield and WP (P < 0·05), but year × planting pattern had no significant effect on yield.
Relationship between microclimate, water productivity and yield
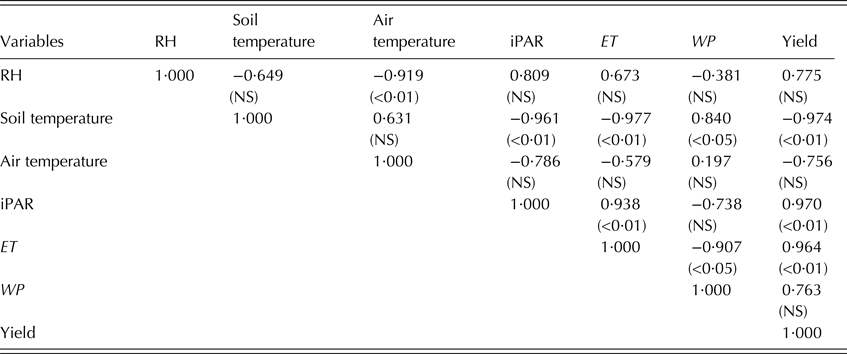
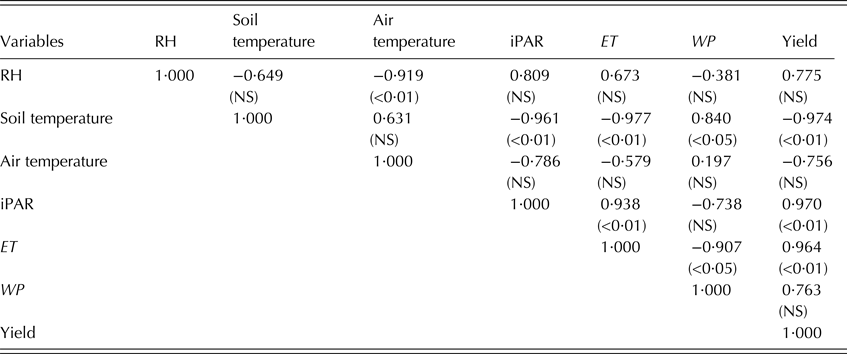
Relative humidity was significantly and negatively correlated with air temperature (Table 4) (r 2 = −0·919, P < 0·01) and only negatively correlated with soil temperature. A non-significant positive correlation was observed between RH and iPAR. Soil temperature was significantly and negatively correlated with iPAR (r 2 = −0·961, P < 0·01), while it was only positively correlated with air temperature. There was no significant negative correlation between air temperature and iPAR. Evapotranspiration was significantly and positively correlated with iPAR (r 2 = 0·938, P < 0·01), and significantly negatively correlated with soil temperature (r 2 = −0·977, P < 0·01). A non-significant positive correlation was observed between ET and RH, while a non-significant negative correlation was observed between ET and air temperature. The WP was significantly and positively correlated with soil temperature (r 2 = 0·840, P < 0·05), while it was significantly and negatively correlated with ET (r 2 = −0·907, P < 0·05). There were no significant negative correlations between RH, iPAR and WP, while there was no significant positive correlation between WP and air temperature. Yield was significantly and positively correlated with iPAR (r 2 = 0.970, P < 0·01) and ET (r 2 = 0.964, P < 0·01), while it was significantly and negatively correlated with soil temperature (r 2 = −0·947, P < 0·01).
Correlation coefficients between relative humidity (RH), soil temperature, air temperature, intercepted photosynthetically active radiation (iPAR), evapotranspiration (ET), water productivity (WP) and yield of winter wheat in 2011–14
Means of 2011/12, 2012/13 and 2013/14 three seasons; NS, not significant.
DISCUSSION
Photosynthetically active radiation interception is a major determinant of crop growth (O'Connell et al. Reference O'Connell, O'Leary, Whitfield and Connor2004; Mattera et al. Reference Mattera, Romero, Cuatrín, Cornaglia and Grimoldi2013). Similarly, canopy radiation interception can affect farmland microclimates, which can affect physiological processes such as photosynthesis. Air temperature and PAR are highly correlated because of their similar daily and annual cycle (Tolk et al. Reference Tolk, Howell, Steiner, Krieg and Schneider1995; Ouyang et al. Reference Ouyang, Chen, Becker, Chu, Xie, Shao and John2014). In the present study, a negative correlation was observed between iPAR and air temperature. The iPAR in the three precision planting patterns increased as irrigation frequency increased. During the winter wheat growing seasons, the iPAR was higher in the single–twin and twin rows than in the single row; likewise, the iPAR of the single–twin row was significantly higher than that of the single row in later growth stages. The higher iPAR led to smaller soil evaporation and lower air temperatures that were beneficial to increased crop production.
Dry soil and low atmospheric RH are ecological problems faced during winter wheat production in northern China (Mo et al. Reference Mo, Liu, Lin, Xu, Xiang and McVicar2005). Liu et al. (Reference Liu, Li and Zhou2016) showed that a plant that is sufficiently close to another can modify the latter's soil or air environment and decrease the latter's rate of growth. In the current study, a positive correlation was observed between iPAR and RH and a significant negative correlation was observed between iPAR and soil temperature. This 3-year study demonstrated that a twin row planting pattern could maintain a higher RH than other patterns; despite this finding, RH did not differ significantly among the three precision planting patterns at I180. In the current experiment, the physiological response to changes in RH showed that RH was higher in twin and single–twin rows than in single rows under various irrigation treatments. However, in 2011/12 and 2012/13, relatively more rainfall during crucial growth stages resulted in no significant differences in RH between the three precision planting patterns. Conversely, rainfall was insufficient in 2013/14, thus creating significant differences in RH between the planting patterns. The 3 years of experimental results showed that the twin row precision planting pattern increased RH and decreased soil temperature, which reduced soil water evaporation and maintained moisture levels (Wang et al. Reference Wang, Zhou and Chen2016). Soil water content has a positive correlation with grain yield. Thus, the twin row pattern improved the RH and reduced soil and leaf water loss and increased grain yield in water deficit regions, which is consistent with previous studies (Zhang et al. Reference Zhang, Chen, Sun, Pei and Wang2008; Jiang et al. Reference Jiang, Huo, Feng and Zhang2012).
The changes in grain yield were consistent with those in iPAR. Different planting patterns and amounts of irrigation can improve field microclimate factors such as canopy and soil temperatures, above-ground RH and ET; an appropriate environment characterized by microclimate which favours the growth of winter wheat. As a result, crop yields were significantly increased. The twin row pattern can improve the field microclimate factors with increasing irrigation, so can achieve higher yields of winter wheat under I90 and I180 conditions.
Irrigation can alter the canopy structure and increase the radiation interception of winter wheat, decrease soil and canopy temperatures and thus increase RH, ultimately increasing grain yields. Reduced air temperatures and increased RH in the I90 and I180 conditions (in comparison with I0) were related not only to irrigation levels but also microclimatic conditions. The irrigation treatments could maintain a lower air temperature and higher RH. In addition, irrigation can increase the leaf area index and PAR interception (Han et al. Reference Han, Wang and Zhou2016). The results showed that at GS35, GS49 and GS71 iPAR was higher in the twin and single–twin rows than in the single row under irrigation. The planting pattern and irrigation interaction indicated that iPAR, ET and WP were significantly affected by irrigation.
In the present study, it was found that the single–twin row pattern resulted in low ET and high WP, with no significant difference from the twin row. Irrigation increased ET and RH but decreased WP. The winter wheat grown in twin rows at I90 had decreased the area of evaporation, thus reducing ET. The ET of the twin row pattern was significantly higher than that of the single and single–twin rows in 2012 and 2013 but was lower in 2014. This may be due to the twin row maintaining a higher RH, resulting in a lower ET during the low rainfall in 2014. The average WP values of I0, I90 and I180 conditions were 20·4, 19·0 and 17·7 kg/ha/mm and the values of single, single–twin and twin row patterns were 18·6, 19·5, 19·7 kg/ha/mm in 2011–14, respectively. Sadras & Angus (Reference Sadras and Angus2006) showed that the maximum WP was 22 kg/ha/mm in a rainfed region and 9·8 kg/ha/mm for the China Loess Plateau. The WP on the Huanghuaihai Plain was different from the China Loess Plateau because of the different annual precipitation and yields of the two regions. Grain yield was closely related to ET, which is consistent with previous studies (Schneider & Howell Reference Schneider and Howell1997; Huang et al. Reference Huang, Gallichand and Zhong2004). The planting pattern and irrigation interactions for ET, WP and yield significantly responded to irrigation. Compared with I0, the I90 treatment increased ET and grain yield by 26·8 and 19·3%, respectively, and decreased WP by 7·4%. Compared with I90, the I180 treatment increased ET and grain yield by 16·6 and 9·9%, respectively, and decreased WP by 5·3%. These findings suggest that in water-scarce regions, 90 mm of irrigation has a greater potential to increase winter wheat production than 180 mm. The ET and WP of the twin row planting pattern were higher than those of the other planting patterns. Therefore, high grain yields can be achieved under suitable irrigation conditions and planting patterns.
This 3-year study demonstrated that precision planting patterns and irrigation conditions can significantly affect soil temperature, RH, iPAR, ET, WP and yield. With or without irrigation, the twin row pattern exhibited an increase in RH, iPAR, WP and yield; under the same irrigation conditions, the twin row also decreased soil temperature and ET. The twin row was better than other planting patterns at withstanding deficient irrigation. These results suggest that a twin row pattern combined with I90 could effectively improve microclimate and yield in water-deficient regions and that a twin row combined with I180 could be utilized in water-abundant regions.
This research was supported by the National High Technology Research and Development Program of China (Grant no. 2013AA102903), Guangxi Natural Science Foundation (Grant no. 2015GXNSFAA139049) and Starting Foundation for Doctors of Guangxi University (Grant no. XBZ160072).