I. INTRODUCTION
Over the past 100 years, time-dependent plastic deformation of a material, referred to as creep, has been of great interest from both scientific and engineering viewpoints. Especially, for structural materials for high-temperature applications, evaluation of their creep properties has been essentially conducted since the creep is a thermally activated process and thus it plays an important role in mechanical performance at high temperatures because of high atomic mobility. Although the same terminology has been often used for describing the time-dependent elastic (“viscoelastic”) deformation in some materials like polymers and glasses, the subject “creep” in this review will be limited to time-dependent plastic (“viscoplastic”) deformation for which a significant portion of the creep strain is permanent and unrecoverable after unloading.
The creep curve describing the change in uniaxial strain of a metal under a constant load (or stress) and temperature can be clearly resolved into three stagesReference Dieter1–Reference Nabarro3: primary (or transient) creep where the sample deforms rapidly but at a decreasing rate (which is typically described as ε ∝ t 1/3; here, ε is the creep strain and t is the hold time), secondary (or steady-state) creep where the creep strain rate reaches a minimum value and remains almost constant (i.e., ε ∝ t), and tertiary creep in which the creep strain rate accelerates rapidly until the sample fails.
An important quantitative measure of the creep curve is the slope of secondary creep regime, that is, the so-called steady-state creep rate which can be empirically related with rupture time by Monkman-Grant equation.Reference Dieter1, Reference Kassner and Pérez-Prado2 The steady-state creep strain rate in metals and alloys are known to be strongly dependent on the applied stress σ, (absolute) temperature T, and grain size d Reference Dieter1, Reference Kassner and Pérez-Prado2:

where f is a material- and temperature-related factor, G is the shear modulus, b is the magnitude of Burgers vector, Q is the activation energy for creep, R is the gas constant, p is the inverse grain-size exponent, and n is the creep stress exponent. In this equation, the stress exponent, n  , is often considered as a useful indicator for the predominant creep mechanism; that is, n = 1 for diffusion creep such as Nabarro–Herring creep or Coble creep (which involves vacancy flow through the lattice or along the grain boundaries, respectively), n = 2 for the creep controlled by grain boundary sliding, and n = 3–8 for the dislocation creep (or power-law creep) in which the creep is governed by dislocation glide and climb and is grain-size-independent (p = 0).Reference Dieter1, Reference Kassner and Pérez-Prado2
The creep testing according to general procedures (which are covered in standards like ASTM specification E139-064) requires many standard-sized samples and thus is a little bit time-consuming. In this regard, there have been many attempts to estimate creep behavior through simple indentation experiments. The indentation creep tests have many advantages; for example, the testing procedure is simple and easy to set up, and only small sample is needed. But, one of the most powerful advantages may be the fact that one can estimate the small-scale creep properties and their local change through the test, which is applicable not only to micro- or nanoscale structures in electronics industries but also to relatively large-scale components such as the weld heat-affected zone in which complex microstructure gradient exists. Moreover, the importance of the small-scale creep research is continuously increasing in these days of “nano-age” because the creep becomes more active in the nanoscale.Reference Wang, Huang and Xu5–Reference Wang, Huang and Lu7
Here we critically review the existing indentation creep methods and the issues that can be raised in precisely estimating small-scale creep properties, and attempt to propose possible novel ways to get more reliable data.
II. EARLY INDENTATION CREEP TESTS
Early studies on indentation creep were mainly performed through conventional hot hardness tests (without recording load–displacement curve) at elevated temperatures.Reference Mulhearn and Tabor8–Reference Kutty, Ganguly and Sastry10 To our best knowledge, the first indentation creep experiments were conducted by Mulhearn and TaborReference Mulhearn and Tabor8 who carried out spherical indentations on the low-melting-temperature materials such as indium and lead at various temperatures (from liquid air to 50 °C). They observed the change in hardness by varying the dwell time of the indentation at a given load and temperature. Their approach was based on previous experimental finding that spherical indentation may produce a representative indentation strain ε i that is comparable to uniaxial flow strain by a relation:

where B is a constant (typically 0.2), a is the contact radius, and r is the radius of the spherical tip. Since hardness H is defined as the load P divided by area A (=πa 2), the ε i is inversely proportional to H 0.5. The indentation strain rate  can be simply obtained by differentiating Eq. (2) with respect to time. From the observation that H decreases with increasing dwell time t, Mulhearn and TaborReference Mulhearn and Tabor8 proposed a relation including the stress exponent n:

where C is a constant. Later, Atkins et al.Reference Atkins, Silvério and Tabor9 modified the exponent of (a/r) in Eq. (2) from 1 to 1.5 and suggested a new empirical relation (with an assumption of n ∼ 10):

where I is a constant, t 0 is the loading time to the maximum load P max, and H 0 is the hardness at t = t 0.
Attempts to analyze the indentation creep through hot hardness tests were also made with a sharp indenterReference Sargent and Ashby11, Reference Kutty, Jarvis and Ganguly12 and a flat-punch indenter.Reference Li13, Reference Chu and Li14 For sharp indentation creep, Sargent and AshbyReference Sargent and Ashby11 adopted the dimensional analysis and derived the equations for the time-dependent hardness as

and the strain rate as

where n is the stress exponent, K is the n-dependent constant, σ 0 is the reference stress, and  is the strain rate at σ 0. On the other hand, the flat-punch indentation creep (often referred to as “impression creep”)Reference Li13 was more extensively studied because the stress state underneath the flat-punch indenter is less complicated than other indenters. Chu and Li,Reference Chu and Li14 who first introduced the impression creep test, reported that the steady-state penetration can be achieved after transient creep period during high-temperature tests on succinonitrile crystal using homemade equipment. To determine the exponent n, they used the impression velocity v (=dh/dt) instead of
 and found the linear relations between H (or σ) and v. For self-diffusion through the volume of specimen,
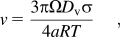
and for interfacial self-diffusion along the material interface between the indenter and the specimen,
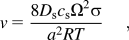
where D v and D s are self-diffusivity along volume and surface, respectively, Ω is the molar volume of atoms in the material, and c s is the number of moles of atoms per unit area of the sample at the interface.
III. NANOINDENTATION CREEP TESTS
Indentation creep research accelerated in the late 1980s with the development of instrumented indentation techniques (especially, nanoindentation),Reference Pethica, Hutchings and Oliver15–Reference Oliver and Pharr17 which make it possible to systematically investigate the time-dependent mechanical response by analyzing the indentation load–displacement (P–h) curves without hardness impression observation.
Nanoindentation experiments including creep test are mostly made with a three-sided pyramidal indenter (especially, Berkovich tip having a centerline-to-face angle of 65.3°). In this sharp indentation, the mean stress σ and the strain rate  in Eq. (1) are often considered asReference Raman and Berriche18–Reference Stone, Jakes, Puthoff and Elmustafa22
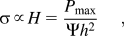
and
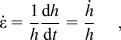
or
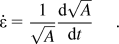
Here Ψ is the constant related with tip geometry (e.g., 24.56 for the Berkovich tip without tip bluntness).
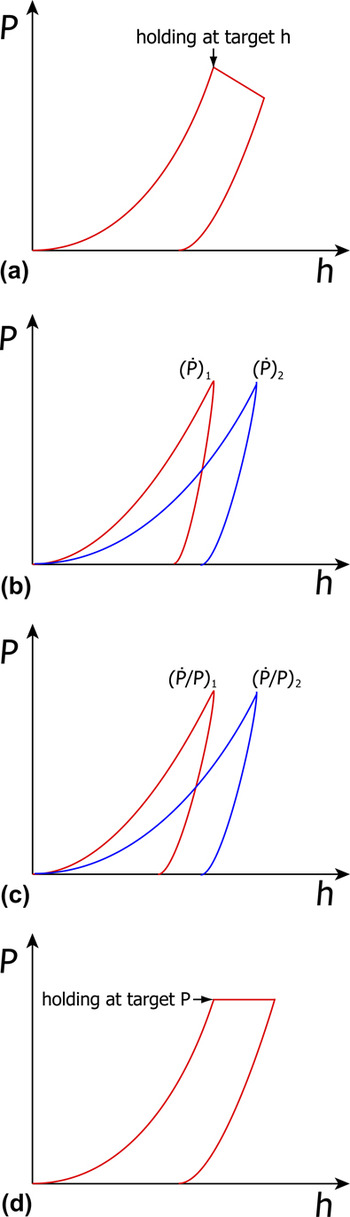
As well reviewed in Refs. Reference Raman and Berriche18–Reference Stone, Jakes, Puthoff and Elmustafa22, four major experimental approaches to nanoindentation creep have been developed since the late 1980s: constant displacement test,Reference LaFontaine, Yost, Black and Li23 constant loading-rate test,Reference Mayo and Nix24 constant strain-rate test,Reference Lucas and Oliver19 and constant load test.Reference Mayo, Siegel, Narayanasamy and Nix25 The schematic of each test is exhibited in Fig. 1.
Schematic of the testing procedure for four different indentation creep tests: (a) constant displacement method, (b) constant loading-rate method, (c) constant strain-rate method, and (d) constant load method.

First, in the constant displacement (or originally called indentation load relaxation or ILR) test,Reference LaFontaine, Yost, Black and Li23 the position of indenter (displacement h) is fixed after reaching a predetermined penetration depth, and then the decrease in indentation load is monitored as a function of time. LaFontaine et al.,Reference LaFontaine, Yost, Black and Li23 who provided the detailed procedure of the testing, performed the experiments on single-crystal Al and Al–2% Si film using homemade nanoindentation equipment. They reported that the double-logarithmic plots of H versus  (where h i is the plastic indentation depth at the onset of the relaxation) obtained from this method are very similar to those of σ versus
 from conventional tensile load relaxation tests. However, this type of test has not been popularly used for estimating viscoplastic creep properties. This is because, while it is relatively easy to hold an indenter in a fixed position, keeping the displacement constant may be virtually impossible and thus both load and displacement vary continuously, which make analysis very difficult.Reference Goodall and Clyne21
Second, the constant loading-rate (or originally called constant rate of loading or CRL) test was suggested by Mayo and NixReference Mayo and Nix24 who attempted to determine strain-rate sensitivity m (=1/n) of Pb, Sn, and Pb–38% Sn, all of which are low-melting-temperature materials, and hence room temperature may correspond to relatively high homologous temperature where creep can easily occur. Multiple indentation tests on the same sample are required in this method, while a hold time at a specific load or displacement is not needed. When nanoindentation tests are made under prespecified loading rate  (=dP/dt), the load–time (P–t) relation is linear, but the displacement–time (h–t) relation is nonlinear and significantly affected by the applied
 . From each indentation test, one pair of σ (that is assumed as the same as H) and
 can be taken at a selected displacement h. These data pairs are then graphed on a log-log plot of indentation σ and
 that are calculated according to Eqs. (2) and (3). Then, the strain-rate sensitivity m and thus the exponent n (simply by m = 1/n) are determined from the slope of that plot. In addition, there is a modified method called the loading-rate change (or LRC) test in which the loading rate is kept constant until a prespecified displacement, but is abruptly changed to a new value and the subsequent changes in σ and
 are monitored and analyzed to determine the n value. Although Mayo and NixReference Mayo and Nix24 reported that the strain-rate sensitivity m can be successfully estimated by this method, there are also some issues. Most of all, in the multiple tests, the inevitable statistical variations in hardness from point to point makes it difficult to observe systematic increase in stress with loading rate. Additionally, it is still controversial whether or not the conversion of the m to the n is proper because the difference in loading type between quasistatic loading (in this method) and load holding (in general creep) is not clear yet.
Third, the constant strain-rate test was suggested by Lucas and Oliver.Reference Lucas and Oliver19 In the method of multiple tests, the load of each test is exponentially increased with time; thus, the indentation strain rate  in Eq. (10) is kept constant during loading sequences by maintaining the loading rate divided by load,
 , constant (i.e., by letting the loading rate increase with load by a constant ratio). This is based on the calculation showing that
 is approximately half the value of
 . Since both
 and H are kept constant, one may think that the test reaches a steady-state condition. However, it is noteworthy that, although Lucas and OliverReference Lucas and Oliver19 argued in their experimental study on indium that this method can provide more reliable data than constant loading-rate test data, the exponent n estimated by this method (n = 7.6) is only slightly closer to that from conventional creep test (n = 7.3) than that by the constant loading-rate method (n = 6.3). More importantly, since this method also requires the multiple tests like the constant loading-rate method, the abovementioned issue related with the varying hardness from point to point should be carefully considered in this method.
Last, among various indentation creep testing methods, the most popular one by far is the constant load test,Reference Mayo, Siegel, Narayanasamy and Nix25 which is the main focus in the following sections of this review. This popularity is simply because the loading-and-holding sequences are somewhat analogous to those in conventional uniaxial creep tests. In this method, an extended dwell is made at a constant peak load and the increase in the penetration depth with dwell time is monitored. From the displacement change recorded during holding at the peak load, the change in stress (can be either assumed as the same as H or converted by Tabor’s empirical law,Reference Tabor26σ = H/C, where C is the constraint factor of typically ∼3 for metals) during dwell time can be estimated. To determine  , the displacement rate (dh/dt) is often calculated by fitting the displacement–dwell time (h–t) curve according to an empirical equation (that may be originally introduced in Ref. Reference Li and Ngan20):

where h 0 is the indentation depth at the onset of creep, and E, Φ, and κ are fitting constants. Finally, by log-log plotting the σ against  , the creep stress exponent n in Eq. (1) has been obtained.
IV. CRITICAL ISSUES
As mentioned above, the constant-load nanoindentation creep tests have been the most popularly conducted by far,Reference Li and Ngan20–Reference Stone, Jakes, Puthoff and Elmustafa22, Reference Mayo, Siegel, Liao and Nix27–Reference Kucheyev, Lord and Hamza39 but the results produced by the experiments have often shown a large difference from the uniaxial test data in the literature. For example, in the earliest constant-load nanoindentation creep study by Mayo et al.,Reference Mayo, Siegel, Narayanasamy and Nix25, Reference Mayo, Siegel, Liao and Nix27 the strain-rate sensitivity m of nanocrystalline (nc) TiO2 and ZnO having a grain size of 10–30 nm (prepared by a gas condensation process) was estimated to be about 0.01–0.04, which may correspond to stress exponent n = 25–100. As pointed out by Goodall and Clyne,Reference Goodall and Clyne21 the n values of this magnitude seem to be too high and physically implausible for a creep-like process. Recently, Ma et al.Reference Ma, Long, Zhou and Pan33, Reference Ma, Long, Pan and Zhou34 estimated the n of electrodeposited nc-Ni with grain size of ∼25 nm through the constant-load indentation creep test and reported that the n is in the range of 20–140, which seems also unreasonably high.
We believe that the main issues related with the possible errors in determining n value can be categorized into two groups: one is the issues related with the fundamental difference between the indentation creep and the conventional uniaxial creep tests, and the other is the issues related with sharp tip geometry.
A. Fundamental issues
Fundamental issues are primarily based on the large discrepancy in the stress state between indentation creep and uniaxial creep. It is obvious that the stress state underneath the indenter is much more complicated than uniaxial stress condition in the conventional tensile creep tests. In this regard, Bower et al.Reference Bower, Fleck, Needleman and Ogbonna40 investigated the correlation between uniaxial creep and indentation creep for n = 1 ∼ ∞, using the similarity transformation concept with the finite element analysis. They argued that the indentation creep problems can be reduced to a form that is independent of the indenter geometry and depends only on the material properties through the creep stress exponent n. Then, it was proved through a similarity transformation analysis that, for a power-law creeping material following Eq. (1), the n deduced from indentation can be the same as the one from uniaxial creep test, implying that the n in Eq. (1) will not be changed by replacing σ in the equation by H (or mean contact pressure p m). Although they provided possible models to correlate the indentation creep and the uniaxial creep, some limitations exist in their theory as mentioned by themselves: first, they neglected the elasticity effect in the calculations, second, the material behavior in the theory may be oversimplified, and last, they solved the boundary problem with an assumption of small displacement and strain that may be a critical issue especially for the spherical indentation creep where the indentation strain and stress are rapidly increasing with indentation depth.
Another fundamental issue often pointed out is about the possibility of the steady-state condition. As mentioned in the introduction, experiencing the steady-state (secondary) creep regime is essential for systematic analysis of creep properties. The strain rate in the primary (transient) creep regime must be much higher than the steady-state creep rate, which leads to misunderstanding of the n value and thus creep mechanism. The major concern on this issue may arise from the much shorter holding time in nanoindentation creep than that in uniaxial creep; that is, because of the inevitable thermal drift of the nanoindentation system, the maximum hold time in nanoindentation creep is typically less than minutes, whereas that for uniaxial creep is at least longer than thousands hours. Such a short hold time will certainly result in the higher fraction and thus importance of primary creep regime.Reference Ogbonna, Fleck and Cocks41 Actually, many nanoindentation creep studies reported that their tests might not experience the steady-state condition (e.g., see Ref. Reference Wang, Zhang and Nieh35) as the  continuously decreased during holding sequence. We will return to this issue later.
Additionally, it has been often pointed out as a problem that, in the constant-load nanoindentation creep, the σ (estimated from H) does not remain constant and decreases during the holding sequence as the h continuously increases, which makes it difficult to obtain the steady-state strain rate at a given stress. From this viewpoint, Chu and Li,Reference Chu and Li14 who developed the impression creep technique, suggested that the use of a flat-punch indenter can overcome this issue because contact area A and thus H do not vary with h. However, it should be noted that such a stress change also occurs in conventional constant-load tensile (or compressive) creep test for which the displacement continuously increases and thus the stress increases (or decreases). It is also noteworthy that the σ in Eq. (1) is the stress at the onset of creep (load hold). Also, regarding the suggestion of using flat-punch indenter, in real world, it is not easy to make an ideally flat contact in the nanoindentation test.
Finally, it is constructive to note that there are some issues raised by extensive numerical studies through finite element analysis. Especially, Stone and colleagues performed a series of simulations on the conical indentation creep in various materials and proposed some interesting results (see their review articleReference Stone, Jakes, Puthoff and Elmustafa22). For example, in reality, the proportionality “constants” for relating (i) H to σ and (ii) the contact area A to square depth h 2 may not be constant and be seriously affected by hardness-to-modulus (H/E) ratio, which changes during creep.
B. Sharp-tip-related issues
The Berkovich indenter has been the most popularly used in nanoindentation experiments including creep tests, simply because such a three-sided pyramidal diamond indenter is easiest to fabricate in the small scale fitted for nanoindentation system. The self-similar geometry of a sharp tip may raise some important issues in nanoindentation creep analysis. First, for both sharp and spherical indentations, the characteristic indentation strain εi (i.e., the strain comparable to uniaxial flow strain) is defined as 0.2 tan β,Reference Johnson42 where β is the inclination of the indenter face to the sample surface. For a sharp tip, the β and thus the strain are fixed and independent of creep displacement because of the geometrical self-similarity of the indenter, while the creep strain versus time curve is the key data in uniaxial creep tests. Second, from a viewpoint of continuum plasticity concept, the characteristic stress underneath a given sharp tip is unique, which makes it virtually impossible to plot the change in strain rate as a function of stress. Therefore, in the constant load method, the change in h during load-hold sequence is used for calculating the stress variation. One may think this can be an advantage because the exponent n can be predicted from a single test. However, it should be noted that, in standard uniaxial creep test,4 the σ for calculating the n is not the varying stresses in load-hold sequence but the initial stress at the onset of creep; thus, a large number of tests at different initial stress levels are required for determining the n value. This concept cannot be applied into the constant-load sharp indentation creep method unless the multiple tips having different angles are used for the experiments. Third, the unique characteristic stress must be plastic because of the singularity issue of the tip (if the tip is not blunted). This may induce a difference from the uniaxial creep data for which applied stress is elastic. Fourth, high stress underneath the indenter can induce much higher strain rate than that observed during conventional uniaxial creep. This makes it difficult finding a proper creep mechanism. Last, the presence of indentation size effect (ISE, which is manifested as an increase in hardness with decreasing indentation depth for a sharp indentationReference Pharr, Herbert and Gao43) can complicate the analysis of the σ– relationship.
V. SUGGESTIONS OF NEW APPROACHES
Here we suggest possible ways to overcome some of the issues described above. First, one may overcome the difficulties arising from the geometrical self-similarity of a sharp tip by performing constant-load nanoindentation creep tests using a spherical indenter. In spherical indentation, the indentation strain, ε i = 0.2 tan β, is often redefined as 0.2(a/r)Reference Kassner and Pérez-Prado2 as given in Eq. (2); that is, tan β in spherical indentation is determined as (a/r). Thus, the ε i as well as the σ (i.e., H) at the onset of creep can be systematically varied by simply changing the applied peak load, P max (with a fixed r). Thus, increasing P max can lead to a dramatic increase in σ and ε from elastic to elastoplastic, and then to fully plastic regimes.Reference Johnson42 In addition, the ISE in spherical indentation is different from that in sharp indentation; that is, the H is significantly affected not by the h but by the r.Reference Pharr, Herbert and Gao43
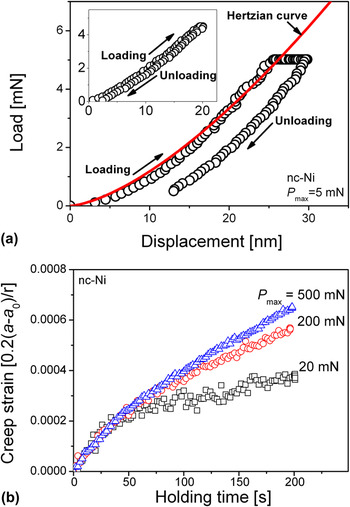
The spherical indentation creep method requires multiple indentation creep tests made at different P max, from which a variety of indentation stress and strain level underneath the indenter can be achieved.Reference Yoo, Kim, Oh, Ramamurty and Jang44Figure 2(a) shows an example of P–h curve obtained from low-load spherical indentation creep (at P max = 5 mN) on the electrodeposited nc-Ni with an average grain size of 30 nm,Reference Choi, Yoo, Kim, Seok, Wang and Jang45 with the inset figure proving that the quasistatic indentation at the same P max is elastic. It is evident from the figure that creep occurs even at elastic regime and that the observed creep behavior is mainly time-dependently plastic in nature.
Representative examples of the spherical indentation creep data [from nanocrystalline (nc)-Ni]: (a) P–h curves for P max = 5 mN in which Herzian elastic curves are also drawn for comparison (the inset image is P–h curve from quasistatic loading to the same P max) and (b) indentation creep strain versus time curves for various P max..

As a first step to quantitatively estimate the exponent n, the increased amount of indentation strain by creep can be quantified as 0.2(a − a 0)/r (where a 0 is the contact radius at the onset of the creep) and described as a function of holding time [e.g., see Fig. 2(b)]. Note that this is not a h–t curve but an ε–t creep curve. This curve can be fitted according to Garofalo’s mathematical equationReference Dieter1 developed for uniaxial creep strain:

where ε 0 is an instantaneous strain during loading [which is zero in Fig. 2(b)], θ and χ are constants (whose physical meaning may be the limit of transient creep strain and the steady-state creep rate, respectively), and q is the ratio of transient creep rate to the transient creep strain. Now one may calculate the indentation  by differentiating Eq. (13) and averaging the values of the strain rate corresponding to the last 10–20% of total hold time. Then, the indentation σ proportional to H (=P max/πa 02) at the onset of creep is plotted against the
 in a double-logarithmic scale. Finally, the exponent n can be calculated from a slope of log(
 ) and log(σ). In authors’ previous work on nc-Ni,Reference Choi, Yoo, Kim, Seok, Wang and Jang45 it was found that the n value estimated from this spherical indentation creep at room temperature was 1.02–1.85, which is very similar to the values measured from conventional uniaxial creep at room temperature.
Second possible approach for better analyzing small-scale creep may be micro-/nanopillar uniaxial compression creep tests using nanoindentation equipment. Primary advantage of this method is that the result can be free from all the issues arising from the difference between uniaxial creep and indentation creepReference Wang, Lai, Huang and Nieh38, Reference Yoo, Choi, Kim, Shim, Tsui, Bei, Ramamurty and Jang46More importantly, it makes it possible to systematically analyze the size effect on the creep behavior by using a series of pillars having different diameters.
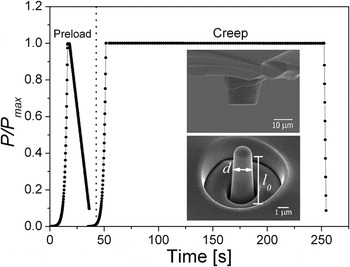
Figure 3 shows a schematic of the possible testing procedure. The flat punch tip and pillars are made by focused ion beam (FIB) milling according to the normal procedure for pillar fabrication.Reference Kim and Greer47
Schematic of the pillar creep testing sequence. Inset micrographs show a flat-punch tip and a micropillar fabricated by focused ion beam milling.

Prior to the creep test, it may need to apply a preload to the same stress as the creep stress so as to minimize the top surface effects.Reference Yoo, Choi, Kim, Shim, Tsui, Bei, Ramamurty and Jang46 During the creep test, the load is increased up to the desired maximum stress level (e.g., 40–80% of the yield strength) in the “elastic” range, then held for the maximum 200 s, and finally removed. The holding time should be chosen in consideration of the thermal and the instrumental drift. From the recorded indentation P-h data, the engineering σ and ε can be calculated by σ ∼ P/[π(d/2)2] and ε ∼ h/l 0, respectively, where d is the pillar diameter (empirically determined as a diameter measured at ∼30% of the pillar height from the pillar top for considering tapering effect), and l 0 is the initial height of pillar (see the inset in Fig. 3).
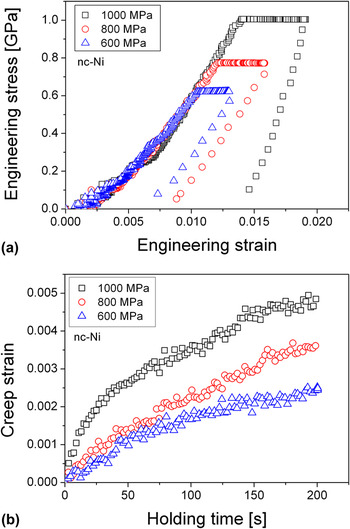
Figure 4(a) exhibits examples of the engineering stress versus engineering strain curve obtained from pillar creep tests made on nc-Ni. Overlapping of the loading portion of the curves indicates that the stress applied for the creep test is well within the elastic regime. The amount of creep strain is found to increase significantly with increasing applied stress. As shown in Fig. 4(b), the creep curves are mostly parabolic in nature, which is similar to those reported for high-temperature creep of crystalline metals; that is, the curve consists of primary and secondary regimes in the early stages. The stress exponent n can be estimated straightforwardly from a double-logarithmic plot of σ– .
Representative examples of (a) engineering stress–strain curve and (b) creep strain–time curve for different applied stress (from the tests on nc-Ni)..

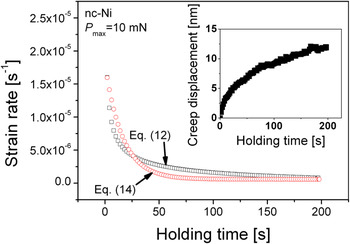
Before closing, we would like to provide a small tip for possibly overcoming the issue related with reaching the steady state in constant-load sharp indentation creep. As mentioned earlier, the h–t curve is usually fitted by an empirical Eq. (12). However, differentiation of Eq. (12) usually does not lead to a steady-state condition of strain rate. A series of experimental analysis led us to a finding that a closer approach to the steady state is possible if Eq. (12) is replaced by the following mathematical fitting equation that is analogous to Eq. (13):

Related example is provided in Fig. 5. The h–t curve in the inset figure is fitted according to the two different equations. The correlation factor R 2 for fitting with Eq. (12) is about 0.994, and that with Eq. (14) is about 0.988, meaning that one can choose either Eq. (12) or Eq. (14). However, the results are significantly different; the strain rate from Eq. (12) largely decreases with time, whereas that from Eq. (14) seems to closely approach to the steady-state condition, implying that the use of Eq. (14) may be better for estimating creep properties through constant-load sharp nanoindentation creep experiments.
Variation in strain rate as a function of time (from the tests on nc-Ni)..

VI. CONCLUSIONS
Analyzing the creep in the small scale is valuable not only for solving scientific curiosity but also for obtaining practical information for engineering purpose; for example, life-time and reliability of micro-/nanoelectromechanical system (MEMS/NEMS). For the purpose, nanoindentation creep experiments are now widely performed. Here we briefly review the conventional hardness creep tests and nanoindentation creep methods and then analyze both fundamental and tip-related issues about the existing technique. Finally, we suggest two possible ways to better estimate the small-scale creep properties: spherical indentation creep and pillar compression creep. However, these tests have not been fully established yet and thus further investigations are desirable since there are some important remaining issues such as imperfect geometry of spherical tip, influence of the spherical tip radius, inevitable fluctuation of hardness data in multiple tests, and FIB damage on the pillar surfaces.
ACKNOWLEDGMENTS
This research was supported by Basic Science Research Program through the National Research Foundation of Korea (NRF) funded by the Ministry of Education, Science and Technology (No. 2010-0025526) and in part by the Human Resources Development of the Korea Institute of Energy Technology Evaluation and Planning (KETEP) grant funded by the Korea government Ministry of Knowledge Economy (No. 20101020300460).