

1. Introduction
The diversity of early animals in the oceans expanded during the Ediacaran and Cambrian periods, and its causes have been suggested to involve the development of intrinsic biological genes (Peterson & Davidson, Reference Peterson and Davidson2000; Erwin & Davidson, Reference Erwin and Davidson2002; Erwin et al. Reference Erwin, Laflamme, Tweedt, Sperling and Peterson2011), and/or changes in ecosystem structure and trophic capacities (Butterfield, Reference Butterfield, Zhuravlev and Riding2001; Bengtson, Reference Bengtson2002; Laflamme et al. Reference Laflamme, Darroch, Tweedt, Peterson and Erwin2013; Sperling et al. Reference Sperling, Knoll and Girguis2015). A third explanation for the expansion of early animal diversity in Earth’s history suggests interactions between the biosphere and the evolving Earth’s surface environment (Och et al. Reference Och, Shields-Zhou, Poulton, Manning, Thirlwall, Li, Chen, Ling, Osborn and Cremonese2013; Lyons et al. Reference Lyons, Reinhard and Planavsky2014). This environmental hypothesis broadly suggests that oxygenation of the oceans and its manifestation were causally linked to the initial diversification (Fike et al. Reference Fike, Grotzinger, Pratt and Summons2006; Canfield, Reference Canfield2007), and the subsequent evolution and radiation of macroscopic multicellular organisms and calcified invertebrates may have led to further oxygenation of the oceans by enhanced vertical bioturbation of marine sediments during the Phanerozoic (Boyle et al. Reference Boyle, Dahl, Dale, Shields-Zhou, Zhu, Brasier, Canfield and Lenton2014; Tarhan et al. Reference Tarhan, Droser, Planavsky and Johnston2015).
Long-term oxygenation of the ocean–atmosphere system is thought to be regulated by the burial of reduced sulphur (primarily as pyrite) and organic carbon in rocks and their eventual recycling and remineralization on million-year timescales (Garrels & Lerman, Reference Garrels and Lerman1981; Berner, Reference Berner2006). Studies of the ocean redox history have been benchmarked by carbon isotope (13C and 12C) and sulphur isotope (34S and 32S) signatures in sedimentary sequences (e.g. Fike et al. Reference Fike, Grotzinger, Pratt and Summons2006; Li et al. Reference Li, Love, Lyons, Fike, Sessions and Chu2010). An emerging picture from multi-proxy geochemical studies shows intra/inter-basin heterogeneity in marine chemistry, characterized by oxic surface waters, euxinic middle waters and ferruginous deep waters (e.g. Canfield et al. Reference Canfield, Poulton, Knoll, Narbonne, Ross, Goldberg and Strauss2008; Kurzweil et al. Reference Kurzweil, Drost, Pašav, Wille, Taubald, Schoeckle and Schoenberg2015; Och et al. Reference Och, Cremonese, Shields-Zhou, Poulton, Struck, Ling, Li, Chen, Manning, Thirlwall, Strauss and Zhu2015; Sahoo et al. Reference Sahoo, Planavsky, Jiang, Kendall, Owens, Wang, Shi, Anbar and Lyons2016). This heterogeneity carries implications for the stability and diversity of ecosystems, possibly leading to different fossil assemblages and taxa (such as population dynamics and structure of a community) in sedimentary sequences throughout the world’s ocean basins.
Recent studies on sulphur isotopes (33S and 36S) have demonstrated that additional environmental information may be preserved in the time-series records of these minor sulphur isotopes and have advanced our understanding of the first rise of atmospheric oxygen (Farquhar et al. Reference Farquhar, Bao and Thiemens2000) and of various aspects of sulphur cycle evolution, including reductive and oxidative parts of sulphur cycling and the evolution of the sulphur ecosystem over geologic time (e.g. Farquhar & Wing, Reference Farquhar and Wing2003; Johnston et al. Reference Johnston, Wing, Farquhar, Kaufman, Strauss, Lyons, Kah and Canfield2005; Wu et al. Reference Wu, Farquhar, Strauss, Kim and Canfield2010, Reference Wu, Farquhar and Strauss2014). A systematic study of multiple sulphur isotopes (32S, 33S and 34S) was performed on sulphur extracts (carbonate-associated sulphate (CAS) and pyrites) from sedimentary sequences of the Oman basin (Fike et al. Reference Fike, Grotzinger, Pratt and Summons2006; Fike & Grotzinger, Reference Fike and Grotzinger2008), suggesting that the water mass shifted to more oxidizing conditions associated with an additional role of sulphide reoxidation in sulphur cycling during the latest Neoproterozoic, and also arguing that the sulphate levels at this time rose dramatically (∼17 mM) due to changes in sulphate input to the Oman basin (Wu et al. Reference Wu, Farquhar and Fike2015).
In this study, we present multiple sulphur isotope data of sedimentary pyrites (δ34Spy and Δ33Spy) extracted from carbonates across the Ed–C boundary and extending into the lower Cambrian from the Xiaotan section, Yunnan Province, South China. The sulphur cycle evolution model proposed in the study of Wu et al. (Reference Wu, Farquhar and Fike2015) is further evaluated to gain a better understanding of the operation of sulphur cycling on a global scale. We argue that sulphate levels were low in South China throughout the studied time interval, and we also suggest that heterogeneity in sulphate concentrations may have existed between multiple ocean basins. The dynamics of Δ33Spy suggest that sulphur influx (rate and bulk composition of sulphur input) to the oceans was heavily derived from much older pyrites and shifted to negative Δ33S on a global scale beginning around the Ed–C transition and into the early Cambrian.
2. Context
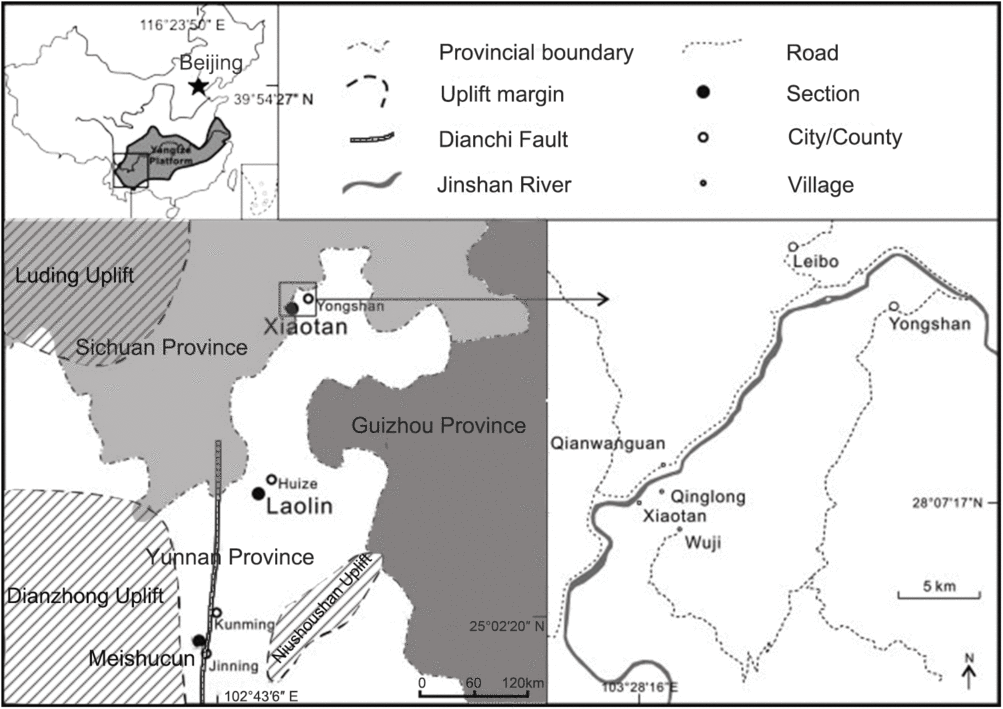
The exposed Xiaotan section in the Yangtze Platform, South China, is one of the most well-preserved and continuous late Ediacaran – early Cambrian transition sections (Fig. 1, cf. Li et al. Reference Li, Ling, Jiang, Pan, Chen, Cai and Feng2009, Reference Li, Ling, Shields-Zhou, Chen, Cremonese, Och, Thirlwall and Manning2013; Cremonese et al. Reference Cremonese, Shields-Zhou, Struck, Ling, Och, Chen and Li2013). The Xiaotan section consists of the upper Dengying Formation, the Zhujiaqing Formation, the Shiyantou Formation, the Yuanshan Formation and the Canglangpu Formation (Fig. 2). The strata of the upper Dengying Formation, including Donglongtan, Jiucheng and Baiyanshao members, were deposited in a widespread prograding platform (Cremonese et al. Reference Cremonese, Shields-Zhou, Struck, Ling, Och, Chen and Li2013). The Zhujiaqing Formation, consisting of Daibu, Zhongyicun and Dahai members, disconformably overlies the Dengying Formation. By the intra-basin biostratigraphy and chemostratigraphy correlation, the Ed–C boundary has been proposed to correspond to the interface between the Daibu Member and the Zhongyicun Member, which is 57.2 m above the interface between the Dengying Formation (Fig. 2) and the Zhujiaqing Formation (Li et al. Reference Li, Ling, Jiang, Pan, Chen, Cai and Feng2009, Reference Li, Ling, Shields-Zhou, Chen, Cremonese, Och, Thirlwall and Manning2013).
Geographic map of Xiaotan section, Yunnan, South China (modified from Li et al. Reference Li, Ling, Shields-Zhou, Chen, Cremonese, Och, Thirlwall and Manning2013).

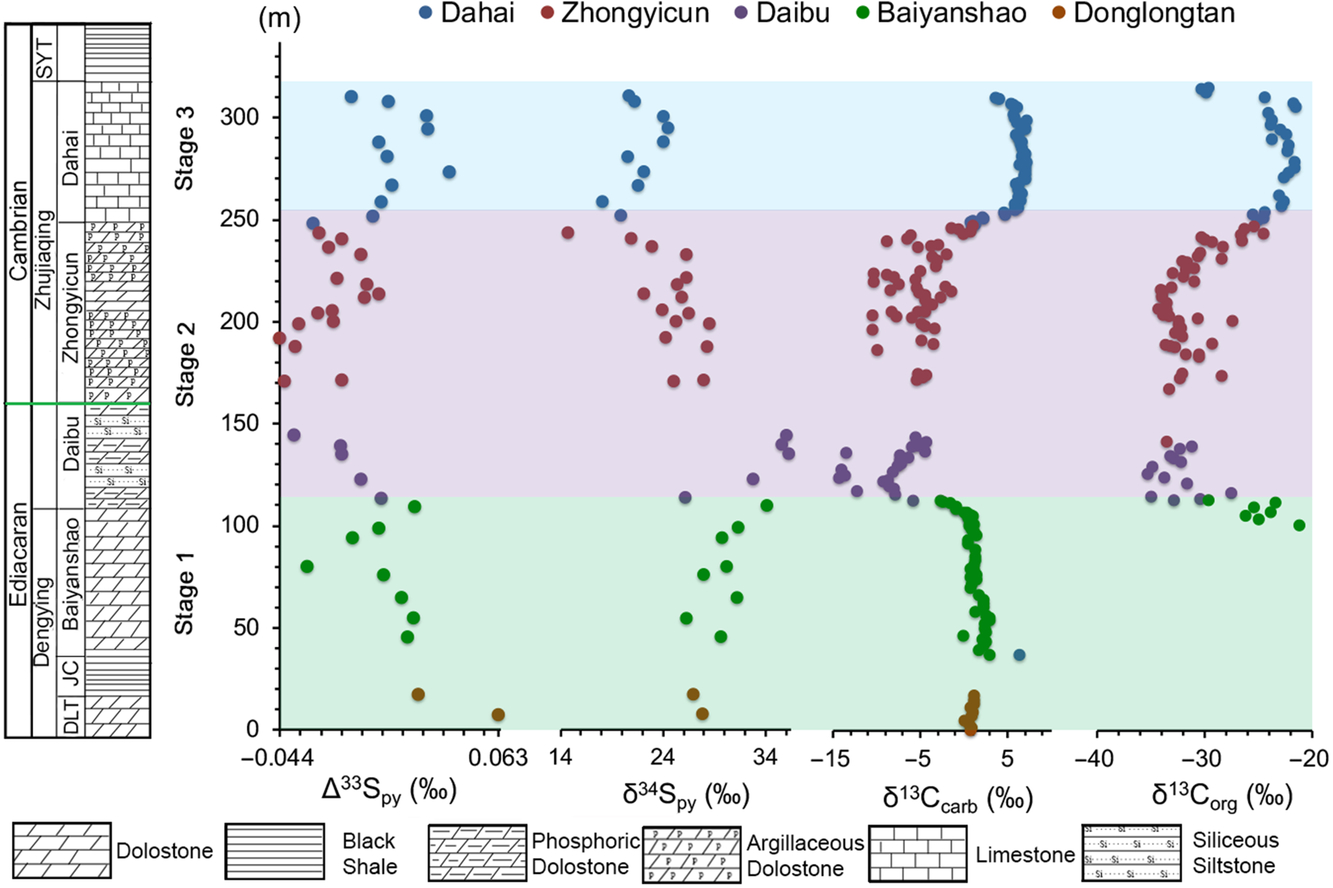
δ34Spy, Δ33Spy, δ13Ccarb and δ13Corg profiles along the strata depth from Xiaotan section, Yunnan, South China. DLT and JC stand for the Doulongtan and Jiucheng members. δ 13Ccarb data are from Li et al. (Reference Li, Ling, Shields-Zhou, Chen, Cremonese, Och, Thirlwall and Manning2013) and δ13Corg data are from Cremonese et al. (Reference Cremonese, Shields-Zhou, Struck, Ling, Och, Chen and Li2013). Note that no carbonate samples were collected from siltstones in the upper Daibu members (Li et al. Reference Li, Ling, Shields-Zhou, Chen, Cremonese, Och, Thirlwall and Manning2013).

A distinctly negative δ13Ccarb excursion (up to –12 ‰) immediately below the Ed–C boundary is observed in the lower Daibu Member of the upper Dengying Formation (Fig. 2). This negative excursion near the Ed–C boundary is a common feature in rocks from several global sedimentary successions in South China, Morocco, Mongolia, Siberia, Oman, Namibia, the western United States and northwestern Canada, but with various degrees of depletion in 13C (e.g. Grotzinger et al. Reference Grotzinger, Bowring, Saylor and Kaufman1995; Kaufman et al. Reference Kaufman, Corsetti and Varni2007; Maloof et al. Reference Maloof, Ramezani, Bowring, Fike, Porter and Mazouad2010; Shields-Zhou & Zhu, Reference Shields-Zhou and Zhu2013; Smith et al. Reference Smith, Bianchi, Allison, Savage and Galy2015). This depletion was interpreted to reflect oxidation of exposed continental shelf sediments rich in fossil organic matter and/or oxidation of oceanic methane hydrate (e.g. Kaufman et al. Reference Kaufman, Corsetti and Varni2007), or to reflect a contribution from authigenic carbonates produced in sediments during early diagenesis (Schrag et al. Reference Schrag, Higgins, Macdonald and Johnston2013). Above this negative shift, the δ13Ccarb values rise to about –5 ‰ in the upper Daibu Member, then show several oscillations in the Zhongyicun Member and rise to a stable positive δ13Ccarb value (∼6 ‰) in the Dahai Member. The coupling between δ13Ccarb and δ13Corg records suggests that these variations were primarily controlled by changes in relative fractions of organic carbon burial (e.g. Hayes et al. Reference Hayes, Strauss and Kaufman1999; Kump & Arthur, Reference Kump and Arthur1999).
3. Methods
Carbonate rocks for this study were obtained from the archive of Nanjing University carbonate samples, and those with minimal post-diagenetic overprints (showing low ratios of Mn/Sr, no extremely negative values in δ18O (<−10 ‰) and no positive correlation between δ13C and δ18O) were selected for pyrite–sulphur isotope study (cf. Li et al. Reference Li, Ling, Shields-Zhou, Chen, Cremonese, Och, Thirlwall and Manning2013). Approximately 5 to 15 g of whole rock samples were crushed to fine powders using a steel ring grinder. Rock powders were placed in a 100 ml round bottom flask, and dilute hydrochloric acid (2.0 N HCl) was added to remove carbonate. Pyrite–sulphur in the pre-treated rock powders was extracted by the chromium reduction method and converted to silver sulphide (Ag2S) following the protocol of Canfield et al. (Reference Canfield, Raiswell, Westrich, Reaves and Berner1986). The chemical extraction procedure is briefly described as follows. The flask containing pre-treated rock powders was connected to a water-cooled condenser and a trapping tube containing a silver nitrate solution (AgNO3). Twenty millilitres of concentrated HCl and 40 ml of CrCl2 solution were added to the reaction flask. The flask was then heated by a laboratory heating mantle to boiling point and N2 flow was maintained throughout the reaction. The product hydrogen sulphide gas (H2S) was carried by N2 gas through the condenser, a water trap filled with Milli-Q water, and was finally collected as silver sulphide (Ag2S) in the trap with the silver nitrate solution. The solution with silver sulphide was filtered, and the recovered silver sulphide was rinsed with Milli-Q water and left to dry on a filter paper at room temperature prior to fluorination.
Approximately 1−3 mg of Ag2S wrapped in aluminium foil was loaded into a nickel metal vessel, which was subsequently filled with tenfold excess of fluorine gas and heated at ∼250 °C overnight. The resulting SF6 gas was purified by cryogenic distillation with a mixed ethanol and liquid nitrogen slurry (−115 °C to −110 °C) and was further purified through a gas chromatography system using a combination of a molecular sieve 5A column and a 1/8 in. outer diameter, 4.8 m Haysep Q column with a helium flow rate of 20 ml min−1. SF6 gas was collected by freezing with liquid nitrogen out of the helium carrier flow and then transferred into a glass tube. SF6 was analysed for multiple sulphur isotopes using a Finnigan™ MAT 253 gas source isotope ratio mass spectrometer at the Stable Isotope Laboratory, University of Maryland. Four collectors simultaneously detect ion beams with mass/charge ratios of 127(32SF5+), 128(33SF5+), 129(34SF5+) and 131(36SF5+). Sulphur isotopic compositions are reported in δ notation (in parts per thousand, ‰) and relative to Vienna Canyon Diablo Troilite (V-CDT):
 $${{{\delta}}^{{x}}}{\rm{S}} = {{^{{x}}{{{R}}_{{\rm{sam}}}}} \over {^{{x}}{{{R}}_{{\rm{std}}}}}} - {\rm{1}}.$$
where x represents 33, 34, and R represents ratios of xS/32S. The deviations of δ33S from the reference mass fractionation array are expressed as Δ33S:
 $${\Delta ^{33}}{\rm{S}} = {{^{{\rm{33}}}{{{R}}_{{\rm{sam}}}}} \over {^{{\rm{33}}}{{{R}}_{{\rm{std}}}}}} - {\bigg({{^{{\rm{34}}}{{{R}}_{{\rm{sam}}}}} \over {^{{\rm{34}}}{{{R}}_{{\rm{std}}}}}}\bigg)^{0.515}}.$$
where 0.515 is the assigned canonical fractionation coefficient. In this study, the precisions for δ34S and Δ33S of samples are estimated to be comparable to those by measurements of IAEA S1, which is normalized to δ34S = −0.30 ± 0.16 ‰ and Δ33S = 0.094 ± 0.012 ‰ (2σ, SD), respectively.
4. Results
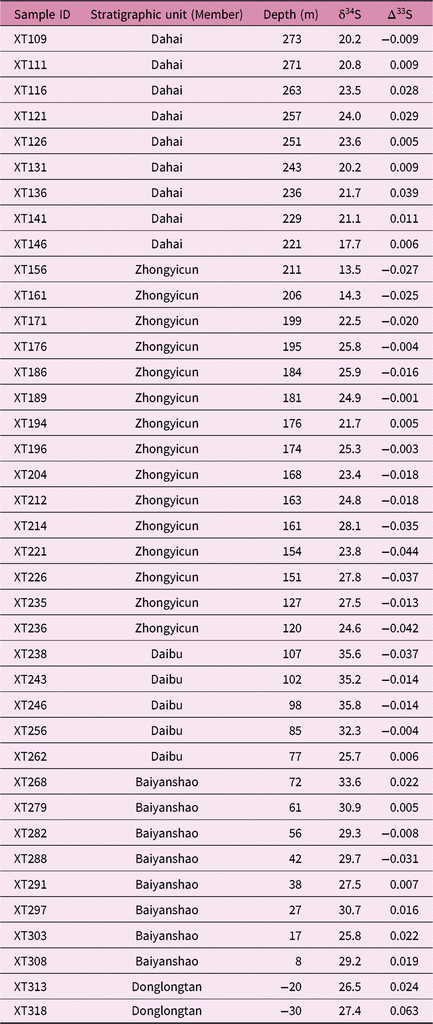
Sulphur isotope data are presented in Figure 2 and Table 1. Highly positive values in δ34S accompanying large variations in Δ33S are observed in this dataset. The values of δ34Spy vary between 13.5 ‰ and 35.8 ‰, with an average of 25.4 ‰. In the Dengying Formation, the values of δ34Spy vary in the range of ∼26 ‰ to 34 ‰, showing a progressive increase from ∼26 ‰ in the top of the Donglongtan Member to ∼34 ‰ in the uppermost Baiyanshao Member. The value of δ34Spy drops back to ∼26 ‰ in the lowermost Daibu Member, then rises again to ∼36 ‰ in the Daibu Member. The values of δ34Spy then remain stable at ∼25 ‰ within the Zhongyicun Member. A drastic decrease to ∼14 ‰ occurs at the top of the Zhongyicun Member (immediately below the interface of the Zhongyicun and Dahai members). The δ34Spy values then steadily increase to ∼24 ‰ within the middle Dahai Member, and decrease to ∼20 ‰ at the boundary between the Zhujiaqing and Shiyantou formations.
Sulphur isotopic compositions of sedimentary pyrites from Xiaotan section, South China

The values of Δ33Spy vary between −0.044 ‰ and 0.063 ‰, with an average of −0.003 ‰. The Δ33Spy values are positive (up to 0.063 ‰) in the lower to mid Dengying Formation but drop to −0.031 ‰ in the middle Baiyanshao Member. The Δ33Spy values rise to 0.022 ‰ in the upper Baiyanshao Member, drop to −0.044 ‰ crossing the Ed–C boundary, and then slowly rise to 0.005 ‰ in the mid Zhongyicun Member. Upward, Δ33Spy values drop to −0.02 ‰ across the boundary of the Zhongyicun and Dahai members. Above this interface, Δ33Spy values rise to positive values (up to 0.039 ‰) in the Dahai Member.
5. Discussion
Sulphur isotope signatures of pyrites in carbonate rocks provide information relevant to understanding sulphur partitioning in the sedimentary system and depositional environments (cf. Rickard, Reference Rickard2012). Formation of sedimentary pyrite is generally thought to involve biogenic hydrogen sulphide, a 32S-enriched product of microbial sulphate reduction (MSR). Other processes that may further modify sulphur isotopic compositions of pyrites include disproportionation and sulphide oxidation (e.g. Canfield & Thamdrup, Reference Canfield and Thamdrup1994; Canfield & Teske, Reference Canfield and Teske1996). Isotope fractionations associated with these pathways can propagate through sulphur mass transfer in closed systems or open systems, leading to mixed signals in the sedimentary pyrite–sulphur isotope records (Wu, Reference Wu2013). These processes provide context for understanding the sulphur isotope data of sedimentary pyrites reported here. The following discussion is structured to: (1) justify the connection between the sulphur isotope record from the Xiaotan section and the global sulphur cycle, (2) discuss mechanisms that may lead to the observed positive δ34Spy values, and (3) explore the dynamics of Δ33S and the implications for interpretation of the evolution of the sulphur cycle.
5.a. Connections between regional geochemical records and the global sulphur cycle
Pyrite is a minor constituent, but a major phase of reduced sulphur in carbonate rocks. The amount of pyrite–sulphur in reducing sediments is primarily controlled by the availability of sulphate, iron and organic matter (Berner, Reference Berner1984; Raiswell & Canfield, Reference Raiswell and Canfield1998). Early diagenetic pyrites have been generally suggested to represent a source of information about the sulphur microbial geological record (e.g. Canfield, Reference Canfield2004). In this study, chemical extraction was done at the bulk level, and the sulphur fraction hosted in carbonate samples is mainly in the form of FeS2 that can be extracted and converted to silver sulphide (Ag2S) by the chromium-reducible-sulphur (CRS) method (Canfield et al. Reference Canfield, Raiswell, Westrich, Reaves and Berner1986). The isotopic signatures of targeted syngenetic and/or early diagenetic pyrites (framboidal and/or equant morphologies) may potentially be compromised by those of post-depositional pyrites if any.
Post-depositional pyrites may form during consolidation of carbonate sediments and meteoric diagenesis. Sulphur sources for post-depositional pyrites can be derived from sulphate during carbonate dissolution, oxidation of previously formed sulphides and/or sulphur-bearing fluids (i.e. groundwater and seawater). However, low organic contents in carbonate rocks at the Xiaotan section (<0.1 % of total organic carbon (TOC) in most studied samples, except XT 176 with 2.5 % TOC, cf. Cremonese et al. Reference Cremonese, Shields-Zhou, Struck, Ling, Och, Chen and Li2013; Och et al. Reference Och, Shields-Zhou, Poulton, Manning, Thirlwall, Li, Chen, Ling, Osborn and Cremonese2013) and frequently low contents of reactive detrital iron minerals in carbonates imply a limited formation of post-depositional pyrites. Thus, we suggest that sulphur isotope compositions of syngenetic and/or early diagenetic pyrites were not significantly influenced by those of post-depositional pyrites. We also suggest that the sulphur isotope composition of bulk pyrite reflects an integrated signature of sulphides that formed and were buried in the sampled slice of sedimentary successions. Future studies of pyrite petrography and microanalysis of sulphur isotopes are warranted to better understand the formation mechanism of early diagenetic pyrites.
Local depositional factors such as tidal or storm-induced sediment remobilization and bioturbation and intensity of organic carbon cycling can have impacts on sulphur isotope compositions of sedimentary sulphides (e.g. Aller et al. Reference Aller, Blair and Brunskill2008, Reference Aller, Madrid, Chistoserdov, Aller and Heilbrun2010; Aller, Reference Aller, Holland and Turekian2014; Fike et al. Reference Fike, Bradley and Rose2015). This arises by facilitating the exchange between reduced sulphur pools (e.g. H2S, HS− and Sn2−) and oxidized sulphur pools (e.g. SO42−, S0 and S2O32−) in the depositional systems. For instance, the reduced species can be biologically/abiotically reoxidized by potential electron acceptors such as oxygen, nitrate and ferric iron and formed intermediate sulphur species (Jorgensen & Kasten, 2006). Subsequent disproportionation can produce more 34S-depleted reduced species, hence propagating isotope fractionations associated with these transformations into sedimentary pyrites (e.g. Canfield & Thamdrup Reference Canfield and Thamdrup1994). Therefore, the intensity of cycling of sulphur via different pathways in sediments can influence isotopic compositions of pyrites.
Processes like those discussed above can potentially result in geochemical records, like the sulphur isotope record of Xiaotan section, which may not be representative of the average isotopic composition on a global scale. This average reflects an integrated signature of isotopic compositions of buried pyrites formed along the floor of the world’s ocean basins. However, highly positive δ34S values of pyrites and its first-order evolutionary trajectory observed from Xiaotan section are also seen in multiple ocean basins globally spanning depositional environments from shallow to deep waters across the Ed–C boundary, but with various degrees of enrichment in 34S (e.g. Fike & Grotzinger, Reference Fike and Grotzinger2008; McFadden et al. Reference McFadden, Huang, Chu, Jiang, Kaufman, Zhou, Yuan and Xiao2008; Ries et al. Reference Ries, Fike, Pratt, Lyons and Grotzinger2009; Li et al. Reference Li, Love, Lyons, Fike, Sessions and Chu2010; Shen et al. Reference Shen, Xiao, Zhou, Kaufman and Yuan2010; Loyd et al. Reference Loyd, Marenco, Hagadorn, Lyons, Kaufman, Sour-Tovar and Corsetti2012; Feng et al. Reference Feng, Li, Huang, Chang and Chu2014; Fan et al. Reference Fan, Wen, Han, Zhu, Feng and Chang2018). Collectively, this line of reasoning suggests that information about the evolution of the global sulphur cycle can be extracted from isotopic signatures of pyrites from Xiaotan section and from other coeval 34S/32S records of sedimentary successions. Such embedded information may reflect changes in oceanic sulphate concentrations and isotopic compositions, which are controlled by geological and geochemical processes on a global scale (e.g. Kampschulte & Strauss, Reference Kampschulte and Strauss2004).
The general mechanism of sedimentary pyrite formation in the marine settings involves hydrogen sulphide production from MSR, abiotic precipitation of iron monosulphide, and transformation of iron monosulphide to sedimentary pyrite in the presence of partially oxidized sulphur species (Berner, Reference Berner1984; Canfield & Thamdrup, Reference Canfield and Thamdrup1994). Studies have shown that isotope fractionations associated with iron monosulphide formation and its transformation to pyrite are small (<1.5 ‰ in 34S/32S; Price & Shieh Reference Price and Shieh1979; Böttcher et al. Reference Böttcher, Brumsack, de Lange, Robertson, Emeis, Richter and Camerlenghi1998), but MSR alone can produce large fractionations (>70 ‰ in 34S/32S, e.g. Canfield et al. Reference Canfield, Farquhar and Zerkle2010; Sim et al. Reference Sim, Bosak and Ono2011). Consequently, sulphur isotope compositions of syngenetic and/or early diagenetic pyrites in carbonate rocks are reasonably assumed to reflect microbial fractionations of evolved seawater sulphate in sedimentary systems and/or coeval seawater sulphate in the oceans. This inference is also supported by the detailed carbon and strontium isotope chemostratigraphy of these carbonate sedimentary successions, which have been shown to reflect primary oceanic signatures (Li et al. Reference Li, Ling, Shields-Zhou, Chen, Cremonese, Och, Thirlwall and Manning2013).
In the following section, possible qualitative interpretations of the first-order feature of δ34Spy are discussed in the context of isotope fractionations and mass transfer from the perspective of dynamics systems. The functioning of the sulphur cycle on various scales is described by the reservoir model of the multi-box system. The subsystem (box) can be basically viewed as well-mixed segments of a simple pool. In terms of mass transfer, open systems are those where material exchange occurs between the studied system and the surroundings, whereas closed systems are those where there is no material exchange between the studied system and the surroundings.
5.b. Mechanism interpretation of highly positive δ34Spy
The sedimentary sulphur cycle can be viewed as mass transfer among three sulphur pools, including seawater sulphate, sedimentary pyrite and evaporite sulphate minerals. Constraints on isotopic compositions (34S/32S) of the latest Neoproterozoic and early Palaeozoic seawater sulphate exhibit strongly positive values (up to +40 ‰; cf. Fike & Grotzinger, Reference Fike and Grotzinger2008; Wu et al. Reference Wu, Farquhar and Strauss2014, Reference Wu, Farquhar and Fike2015). The apparent fractionations between seawater sulphate and pyrite at the Xiaotan section are in the range of ∼5 to 15 %, smaller than those estimates for the time interval (525–550 Ma) on a global scale (30 to 35 %; cf. Wu et al. Reference Wu, Farquhar, Strauss, Kim and Canfield2010, Reference Wu, Farquhar and Strauss2014), suggesting that pyrite isotopic compositions in this study are also dependent on the degree of openness of sulphur in the studied depositional system and the combined isotope fractionation (primarily controlled by MSR) in cycling of sulphur.
As discussed above, pyrite sulphur isotopic signatures primarily reflect microbial fractionations of seawater sulphate and represent the isotope mass balance of fluxes in and out of the sampled depositional slice. A possible mechanism to produce the observed positive δ34Spy is that pyrite was formed in a sulphate-closed sedimentary system. Isotope mass balance of total sulphur would produce an integrated signal that approaches that of influx sulphate into a parcel of sediments under a fully closed condition (e.g. Gomes & Hurtgen, Reference Gomes and Hurtgen2013; Wu, Reference Wu2013). High sedimentation/accumulation rates potentially lead to a partially closed sedimentary system, hence enhancing pyrite burial and also leaving a reservoir effect imprinted within the bulk isotope composition of pyrite. The accumulation rate at the Xiaotan section is estimated to be on the order of 10 m Ma (this study), an order of magnitude lower than that of the compiled strata records for this time interval (cf. Sadler, Reference Sadler1981). This simple comparison does not by itself rule out the possibility of the partially closed system that existed during deposition of sediments at the Xiaotan section. We also note that this explanation does not imply oceanic sulphate levels were low at this time, but instead implies a balance between the sedimentation/accumulation rate, labile organic matter for sulphate reducer and coupled sulphur/carbon cycles.
Another possible explanation for the highly positive δ34S values is that sedimentary pyrites were formed in a sulphate-limited system. Pyrite–sulphur during early diagenesis is originally produced from MSR (cf. Berner, Reference Berner1984). If sulphate uptake becomes a critical rate-limiting step in the sequence of sulphate reduction, quantitative MSR is expected to yield limited expression of large internal isotope fractionations of MSR (e.g. Wing & Halevy, Reference Wing and Halevy2014), leading to propagation of such minimum expressed fractionations into the rock records. The reduced expressed fractionation due to sulphate limitation is related to the rates of sulphate supply and consumption. Conditions of sulphate limitation can be induced by high total sedimentary sulphate reduction rate (consumption side) in water column/sediments, where sulphate is consumed faster than it is replenished by diffusion. Changes in sedimentary sulphate reduction rates have been invoked to explain the last 200 Ma sulphur record (Leavitt et al. Reference Leavitt, Halevy, Bradley and Johnston2013). However, low TOC contents and reactive iron minerals in carbonates at the Xiaotan section (Li et al. Reference Li, Ling, Shields-Zhou, Chen, Cremonese, Och, Thirlwall and Manning2013; Och et al. Reference Och, Shields-Zhou, Poulton, Manning, Thirlwall, Li, Chen, Ling, Osborn and Cremonese2013) and potentially low sedimentary sulphate reduction rate, driven by electron donor limitation, lend limited support to this scenario for the Ed–C sulphur record reported in this study.
A sustained low sulphate level (supply side) is a viable mechanism for promoting sulphate limitation. Isotope fractionation associated with MSR is compressed at low sulphate levels below 0.2 mM without regard to environmental/ecological and strain-specific factors (Canfield, Reference Canfield2001; Habicht & Canfield, Reference Canfield2001), while no regular isotope effects are observed in all cases at higher sulphate concentrations (Bradley et al. Reference Bradley, Leavitt, Schmidt, Knoll, Girguis and Johnston2016). When quantitative reduction occurs, pyrite burial is the dominant sulphur removal pathway from the oceans as compared to sulphate-bearing evaporite deposition. Thus, relatively high δ34Spy observed in this study can be readily attributed to near-quantitative reduction of sulphate at low seawater sulphate concentrations. This hypothesis is consistent with results of a few field-based studies that have observed highly positive δ34Spy values, and high variability in δ34S of CAS reflected overall low sulphate conditions (2 to 5 mM, or even lower) during the late Ediacaran period and into early Cambrian period (e.g. Loyd et al. Reference Loyd, Marenco, Hagadorn, Lyons, Kaufman, Sour-Tovar and Corsetti2012; Feng et al. Reference Feng, Li, Huang, Chang and Chu2014; Shi et al. Reference Shi, Li, Luo, Huang, Algeo, Jin, Zhang and Cheng2018; see also Horita et al. Reference Horita, Zimmermann and Holland2002; Wu et al. Reference Wu, Farquhar and Fike2015). Also note that fully restricted access to the open ocean is not a very likely explanation for the observed sulphur isotope records of pyrites, because marine transgression overran impressively large areas of the Earth’s surface during the early Cambrian (cf. Li et al. Reference Li, Ling, Shields-Zhou, Chen, Cremonese, Och, Thirlwall and Manning2013; Och et al. Reference Och, Shields-Zhou, Poulton, Manning, Thirlwall, Li, Chen, Ling, Osborn and Cremonese2013).
5.c. Implications of Δ33Spy
On the basis of the Δ33S evolutionary trajectory, the sulphur isotope record can be subdivided into three stages: the first stage (Stage 1: corresponding to the Donglongtan and Baiyanshao members) is characterized by overall positive Δ33S; the second stage (Stage 2: corresponding to the Daibu and Zhongyicun members and the lowest part of the Dahai Member) features a 10-million-year period of negative Δ33S, then a shift to positive values during the third stage (Stage 3: corresponding to the Dahai Member). The dynamics and implications of the patterns of Δ33Spy for ancient marine sulphate and Earth’s surface sulphur cycle are further explored and integrated into a global picture.
The values of Δ33Spy are determined by isotope mass balance of sulphur mobilization and redox transformations in the network of geochemical and biochemical reactions in which sulphur is in various oxidation states and forms. For the sulphur cycle model with three pools at transient steady state, the value of Δ33Spy is linked to that of sulphate (Δ33SSW) by the apparent fractionations between sulphate and pyrite. Mixing of Δ33Spy and Δ33SSW yields all possible solutions for the values of sulphur (Δ33Sin) flowing into the oceans/the studied depositional slices. Changes in Δ33Sin carry information about the changes in weathering pattern (e.g. preferred weathering of evaporite minerals or global averaging of weathered pyrite and evaporite minerals) and exchange between Earth surface sulphur and mantle sulphur (cf. Wu, Reference Wu2013).
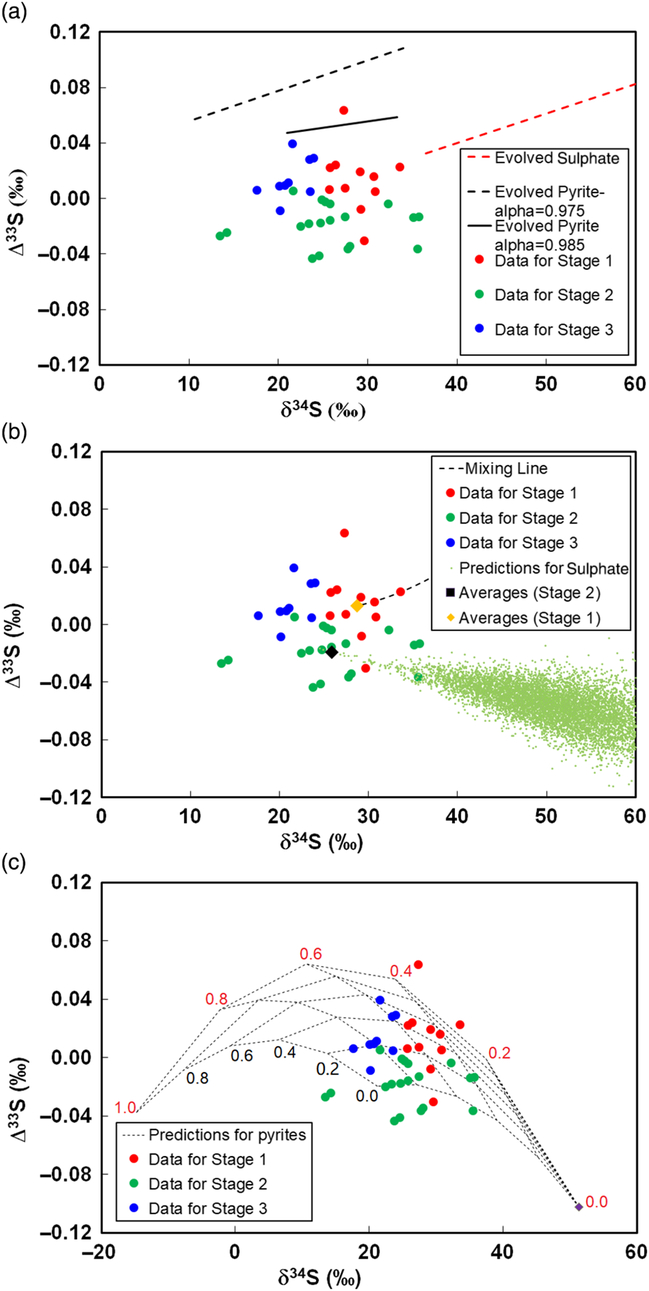
In the sulphur network, the values of Δ33Spy are expected to be higher than that of seawater sulphate (Δ33SSW) because the apparent value of λ (a parameter that relates 34S/32S to 33S/32S) is generally less than the canonical value of 0.515 (Farquhar & Wing Reference Farquhar and Wing2003; the values of λ are estimated in the range 0.5130 to 0.5135 for the latest Ediacaran and early Cambrian periods, cf. Wu et al. Reference Wu, Farquhar and Strauss2014). Under near-quantitative sulphate reduction, values of Δ33Spy would approach those of Δ33Ssw (Wu, Reference Wu2013). In both cases, the Δ33SSW evolutionary trajectory can be inferred from the observed three-stage path of Δ33Spy. Though these predictions are not unique, all model results share features in common that can be used for qualitative interpretation of the evolution of the sulphur cycle (Fig. 3).
(a) δ 34S versus Δ33S. The red, green and blue dots represent the isotopic data for stages 1–3, respectively (Stage 1: Donglongtan and Baiyanshao members; Stage 2: Daibu and Zhongyicun members; Stage 3: Dahai Member). The dashed red line (evolved oceanic sulphate) and the dashed and solid black lines (evolved pyrites with different fractionations, 34α = 0.975 and 34α = 0.985, respectively) represent Rayleigh-type isotopic trajectories under a closed system. The data in this study do not follow such a distillation-type evolution. (b) The black diamond represents the mean value for the grouped samples for Stage 2. The yellow-brown represents the mean value for the grouped samples for Stage 1. The dashed black line is the mixing curve that represents possible sulphur isotope compositions of influx sulphur for Stage 2, if the sulphur source is derived from younger deposited pyrites (this study) and sulphate (Wu et al. Reference Wu, Farquhar and Fike2015). The cloudy dots show examples of Monte Carlo simulation for predictions of coeval sulphate sulphur isotope compositions by using the average of pyrites for Stage 2. The maximum prediction for Δ33S coeval sulphate would approach the value of pyrite measured. Mixing of various portions of pyrites (Stage 2) and predicted sulphate cannot be reconciled with the estimates on the dashed black line. (c) The net shows an example of the allowed solution to the sulphur cycle model, similar to the one used in Wu et al. (Reference Wu, Farquhar and Fike2015) for sulphur isotopic compositions of pyrites. The configuration is constrained by the degree of sulphide reoxidation (fox: red number) and fraction of exchange between sulphur pools (fex: black numbers). It demonstrates that a single-isotope composition of sulphate (purple diamond) can produce pyrites with different isotopic compositions, and vice versa (b). Compositions of pyrites in one depositional environment may not represent the global average of buried pyrite and cannot yield unique predictions for seawater sulphur isotope compositions (b).

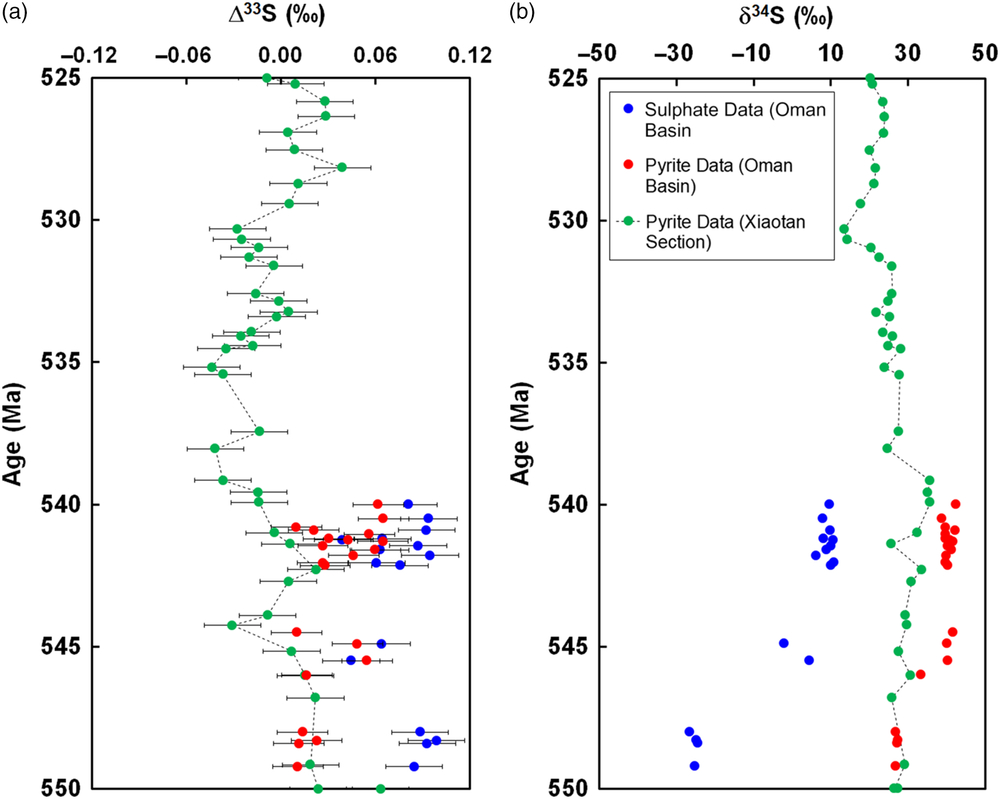
In line with this reasoning, only maximum predictions of Δ33SSW values (for Stage 1) are consistent with the measurements of CAS from sedimentary sequences of the Oman basin (Figs 3, 4, within 3σ of analytical uncertainty, Wu et al. Reference Wu, Farquhar and Fike2015), suggesting sulphate isotopic heterogeneity in the world’s coastal ocean at this time. Another inference about Δ33SSW (for Stage 2) with negative signals is also consistent with available data on CAS in the China platform (–0.037 ‰ for Δ33S and 44.7 ‰ for δ34S of sample with age of 537 Ma; cf. Johnston et al. Reference Johnston, Wing, Farquhar, Kaufman, Strauss, Lyons, Kah and Canfield2005) and the average values for the Cambrian seawater sulphate (–0.020 ‰ for Δ33S and 33.0 ‰ for δ34S, cf. Wu et al. Reference Wu, Farquhar and Strauss2014). Work on CAS at the Xiaotan section and/or Gaojiashan section, northern Yangtze platform, South China, (from which, δ34S values of CAS are similar to those of the Oman basin; cf. Cui et al. Reference Cui, Kaufman, Xiao, Peek, Cao, Min, Cai, Siegel, Liu, Peng, Schiffbauer and Martin2016) can be further carried out to assess such implications.
Δ33S versus age and δ34S versus age. The green dots represent pyrite-sulphur data reported in this study; the red dots and blue dots are data for CAS and pyrites in the Oman basin, respectively (Wu et al. Reference Wu, Farquhar and Fike2015). The error bars for isotopic values are three standard deviations associated with mass spectrometry isotope analysis (0.018 ‰).

The covariation of Δ33Spy–δ34Spy presented in this study at the Ed–C boundary reflects a first-order monotonous decrease in Δ33Spy, but a drop in δ34Spy (from ∼30 ‰ to 25 ‰, ∼542–541 Ma) followed by an increase (up to ∼35 ‰, ∼541–539 Ma). This evolutionary trajectory shows no evidence to support the hypothesis that global cessation and/or initialization of bioturbation-induced sulphide oxidation should have a strong influence on the oceanic sulphate levels and isotopic compositions of sulphate and sedimentary pyrites (Canfield & Farquhar, Reference Canfield and Farquhar2009). This is inferred because a cessation of sulphide oxidation on a global scale may cause a transient increase in δ34S (with an accompanying increase in Δ33S to a small magnitude) and a significant drop in oceanic sulphate levels; and also because an initialization of sulphide oxidation may produce a transient drop in δ34S (with an accompanying drop in Δ33S to a small magnitude; Wu, Reference Wu2013) and significant increase in oceanic sulphate levels. Thus, a shift from positive to negative Δ33Spy (Stage 1 to Stage 2) at the Ed–C transition, extending into the early Cambrian, suggests that isotopic compositions of sulphur (Δ33Sin) flowing into the oceans exhibit negative values.
Values of Δ33Sin are balanced by the relative fraction of weathered sulphide to the total sulphur that entered the oceans at transient steady state. It has been suggested that enriched δ34S and Δ33S of influx sulphur, via rapid recycling of short-lived sulphur pools, such as Neoproterozoic strata containing 34S-enriched (and 33S-enriched) sulphates and younger deposited pyrites, is a viable mechanism for reasonably explaining the first-order observation of multiple sulphur isotope records (positive Δ33S and δ34S for pyrite and sulphate) of the upper Ediacaran – lower Cambrian sedimentary sequences in the Oman basin (Wu et al. Reference Wu, Farquhar and Fike2015). This scenario of rapid recycling can readily interpret the sulphur isotope systematics of late Ediacaran pyrites reported in this study under sustained low sulphate levels (2–5 mM or lower for Stage 1), but in contrast to the inferred increasing sulphate levels (∼17 mM) in the Oman basin during the late Ediacaran (Wu et al. Reference Wu, Farquhar and Fike2015).
The 10-million-year prolonged negative signatures observed here (Stage 2) make it difficult to reconcile signals by rapid cycling and mixing of younger sulphate minerals (inferred values for Stage 1 in this study or values of sulphate from the Oman basin in Wu et al. Reference Wu, Farquhar and Fike2015; Fig. 3a, b) and younger deposited pyrite sulphur with observed positive Δ33S (Stage 1), but potentially by enhanced exposure and preferential weathering of older deposited sulphide (with negative Δ33S) relative to sulphate in areas of active continental margins (e.g. Proterozoic pyrites of ∼1870 Ma; Johnston et al. Reference Johnston, Poulton, Fralick, Wing, Canfield and Farquhar2006). The enhanced recycling of older deposited pyrites may be linked to tectonic processes during break-up of the supercontinent Rodinia and the subsequent assembly of the supercontinent Gondwana. Such implications can possibly be assessed with work on geochemical signatures (i.e. Os isotope systematics) of chemical weathering as an indicator of uplift and denudation at this critical time.
Acknowledgements
This study is supported by National Natural Science Foundation of China (Y.L., grant no. 41373009; (N.W., grant no. 41673005). N.W. is grateful to Linghu Chong and Feng Qingyang for opening the horizons. James Farquhar is thanked for discussing sulphur isotope geochemistry. Yiwen Cao is thanked for cleaning up the figures. Joost Hoek is acknowledged for laboratory guidance. Yanan Shen, Guijie Zhang and Xiaolin Zhang are acknowledged for allocating samples during the initial stage of this project.