Introduction
The U937 human cell line is used as an in vitro model of monocyte and macrophage cell biology. This cell line has provided insights on processes as diverse as: monocyte to macrophage differentiation, cytotoxicity, host–pathogen interactions (parasite, bacterial and viral), cancer and inflammation among others.
While U937 cells are useful, they are also challenging to modify at a genetic level. Probably for this reason, the study of gene function in this cell line, by techniques like gene silencing is not as widespread as with other models that are easily transfected. One strategy to overcome this problem is the adoption of more aggressive methods for introducing genetic constructs, followed by the selection with antibiotics of the modified cells. For example, lentiviral vectors have proven successful by enhancing the modification efficiency of U937 cells (Zhang et al., Reference Zhang, Zhang, Zhang, Cao, He, Chen and Gu2013). The selection strategy however, usually precludes the adoption of this cell line for studies in which the control of gene expression is desirable, such as those involving genes that are critical for cell survival or proliferation. Several processes have been developed for inducible gene control including a system based on the progesterone antagonist mifepristone (Ngan et al., Reference Ngan, Schillinger, DeMayo and Tsai2002), the use of promoters of heat shock genes controlled via laser-induced heat (Suzuki et al., Reference Suzuki, Toyoda, Shimojou and Takagi2013) and the design of light-inducible optogenetic technologies (Kim and Heo, Reference Kim and Heo2018). Researchers have designed many of these systems as synthetic gene switches and networks for their use in gene therapy (Weber and Fussenegger, Reference Weber and Fussenegger2006, Reference Weber and Fussenegger2011). More recently, the Clustered Regularly Interspaced Short Palindromic Repeats (CRISPR)/CRISPR-associated protein 9 (Cas9) system was coupled with inducible expression systems to promote a higher precision of genome editing (Dai et al., Reference Dai, Chen, Fang, Li and Bai2018). One of the most used approaches for inducible control of gene expression is the so-called Tet On and Tet Off systems. They depend on the reversible interaction between a protein [tetracycline repressor (TR)] and a DNA regulatory sequence (tetO) from E. coli. Although these methods are largely used for in vitro models, they also have been employed on gene therapy scenarios (Ting et al., Reference Ting, Kyba and Daley2005; Das et al., Reference Das, Tenenbaum and Berkhout2016).
To take advantage of the tetracycline-inducible regulatory system for the study of monocyte and macrophage cell biology, especially in the context of intracellular parasite–macrophage interaction, we set our goal to generate a U937-derived cell line that serves as a platform to create further cell lines with the property of tetracycline-regulated gene expression (induction or silencing). In this work, we generated and characterized the U937-TR and two derived cell lines as positive and negative controls. These biological tools are available for the scientific community that uses U937 as an experimental model.
Materials and methods
Cell culture
U937 and derived cells lines [American Type Culture Collection (ATCC®) CRL-1593.2™, USA] were cultured in RPMI-1640 medium (Sigma-Aldrich, MO, USA) supplemented with 10% fetal bovine serum (FBS) (Eurobio, USA) at 37°C in a 5% CO2 atmosphere. Cell cultures were consistently maintained at a concentration between 1 × 10⁵ and 1 × 10⁶ cells mL−1. U937-derived cell lines were cultured under the same conditions but in the presence of the corresponding selection antibiotic: Geneticin® (Invitrogen 11811-031, USA) 1500 μg mL−1 for U937-TR, Blasticidin S-HCl (Invitrogen R210-01, USA) 10 μg mL−1 for U937-miRNA-NegC and U937-miRNA-Lmna. Both antibiotics were employed for U937-TR-miRNA-NegC and U937-TR-miRNA-Lmna. Promastigotes of Leishmania (Viannia) braziliensis (MHOM/BR/00/M2903) were cultured in Schneider medium (Sigma-Aldrich, USA) supplemented with 10% FBS at 25°C. HEK-293FT cells were cultured in DMEM (Gibco, USA) medium supplemented with 6 mm L-glutamine, 1 mm non-essential amino acids, 1 mm sodium pyruvate and 10% FBS at 37°C in a 5% CO2 atmosphere. Geneticin® 500 μg mL−1 was added to the culture medium except during virus production.
PMA-induced differentiation
Since all assays performed in this study involved the use of U937 macrophage-like cells, a PMA-based differentiation protocol was used. 5.0 × 10⁵ cells from U937 or U937-derived cell lines were re-suspended in 2 mL of RPMI 10% FBS supplemented with 100 ng mL−1 PMA. Cells were seeded on top of glass coverslips in wells of a 6-well plate. Cells were allowed to differentiate during 5 days at 37°C and a 5% CO2 atmosphere.
Lentivirus production
Packaging lentiviral vectors: pCMVdelta-8.7 [encoding human immunodeficiency virus Gag-pol driven by a CMV promoter], and pVSV-G [encoding vesicular stomatitis virus glycoprotein (VSV-G) for pseudo-typing], were generously donated by Doctor David Ann (Clavijo et al., Reference Clavijo, Chen, Kim, Reyland and Ann2007). Expression plasmid pLenti3.3/TR was acquired as part of the ViraPower HiPerform T-REx Gateway Expression System (Invitrogen, USA, 2009a). Expression plasmids: pLenti-miRNA-Cneg and pLenti-miRNA-Lmna, were obtained from pcDNA™6.2-GW/EmGFP-miR-neg control plasmid and pcDNA™6.2-GW/EmGFP-miR-LMNA, respectively, through the corresponding BL and LR recombination reactions of the Gateway® Technology from Invitrogen (Invitrogen, USA, 2005, 2009a, 2009b). For lentivirus production, 2.5 × 10⁶ HEK-293FT cells were transfected with 60 μg DNA of the packaging vectors and the corresponding expression vector (either pLenti3.3/TR or pLenti-miRNA-Cneg or pLenti-miRNA-Lmna). Transfected cells were cultured as stated above and supernatant medium collected and replaced for fresh medium 16, 24, 48, 72 and 96 h post transfection. Virus containing supernatant was centrifuged at 2000 g for 15 min at 4°C, filtered through a 0.45 μm membrane and stored at 4°C until concentration. Amicon® Ultra-15 Centrifugal Filter Devices from Millipore, USA with a molecular weight cut-off of 30 000 were used according to the manufacturer directions. Titration was performed by transducing HEK-293FT cells at different limiting dilutions of the viral batch and quantifying green fluorescent protein (GFP)-positive transduced cells.
miRNAs sequences
miRNA sequence aimed towards Lamin A:
TGCTGTGGAAGTCCAGTTCCTCCTTCGTTTTGGCCACTGACTGACGAAGGAG
GCTGGACTTCCACAGG
Negative control miRNA sequence:
AAATGTACTGCGCGTGGAGACGTTTTGGCCACTGACTGACGTCTCCACGCAG
TACATTT
U937-derived cell lines production
U937-TR was achieved by four consecutive transductions using pLenti3.3/TR as the expression vector. After the fourth transduction, the resulting U937-TR cell line was used to produce the U937-TR-miRNA-NegC and U937-TR-miRNA-Lmna cell lines using as expression vectors, the corresponding pLenti-miRNA-Cneg or pLenti-miRNA-Lmna plasmids, respectively. In parallel, U937 cells were transduced to produce the U937-miRNA-NegC and U937-miRNA-Lmna cell lines. For transduction, 1 × 10⁵ viable cells were mixed with 1 mL of the concentrated virus batch supplemented with polybrene 9 μg mL−1 and incubated for 24 h at 37°C and a 5% CO2 atmosphere. After transduction, cells were maintained at a minimal concentration of 1 × 10⁵ cells per mL, until full recovery. U937-TR-miRNA-NegC and U937-TR-miRNA-Lmna cells were further enriched for optimal expression TR control by three rounds of cell sorting using a FACSAria II (BD Biosciences, USA). Cells were selected based on their GFP expression after a 72 h treatment with (100 ng mL−1) tetracycline, during the first cell sorting. After this initial sorting, less than 78% of the cell population was GFP-positive upon tetracycline induction, therefore we performed two additional selection procedures. It was important, both that the cells expressed GFP in the presence of tetracycline and that they did not express it in the absence of tetracycline. For this reason, during the second sorting, cells were selected based on their lack of GFP expression when no tetracycline was present in the culture medium. A final third sorting round was completed under the same conditions of the first one, to obtain a greater proportion of cells expressing GFP after tetracycline induction (77% after first sorting round vs 92.2% after the third round; see Supplementary Fig. S1).
Phagocytic capacity assay
U937 and derived cell lines were differentiated on top of glass coverslips with PMA treatment as detailed above. In parallel, 3 × 10⁸ E. coli (TOP 10, Life Technologies, USA) bacteria were harvested at logarithmic growth phase before heat inactivation in a water bath at 70°C for 1 h. Bacteria were later stained with 3.3 μg mL−1 of 4’, 6-Diamidino-2-Phenylindole, Dihydrochloride (DAPI) (Molecular Probes, USA) for 5 min. Excess DAPI was removed twice by centrifugation and resuspension in phosphate buffer saline (PBS). Bacteria were then quantified by haemocytometer and suspensions were prepared before addition to differentiated cells at a concentration of 10 bacteria per cell. Differentiated cells and DAPI-labelled inactivated bacteria were incubated for 20, 40 or 60 min at 37°C, 5% CO2 atmosphere. After one wash with PBS, each experimental unit was labelled by 5 min incubation with 5 μ m propidium iodide (PI) in PBS at room temperature protected from light. After one more wash with PBS, coverslips were mounted on microscope slides using ProLong® Gold Antifade Mountant (Molecular Probes, USA) and allowed to curate for 24 h protected from light. Samples were examined and registered using an epi-fluorescence Nikon Eclipse 50i microscope with a 452 nm emission filter for DAPI and a 617 nm emission filter for PI. One hundred differentiated cells randomly located on the coverslip were observed per experimental unit and the number of bacteria labelled with DAPI, PI or both were registered.
Leishmania infection of PMA-differentiated cells
U937 and derived cell lines were cultured on top of glass coverslips and induced to differentiate with PMA treatment. Leishmania (Viannia) braziliensis promastigotes at early hours of stationary growth phase were washed in PBS, quantified and opsonized by incubation in RPMI-1640 medium supplemented with 10% human AB type serum, for 1 h at 34°C and 5% CO2 atmosphere. Opsonized parasites were added to differentiated cells at a 15:1 ratio (parasite:differentiated cell) and incubated for 2 h at 34°C and 5% CO2 atmosphere in RPMI-1640 medium supplemented with 10% FBS. After three washes with PBS, infected cells were incubated for 72 more hours under the same culture conditions. This procedure was executed in triplicate for each cell line. After the 72 h infection, coverslips were washed once with PBS, fixed for 2 min in methanol and let to air dry at room temperature before staining with 10% Giemsa for 10 min. Then cover slips were rinsed with distilled water, let to air dry at room temperature before mounting on microscope slides with cito-Citorisina-60 (BER Escorcia Ltda., Colombia). Samples were examined at 1000 magnification using a Nikon Eclipse 50i microscope. Two hundred differentiated cells per coverslip were randomly selected and each cell was then categorized into one of two groups depending on its condition: non-infected or infected. In case of infection, we counted the number of parasites per cell. With this method, we determined the percentage of infected macrophages per treatment and the number of parasites per infected macrophage per treatment.
Flow cytometry assays
For Lamin A detection, cells were fixed with methanol at −20°C for 15 min followed by permeabilization with 0.1% Tween 20 in PBS during 30 min. Non-specific protein binding was reduced by incubation with 1% BSA for 20 min. Additional 20 min incubation with 1 μg human IgG (Invitrogen 02-7102, USA) was employed to block Fc receptors. Cells were incubated for 30 min at room temperature, with a 1:100 dilution of anti-Lamin A primary antibody (sc-20680, Santa Cruz Biotechnology, USA) in 1% BSA and 0.2% Saponin in PBS. Cells were incubated for 30 min in the dark, with a 1:100 dilution of secondary antibody anti-rabbit IgG conjugated to Alexa-fluor 633 (Life Technologies A21071, USA) in 1% BSA and 0.2% Saponin in PBS. Cells were kept at 4°C until flow cytometry analysis. PBS washes were used between each step in the protocol. In each flow cytometry analysis, 10 000 events were collected in a FACSAria II (BD Biosciences, USA) running the software FACSDiva (BD Biosciences, USA).
The gating strategy slightly varied according to the purpose of the analysis. Cells were selected from total events by plotting Forward Scatter (FSC) and Side Scatter (SSC), and then doublets were eliminated by plotting FSC-Height vs FSC-Area. Depending on the analysed fluorochrome, events were acquired using the corresponding acquisition channel (fluorescein isothiocyanate, allophycocyanine, Alexa-fluor 633 or PerCP/Cy5.5 acquisition channel). We used the corresponding isotype control-stained cells as negative controls.
Statistical analysis
Data were analysed with Prism 5 Software. D'Agostino & Pearson omnibus normality test was performed and no distribution data behaved as a normal distribution. Therefore, the non-parametrical Kruskal–Wallis test was performed followed by Dunn's Multiple Comparison Test (P < 0.05 or P < 0.01).
Results
Generation of transduced U937 cell lines
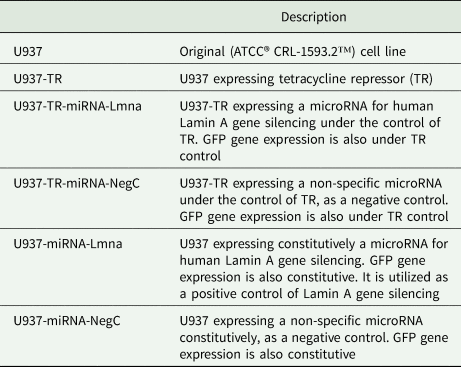
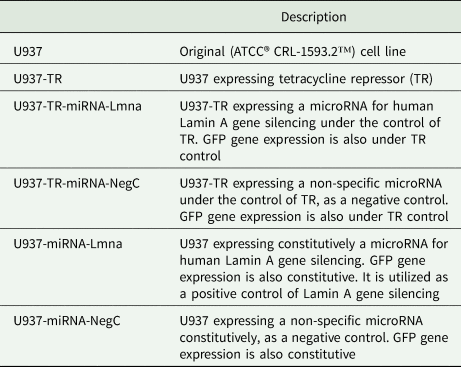
To generate a U937-derived cell line with the capacity to regulate gene expression in an inducible fashion, we transduced this original cell line with the lentiviral construct pLenti3.3/TR from the ViraPower HiPerform T-REx Gateway Expression System (Invitrogen, USA, 2009a). Preliminary results indicated the need of several rounds of transduction to achieve an appropriate level of gene expression control (data not shown). Four such rounds of transduction were necessary and yielded the so-called U937-TR cell line. We then created the necessary derived cell lines to assess the inducible gene expression using a microRNA (miRNA) able to silencing the gene Lamin A (Lmna). As a control, we also generate a cell line expressing a miRNA with no specificity against any known human gene. We used the genetic constructs pLenti-miRNA-Lmna and pLenti-miRNA-Cneg to create the corresponding U937-TR-miRNA-Lmna and U937-TR-miRNA-NegC cell lines via lentiviral transduction of U937-TR cells. We performed these lentiviral transductions simultaneously to the parental U937 cell line, producing cells with constitutive expression of the miRNAs and the reporter GFP gene in the resulting U937-miRNA-Lmna and U937-miRNA-NegC cell lines. In total, we generated five U937-derived cell lines (Table 1).
Names and description of U937-derived cell lines.
To determine the extent of leakage gene expression in U937-TR-miRNA-NegC and U937-TR-miRNA-Lmna, we performed FACS analysis comparing untreated vs tetracycline-treated cells. In total, 12 and 6% (respectively) of the cell populations increased GFP reporter gene expression upon tetracycline treatment (Supplementary Fig. S1). It was therefore necessary to enrich the subset populations that expressed the reporter GFP only after tetracycline treatment. We accomplished this by three rounds of cell sorting with positive selection (the first and third sorting) and negative selection (the second sorting). These cell sorting procedures produced cell populations with 92% of positive GFP expression upon tetracycline treatment (see Supplementary Fig. S1B). These cell lines were from this point on called U937-TR-miRNA-NegC and U937-TR-miRNA-Lmna and were the subject of the characterization that followed.
U937 and derived cell lines have comparable characteristics when treated with PMA
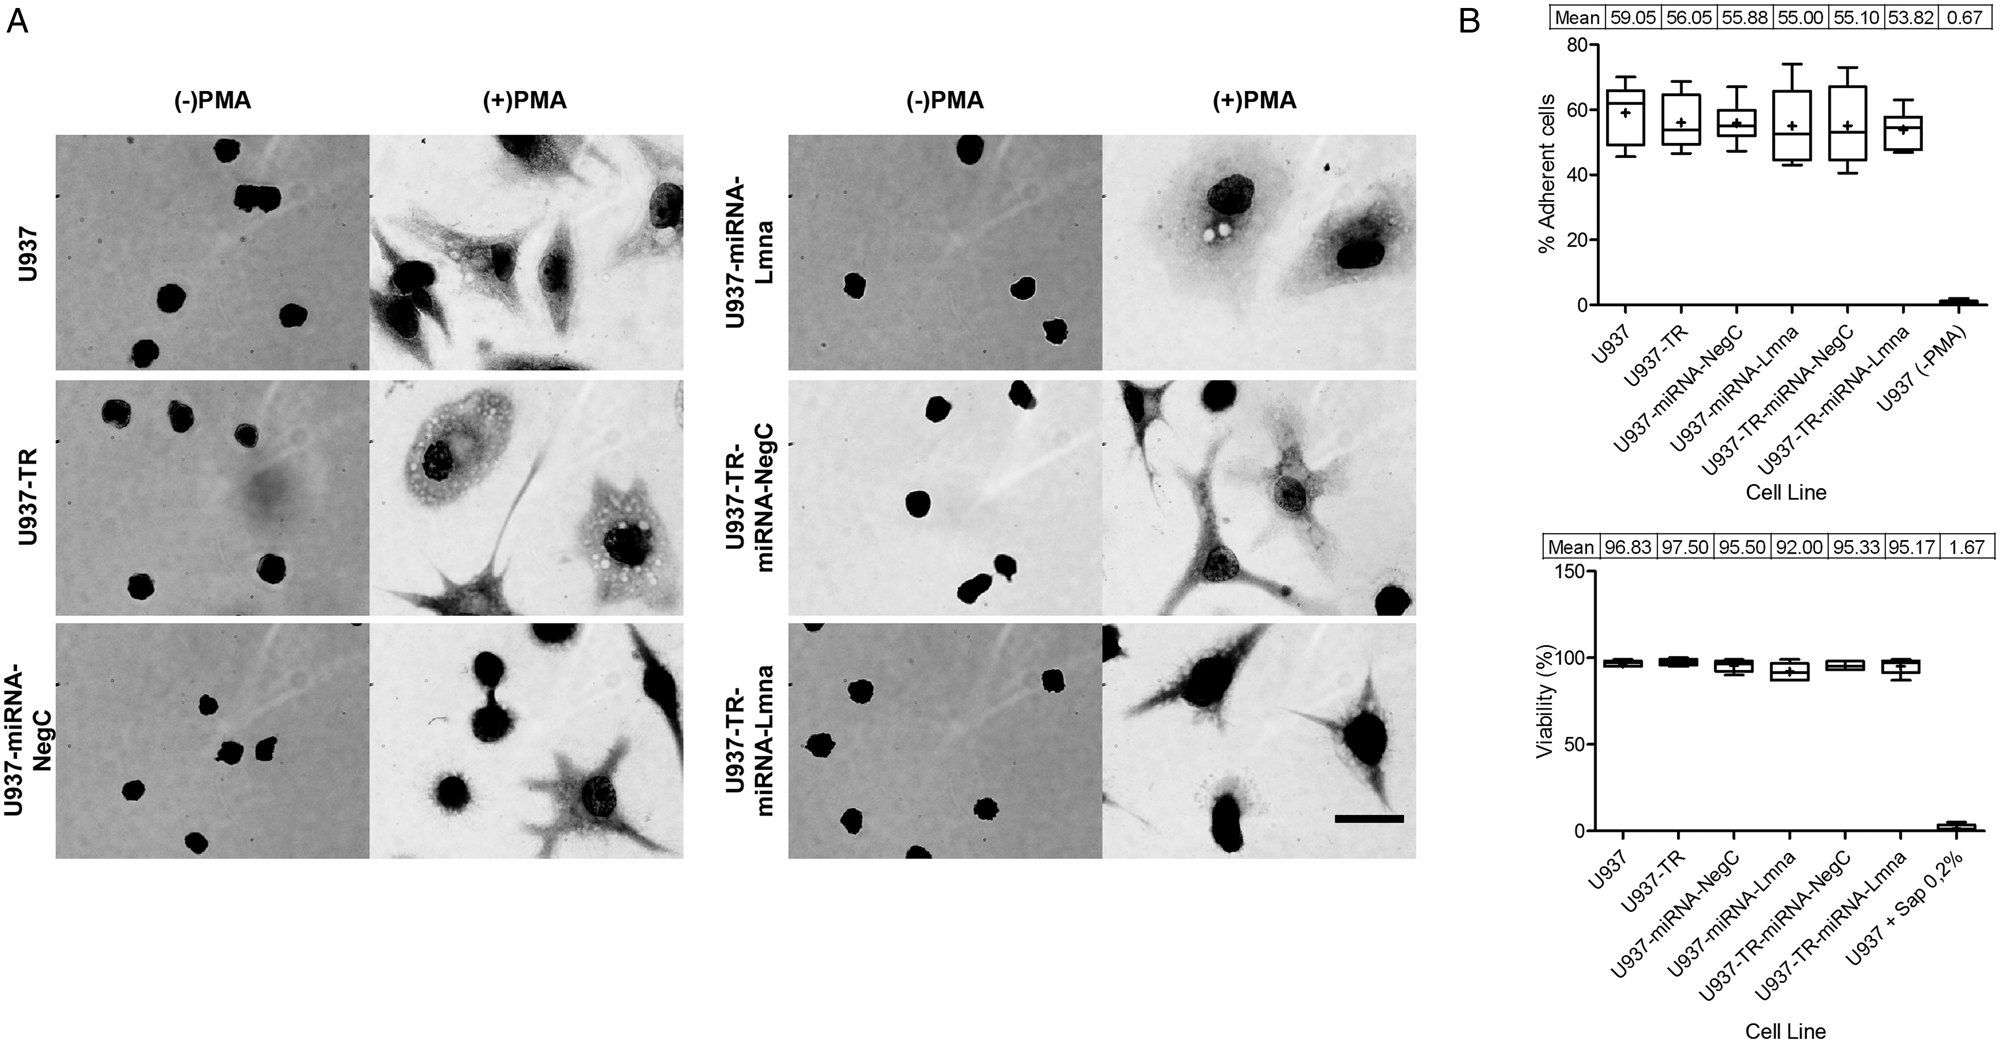
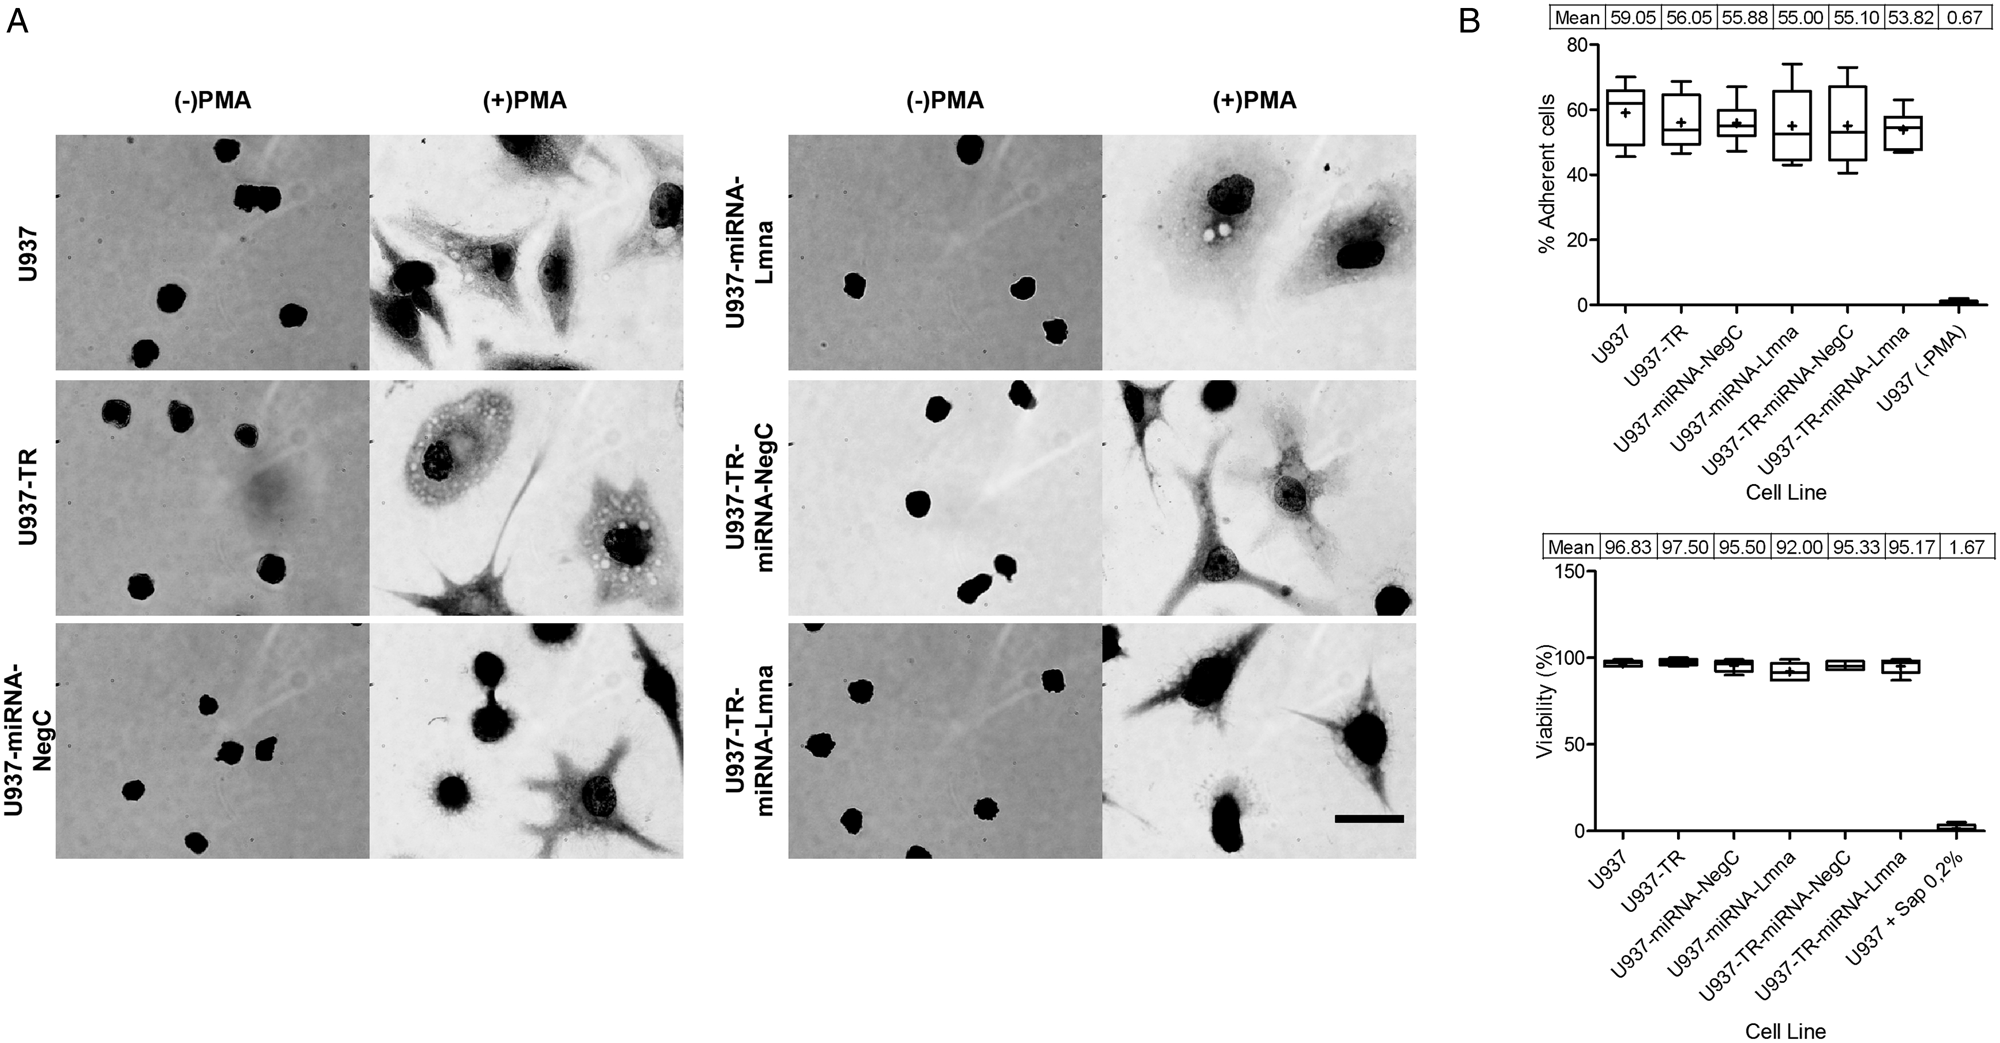
PMA treatment for 5 days induces morphology and adherence capacity changes on U937 cells. To verify whether PMA induces phenotypic changes like those characteristic of the parental cell line, we exposed each cell line to PMA and evaluated morphology, adherence to substrate and viability. All the derived cell lines displayed similar morphological changes measured through a CellProfiler software pipeline (Carpenter et al., Reference Carpenter, Jones, Lamprecht, Clarke, Kang, Friman, Guertin, Chang, Lindquist, Moffat, Golland and Sabatini2006). Fig. 1A and Supplementary Fig. S2 show these analyses. About 55% of the PMA-treated cells in each cell line population shifts from a non-adherent phenotype to an adherent one after 5 days of PMA treatment. Furthermore, cell viability was consistent around 100% among all cell lines (Fig. 1B).
Morphological and cell adherence changes induced by PMA treatment on U937 and derived cell lines. (A) Cells from each cell line were cultured on glass coverslips and treated with 100 ng mL−1 PMA during 5 days [( + ) PMA], or left untreated [(−) PMA], before harvesting for Giemsa staining. Panels show representative images at the same scale (scale bar = 50 μm). (B) Both adherent and suspended cells were quantified and viability measured by PI exclusion of intact cell membranes. On average, 30 frames per experimental unit were acquired until obtaining 100 cell images. Box and whiskers graphs show maximum value, minimum value, median, mean ( + sign and table), 25th, 50th and 75th percentiles of each registered population of experimental units (n = 6). Upper graph displays the results measuring the percentage of adherent cells after PMA treatment. Lower graph shows the percentage of viability of adherent cells. U937 differentiated cells treated with Saponin 0.2% were used as an experimental control of membrane permeabilization to PI. Kruskal–Wallis test was performed followed by Dunn's Multiple Comparison Test [All groups except U937 (–PMA), P < 0.05].
Flow cytometry analysis of U937 cells revealed that in response to PMA, there was an increase in the expression levels of CD11b, although there was a residual population that did not show such effect (Supplementary Fig. S3A). The derived cell lines exhibited a comparable effect, but the U937-miRNA-Lmna cell line had a smaller fraction of the cell population with increased CD11b expression. CD68 expression also increased in response to PMA in U937 cells, but a bimodal distribution suggested two possible populations (Supplementary Fig. S3B) present in all derived cell lines. We conclude that the derived cell lines display a similar response to PMA treatment as U937 in terms of adherence capacity, morphology and CD11b and CD68 expression.
Phagocytic and parasite–host capacities of U937 and derived cell lines
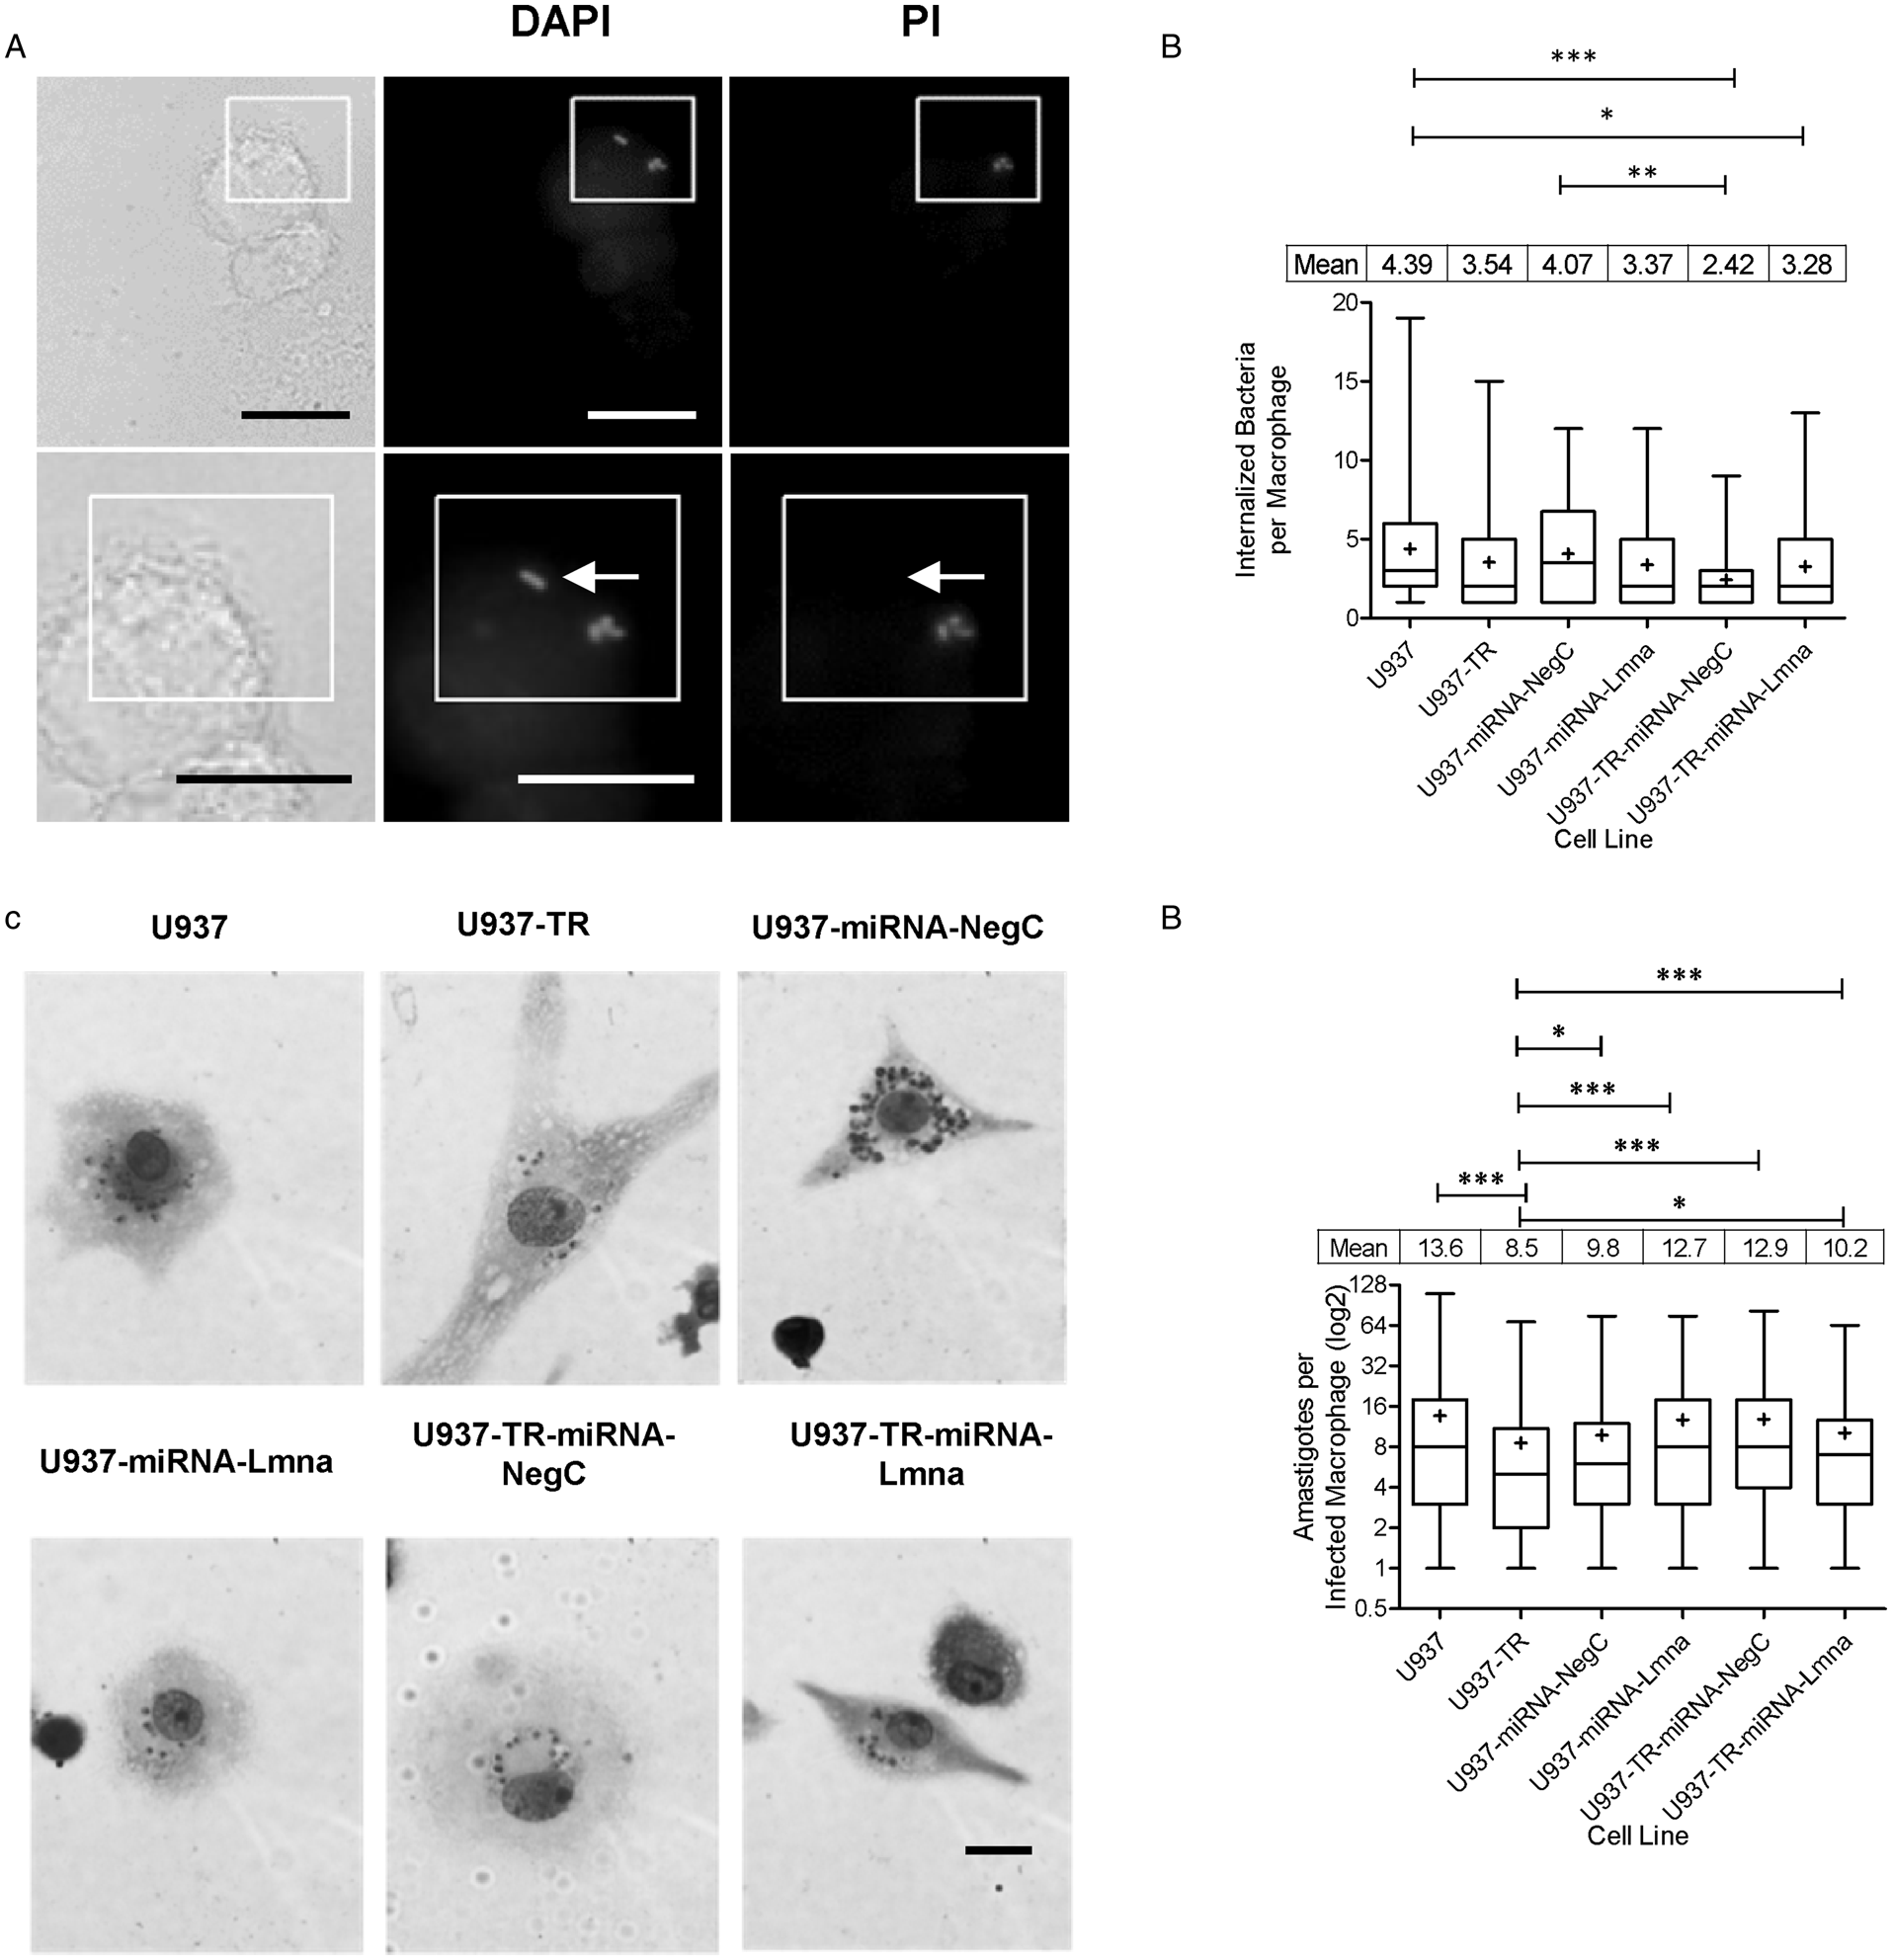
To test known properties of macrophage-like cells, we standardized a phagocytosis assay establishing the proof of concept and optimal time for bacteria internalization (Supplementary Fig. S4A), using U937 macrophage-like cells. According to this assay, after 40 min of incubation, PMA-differentiated U937 cells reached a plateau in terms of the number of bacteria that adhere per cell. At 60 min most of those bacteria were internalized (phagocytosed) as suggested by the percentage of bacteria positive for PI staining. Figure 2A shows bacteria in the same focal plane that are discernably different in terms of DNA staining. While DAPI stains every bacterium (pre-staining of heat-inactivated bacteria), PI only does so to those bacteria in the extracellular space of U937 (non-internalized bacteria). We found no statistical significance among all the cell lines studied regarding the percentage of macrophages that co-localized with at least one bacterium (range from 30 to 41%; Supplementary Fig. S4B). On average, each derived cell line showed a lower number of internalized bacteria per macrophage when contrasted with the parental cell line. That reduction in phagocytic capacity was statistically significant in the derived cell lines with double genetic modification (TR and either miRNA-NegC of miRNA-Lmna, Fig. 2B). We conclude that U937 and the derived cell lines with a single genetic modification have a comparable capacity for phagocytosis of heat-inactivated bacteria. Careful consideration should be paid to the phenotypic effect when the second genetic modification is done.
Phagocytic and parasite–host capacities of U937 and derived cell lines. Heat-inactivated E. coli were labelled with DAPI, washed and added to PMA-differentiated U937 and derived cell lines. After incubation for 60 min at 37°C, cells were washed and exposed to PI 5 μ m and incubated at room temperature for an additional 5 min. After washing excess PI, labelled bacteria presence (or lack thereof) on cells was registered by observation using a fluorescence microscope. A representative image (A) shows two differentiated U937 cells in bright field (left), blue channel (centre) for DAPI labelling and red channel (right) for PI labelling. Insert is magnified in the bottom panel. Arrow indicates bacteria positive for DAPI labelling and negative for PI labelling at the same focal plane, suggesting internalization by the macrophage. Bacteria below the arrow are positive for both DAPI and PI, suggesting that they are not internalized by the macrophage (scale bar = 20 μm). (B) Internalized bacteria per cell (macrophage) were quantified, for each cell line. Individual cell records from three replicates were combined to show the entire population distribution of values for each cell line (n ranges from 83 to 100). (C) Representative images of Leishmania (Viannia) braziliensis infected PMA-differentiated cells for each cell line. Giemsa staining was applied after 72 h of in vitro infection with a parasite: cell ratio of 15 to 1. Then, 200 cells per microscope slide were registered (scale bar = 20 μm). (D) Parasitic load (number of amastigotes per infected cell). Individual infected cell records from three replicates were combined to show the entire population distribution of values for each cell line (n ranges from 377 to 410 records). Box and whiskers graphs show maximum value, minimum value, median and mean ( + sign and table), 25th, 50th and 75th percentiles of each registered population. Kruskal–Wallis test was performed followed by Dunn's Multiple Comparison Test (*P < 0.05, **P < 0.01, ***P < 0.001).
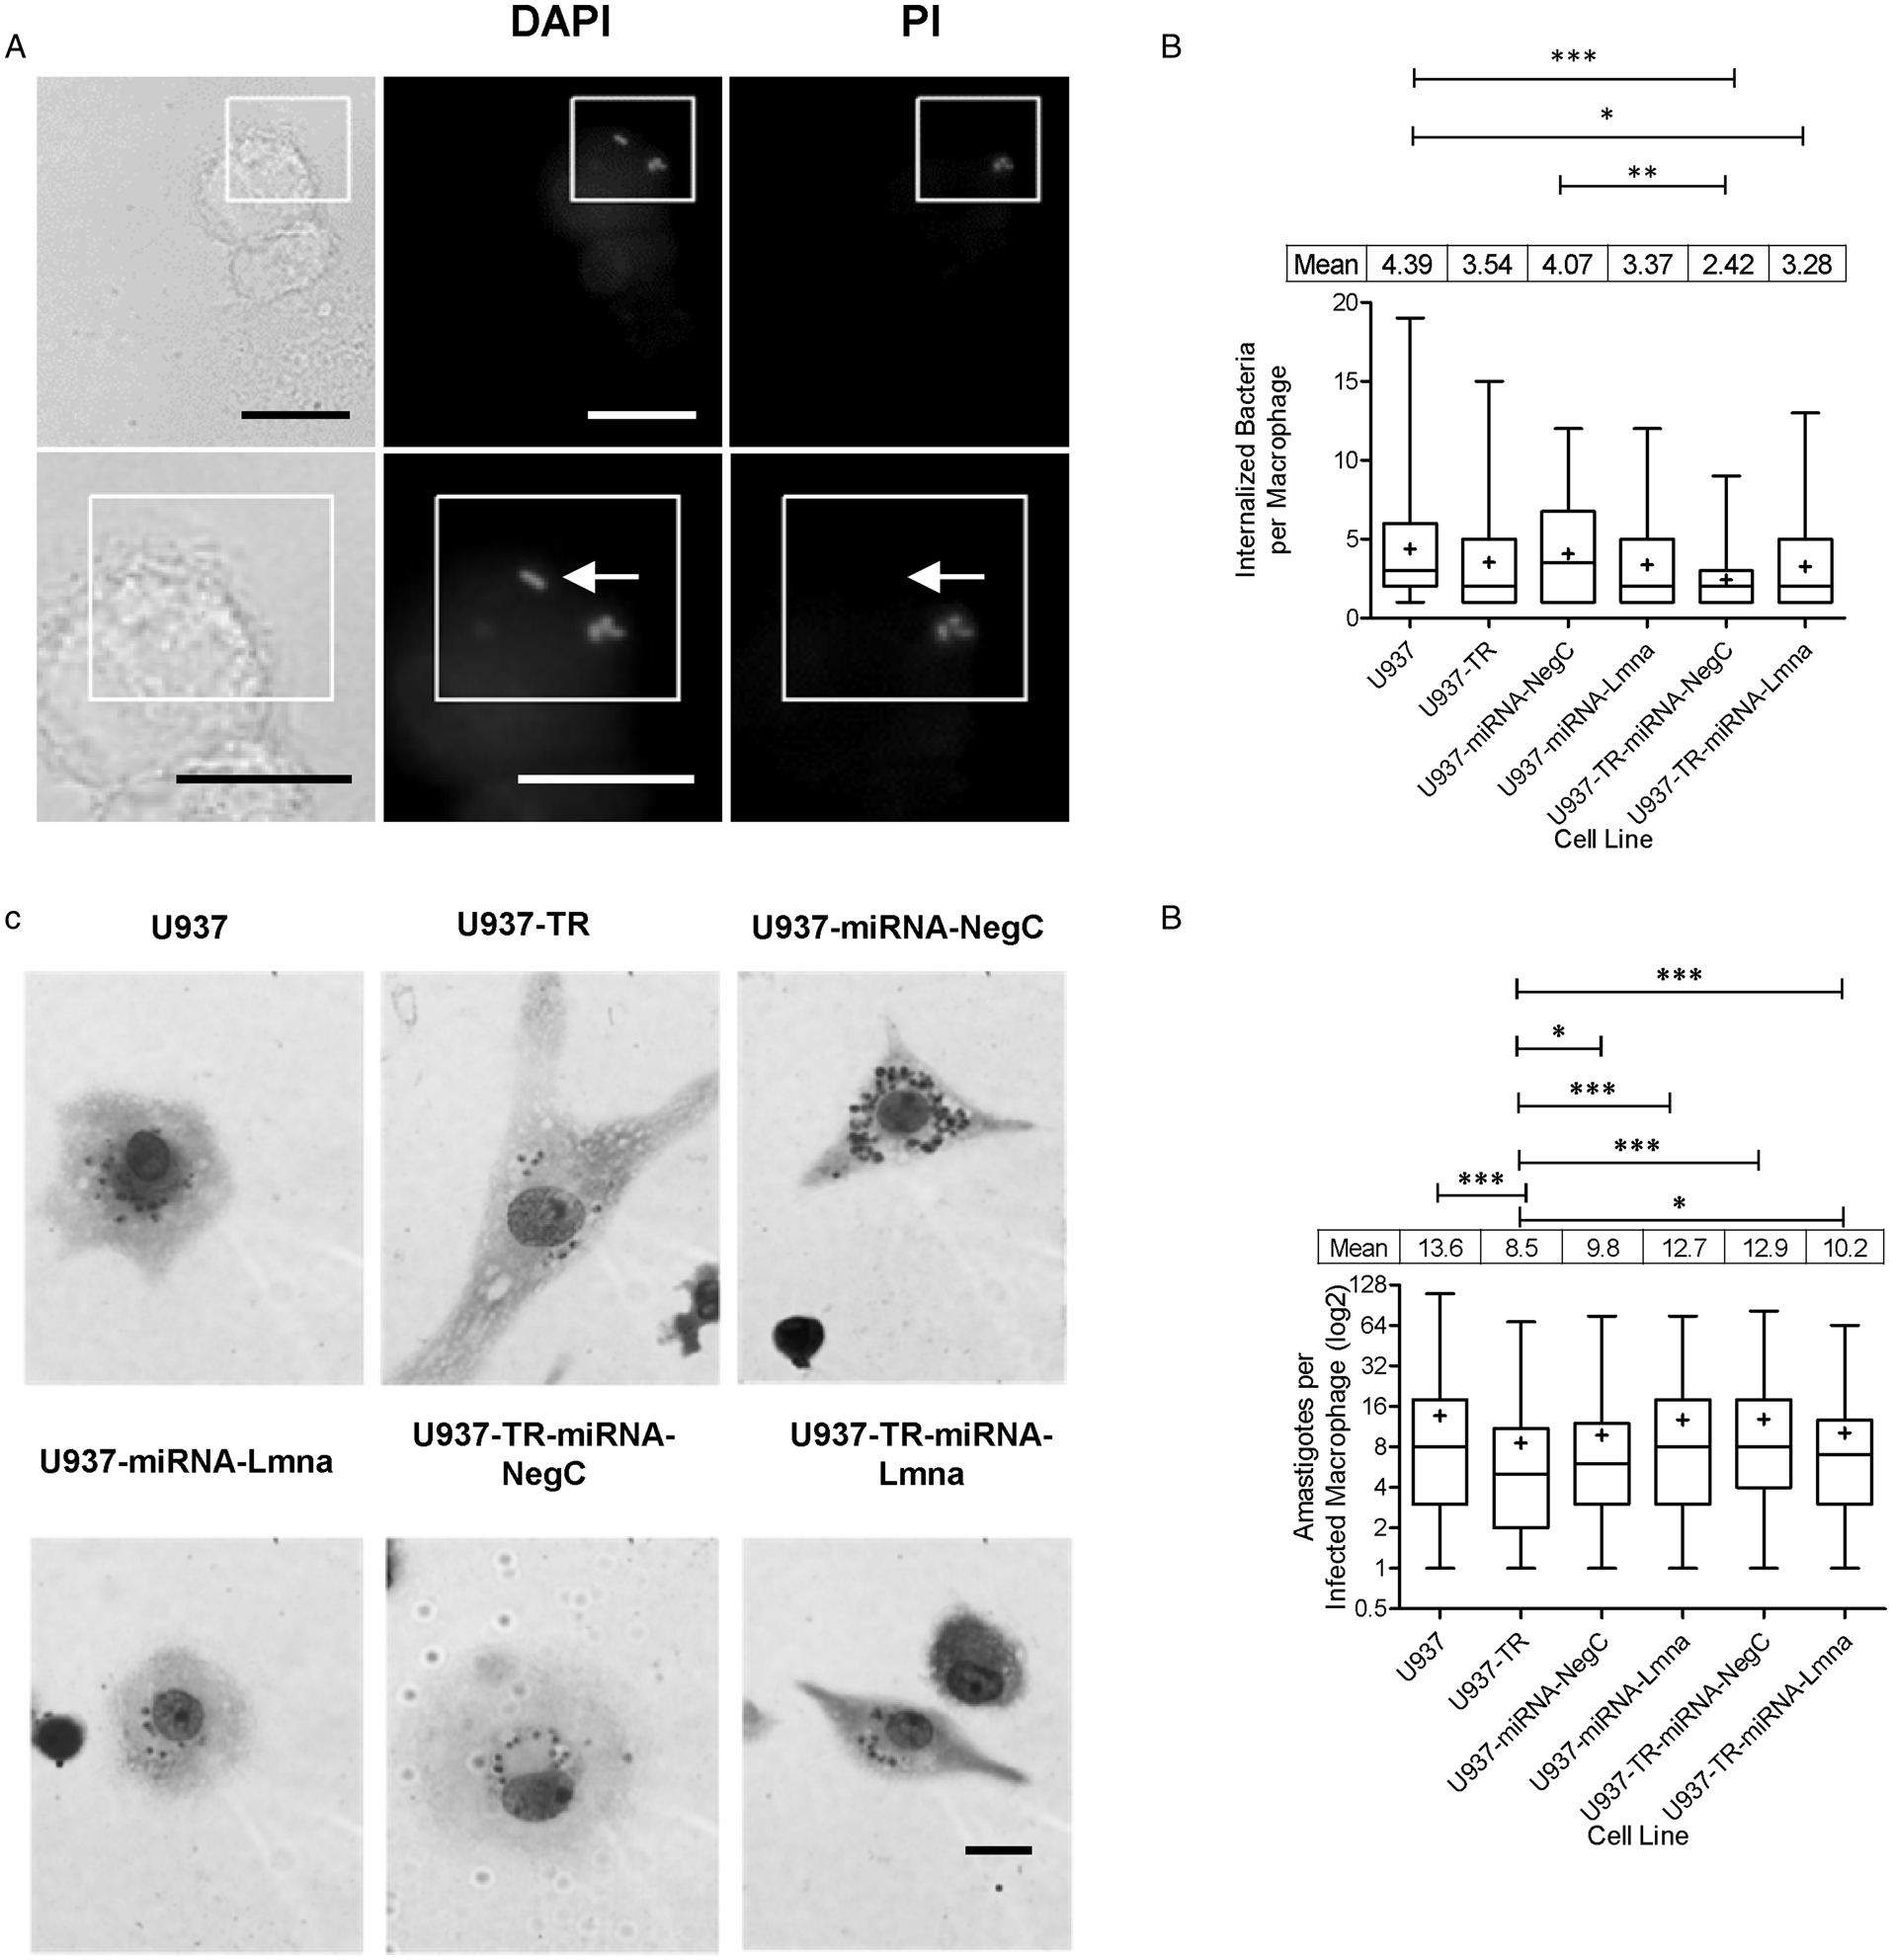
Many researchers use U937 cells as an in vitro model for Leishmania parasite infection. We tested the capacity of the U937-derived cell lines to serve as host to this parasite. Cells of each cell line were PMA-differentiated, then infected with Leishmania (Viannia) braziliensis promastigotes and harvested 72 h later. Approximately 60% of adherent cells of each cell line were infected by at least one parasite (Fig. 2C and Supplementary Fig. S4E and F). All the cell lines were able to support multiple infections per cell and/or proliferation of Leishmania parasites (Fig. 2D). Despite that there was not a statistically significant difference between cell lines in terms of percentage of infected cells with at least one amastigote (Supplementary Fig. S4F), we found that the U937-TR cell line has a reduced and statistically significant difference with the parental and every other derived cell line, in terms of the number of amastigotes per infected macrophage (Fig. 2D). This could be interpreted as a higher capacity of the U937-TR cell line to prevent Leishmania (Viannia) braziliensis parasites survival and or proliferation. We conclude that similar to U937 cells, the derived cell lines can function as an in vitro host of Leishmania (Viannia) braziliensis parasites, but with their particular basal levels of infection, which should be considered when using this model for the study of Leishmania and macrophage interactions.
Inducible gene silencing in macrophage-like cells derived from the U937-TR cell line
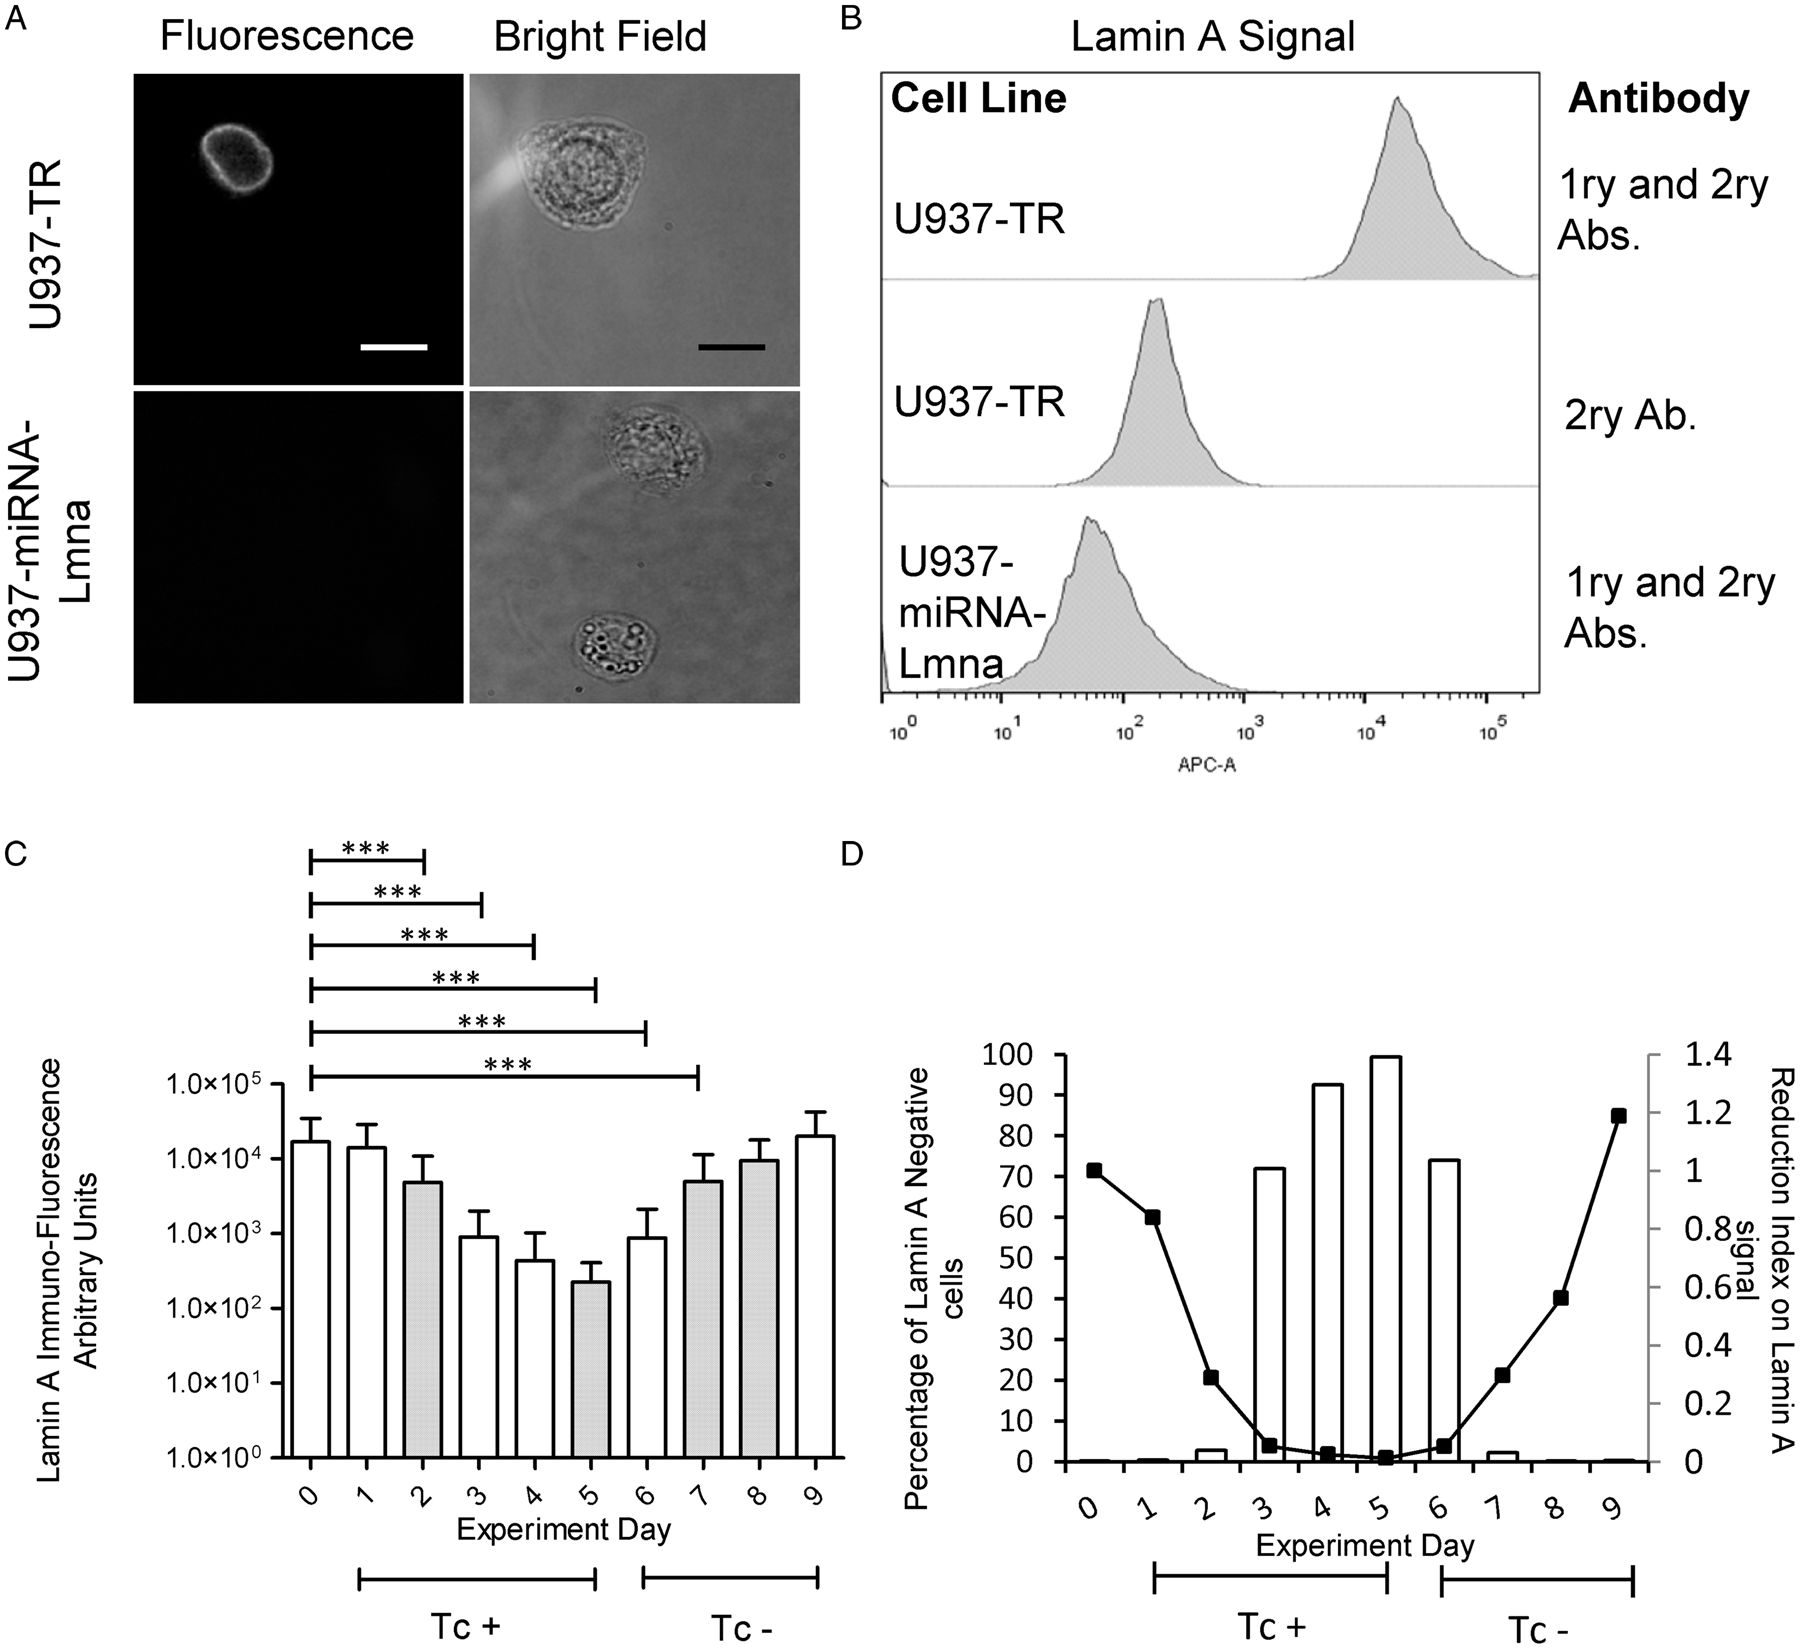
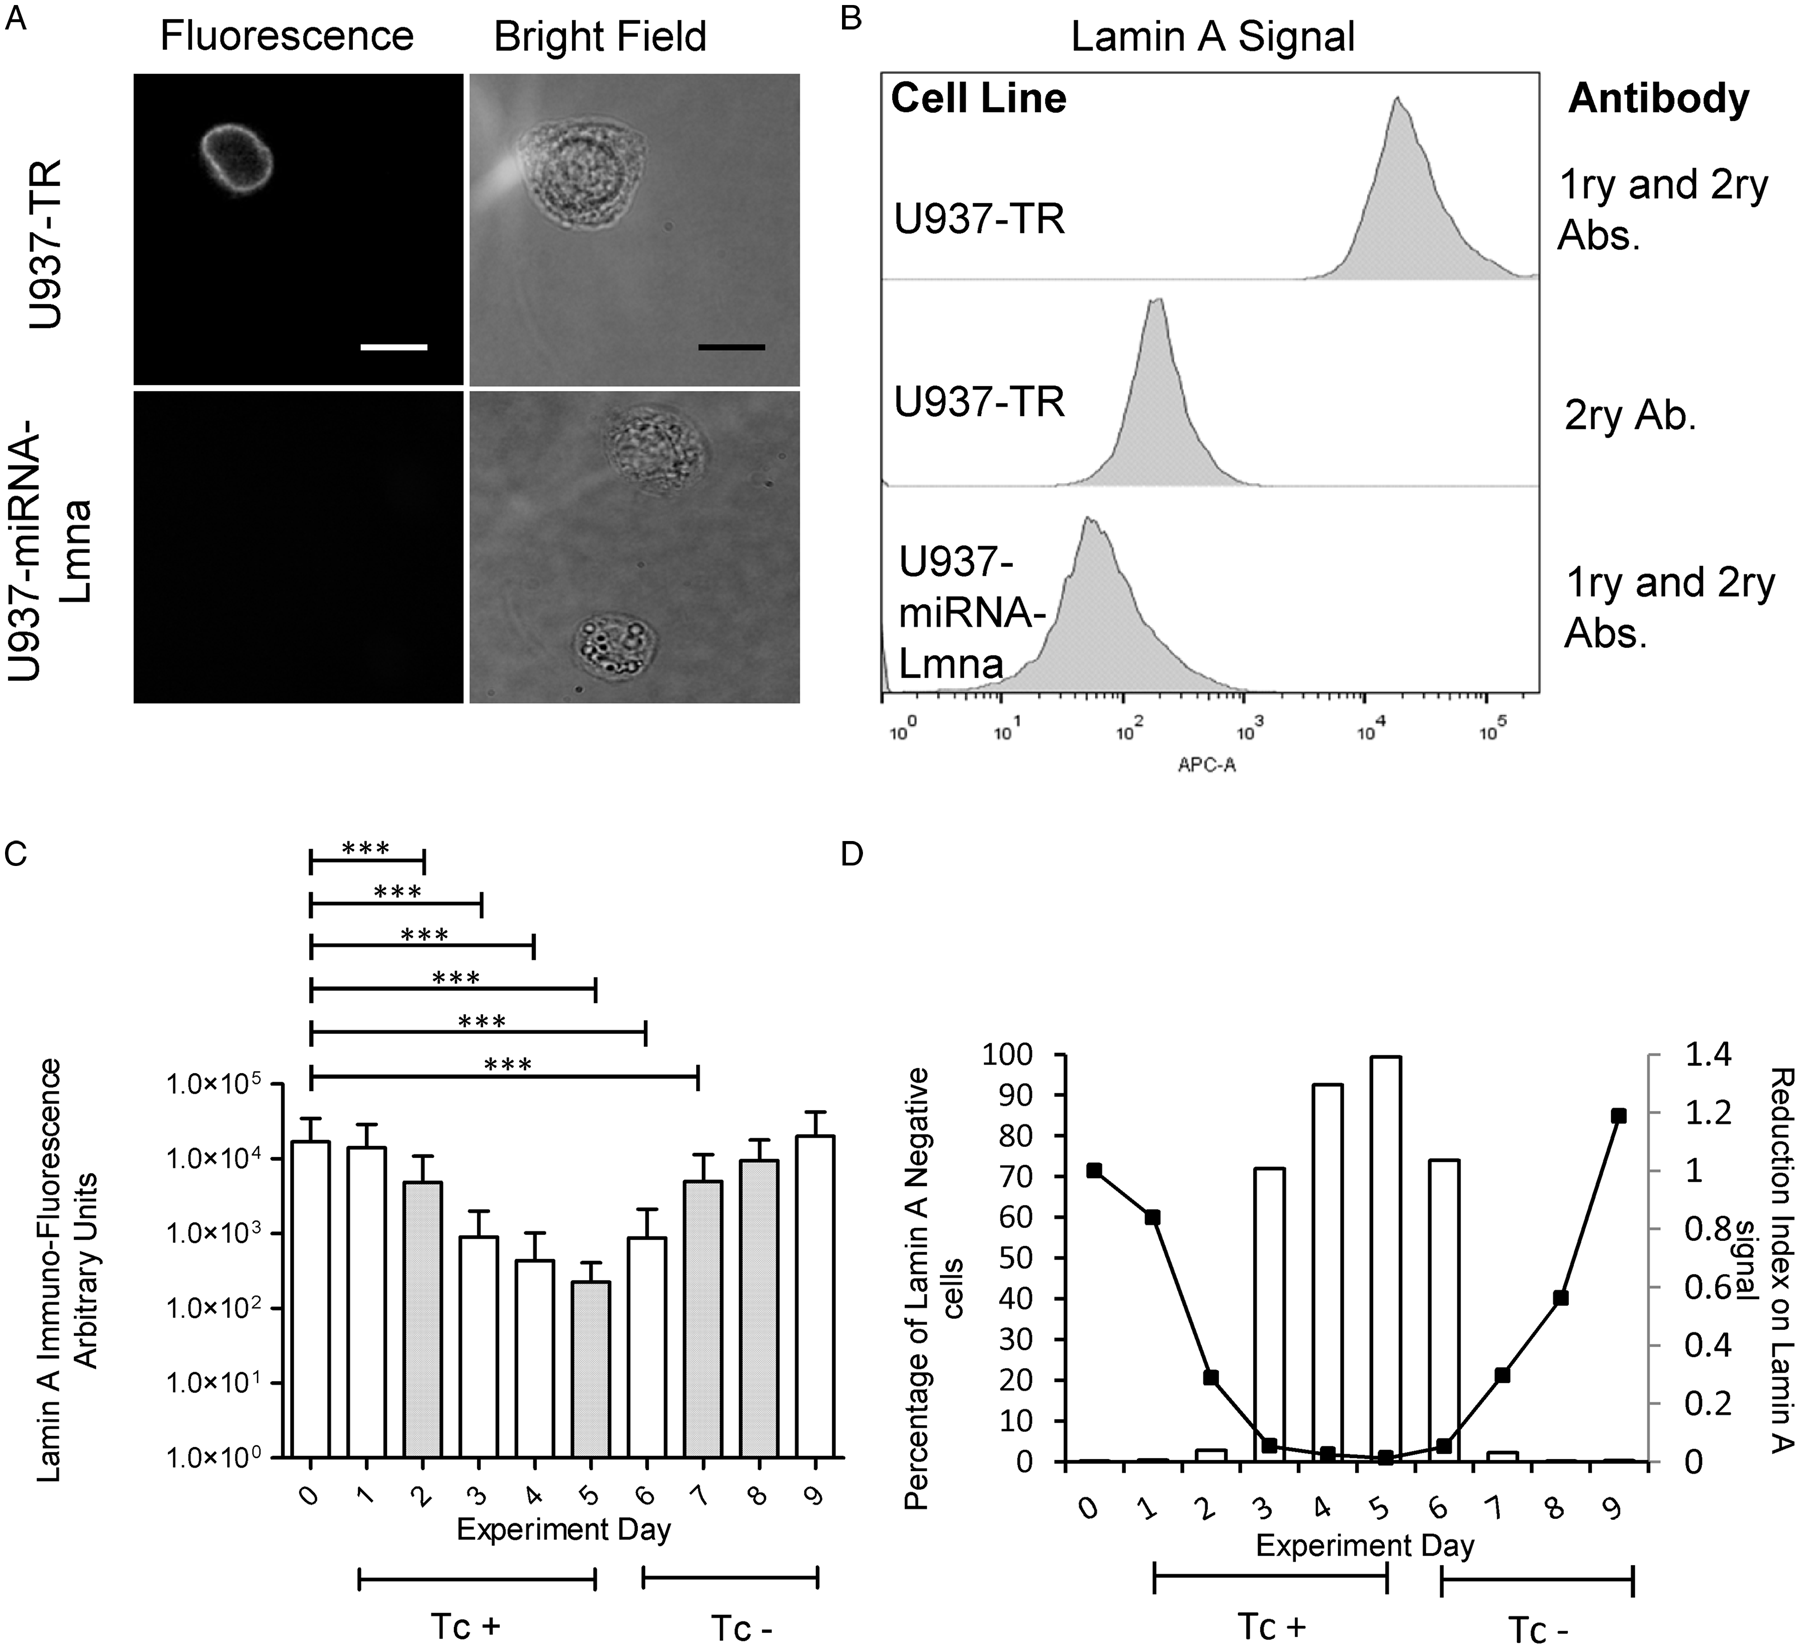
Since the ultimate aim of this work was to develop a U937-derived cell line with inducible control of gene expression, we initially tested the GFP reporter gene expression on U937-TR-miRNA-NegC and U937-TR-miRNA-Lmna. After 3 days of incubation with tetracycline, both differentiated U937-TR-miRNA-NegC and U937-TR-miRNA-Lmna expressed GFP (Supplementary Fig. S5). We then tested the ability of the miRNA expressed in U937-TR-miRNA-Lmna cells to silence the Lamin A gene. Constitutive expression of this miRNA silences Lamin A in U937-miRNA-Lmna cells as shown by immunocytochemistry (Fig. 3A) and by flow cytometry (Fig. 3B). We used flow cytometry to carry out a quantitative measurement of Lamin A expression, or lack thereof, during treatment with tetracycline of U937-TR-miRNA-Lmna cells. After 5 days of treatment, Lamin A immuno-detectable signal diminished from a median of 11 560 to 189 Arbitrary Fluorescence Units (AFUs, Fig. 3C). As expected, Lamin A expression was restored after tetracycline removal, reaching approximately the original levels 4 days later. An arbitrary threshold of 1000 AFUs was used to determine the percentage of cells negative for Lamin A signal through the experiments shown in Fig. 3C. The maximal percentage of cells negative for Lamin A was reached by day 5 of tetracycline treatment (99.4%) and fall to 2.3% 48 h after tetracycline removal (Fig. 3D left axis). The cycle of reduction and recovery was quantified also as an index normalized to the mean of Lamin A signal at day zero. The lowest reduction index value (0.01) was reached by day 5 of tetracycline treatment and recovered to a value of 1.2, 4 days after tetracycline removal (Fig. 3D right axis). We conclude that in the U937-TR-miRNA-Lmna cells, tetracycline can effectively and reversibly silence Lamin A gene expression. These results demonstrate that the U937-TR cell line can work as a platform to generate derived cells with controlled gene expression.
Inducible and reversible Lmna gene silencing in U937-TR-miRNA-Lmna cell line. U937-TR, U937-miRNA-Lmna and U937-TR-miRNA-Lmna were differentiated by PMA treatment and processed for flow cytometry analysis. Representative images of processed cells show a positive signal for Lamin A immunodetection in U937-TR cells [(A) top panel] but are not detectable in U937-miRNA-Lmna cells [(A) bottom panel]. Left images show fluorescence microscope red channel and right images the corresponding bright field (scale bar = 20 μm). Notice that different focal planes for bright field and fluorescence signal were necessary for optimal image acquisition. (B–D) Flow cytometry analyses were performed in a FACS Aria II Flow Cytometer (BD Biosciences, USA) using the FACSDiva TM Software (BD Biosciences, USA). 10 000 to 20 000 events were acquired per experimental unit. As experimental controls, histograms of fluorescence signals for Lamin A are presented in (B) using the primary and secondary antibodies or only the secondary antibody. (C) PMA-differentiated U937-TR-miRNA-Lmna cells were treated with tetracycline 100 ng mL−1 for 5 days (days 0–5). At day 6, tetracycline was removed from the culture medium. Cells were harvested at the indicated days and Lamin A expression was assessed by flow cytometry analysis (n ranges from 20 000 to 10 000 events). Tc + : culture with tetracycline (days 0–5). Tc–: culture in the absence of tetracycline (days 6–9). Two independent but complementary experiments are showed (white and dotted bars). Kruskal–Wallis test was performed followed by Dunn's Multiple Comparison Test (***P < 0.01). Error bars represent standard deviation. (D) Percentage of Lamin A negative cells (bars) and reduction index on Lamin A signal (Lines) from mean values of experiments described in (C) normalized to day 0. See text for details.
Discussion
Since its original characterization by Sundström and Nilsson (Reference Sundström and Nilsson1976), the U937 cell line has been broadly used by researchers around the world to study a plethora of biological processes. Several researchers have used inducible gene expression systems to overexpress proteins in U937 cells (Boer et al., Reference Boer, Bonten-Surtel and Grosveld1998; Hakansson et al., Reference Hakansson, Lassen, Olofsson, Baldetorp, Karlsson, Gullberg and Fioretos2004; Kawagoe et al., Reference Kawagoe, Potter, Ellis and Grosveld2004). Recently, Wu et al. (Reference Wu, Zhao, Banaszak, Gutierrez-Rodrigues, Keyvanfar, Gao, Quinones Raffo, Kajigaya and Young2018) have successfully used the CRISPR/Cas9 system to produce a mutated version of the Asxl1 gene in U937 cells. However, we can find much fewer examples of tetracycline-inducible gene silencing in this cell line in the literature (Rahmani et al., Reference Rahmani, Aust, Attkisson, Williams, Ferreira-Gonzalez and Grant2013). Since gene silencing is a powerful tool to determine gene function, we aimed to create a U937-derived cell line with the constitutive expression of the TR and characterized the macrophages differentiated from such cells. To the extent of our knowledge, we are the first to report the characterization of this inducible system for the expression of particular miRNAs in macrophages obtained from U937-differentiated cells. Our intention is to share with the research community this tool so we can take advantage of it while recognizing its potential pitfalls. In this paper, we present our characterization of the U937-TR and related U937-derived cell lines.
Many of U937 cell line applications involve its ability to differentiate into a macrophage-like cell type (Song et al., Reference Song, Ryoo, Choi, Choi, Kim, Heo, Lee, Park and Kwak2015; Taniguchi et al., Reference Taniguchi, Hikiji, Okinaga, Hashidate-Yoshida, Shindou, Ariyoshi, Shimizu, Tominaga and Nishihara2015; Camilli et al., Reference Camilli, Cassotta, Battella, Palmieri, Santoni, Paladini, Fiorillo and Sorrentino2016; Gmiterek et al., Reference Gmiterek, Klopot, Wojtowicz, Trindade, Olczak and Olczak2016; Yang et al., Reference Yang, Dai, Tang, Le and Yao2017; Riddy et al., Reference Riddy, Goy, Delerive, Summers, Sexton and Langmead2018). For this reason, we assessed all the generated cell lines considering three aspects: (1) capacity of PMA-induced differentiation to a macrophage-like cell type; (2) capacity for phagocytosis; and (3) capacity to function as an in vitro Leishmania parasite host.
After PMA treatment, U937 cells endure significant changes in their morphology and their adhesion capacity to the substrate. We tested whether the genetic modifications associated with the generation of the derived cell lines would alter these phenotypic landmarks of PMA-induced differentiation. We found no significant difference between U937 and the derived cell lines in terms of adhesion capacity after PMA treatment (Fig. 1). We also characterized the expression patterns of two known macrophage markers: CD11b and CD68 in cells treated with PMA (Lishko et al., Reference Lishko, Yakubenko, Ugarova and Podolnikova2018; Mandel et al., Reference Mandel, Otte and Hass2012; Yang et al., Reference Yang, Dai, Tang, Le and Yao2017). PMA treatment on U937 cells in our experiments induced a very similar increase in CD11b expression as that reported previously (Mandel et al., Reference Mandel, Otte and Hass2012). All the studied cell lines here showed similar behaviour among them except for U937-miRNA-Lmna in which we only found a small shift of the population with increased levels of CD11b (Supplementary Fig. S3A). In our study, U937 cells increased CD68 expression upon PMA treatment. A small fraction of the macrophage population seemed refractory to this increase in CD68 expression in each cell line tested (Supplementary Fig. S3B). Such a refractory population was larger in the case of U937-TR compared both to U937 and the rest of the derived cell lines. Iqbal et al. observed a similar refractory subpopulation of macrophages in vivo with the splenic resident macrophages in mice, but not in other tissues (Iqbal et al., Reference Iqbal, McNeill, Kapellos, Regan-Komito, Norman, Burd, Smart, Machemer, Stylianou, McShane, Channon, Chawla and Greaves2014). This probably shows the intrinsic variability in response of monocytes in vivo and U937 cells in vitro, during the differentiation process from monocytes to macrophages.
After the morphological and marker characterization of U937-derived cell lines in response to PMA, we tested these cells' ability to function as phagocytes. After PMA-induced differentiation, we exposed the cells for 60 min, to pre-labelled (DAPI) heat-inactivated E. coli. To visualize non-internalized bacteria, we then stained for 5 min with PI. During this short time, PI will only stain bacteria that are outside the macrophages and therefore the differential staining (DAPI/PI) allowed us to quantify the number of internalized and not internalized bacteria per each macrophage (Fig. 2A). While we found no statistically significant difference in terms of non-internalized bacteria among the cell lines, the U937-TR-miRNA-NegC showed a significant reduction on the number of internalized bacteria per macrophage, when compared with the parental cell line (Fig. 2B and Supplementary Fig. S4D).
A range of host and pathogen responses have been characterized by U937 cells (Chatterjee et al., Reference Chatterjee, Das, Bose, Banerjee, Jha and Das Saha2015; Galluzzi et al., Reference Galluzzi, Diotallevi, De Santi, Ceccarelli, Vitale, Brandi and Magnani2016; Cianciulli et al., Reference Cianciulli, Porro, Calvello, Trotta and Panaro2018). They are used as a model for in vitro infection by parasites of the genus Leishmania. We evaluated U937-derived cell lines in terms of their capacity for in vitro infection by Leishmania (Viannia) braziliensis. While we found no statistically significant difference among the cell lines in terms of percentage of infected macrophages, the cell line U937-TR showed a significant reduction in terms of the number of amastigotes per macrophage after 72 h since infection (Fig. 2D). These combined results suggest that Leishmania (Viannia) braziliensis presented a reduced capacity to proliferate in the U937-TR cell line as compared with the parental U937 and the rest of derived cell lines.
Finally, we tested the property of inducible gene expression controlled by the TR in the U937-TR-miRNA-NegC and U937-TR-miRNA-Lmna cell lines. The genetic construct used to generate these cell lines encodes in a co-cistronic way the expression of a miRNA and of GFP as a reporter. We conducted two independent but complementary experiments in which we culture differentiated U937-TR-miRNA-Lmna cells with Tc for different times and after 5 days we removed Tc from the culture medium. Immuno-fluorescence signal of Lamin A decreased by 2 orders of magnitude (from a median of 11 560 to 189 AFUs) after 5 days of exposure to Tc. As expected, removal of Tc from the medium correlated with the recovery of Lamin A immuno-fluorescence signal 4 days later (Fig. 3C and D). To determine the percentage of Lamin A-negative cells, we used an arbitrary value of 1000 AFUs, which is the highest Lamin A signal obtained in the cell line with constitutive silencing of the gene (U937-miRNA-Lmna, see histogram in Fig. 3B). Any cell with a fluorescence Lamin A signal below 1000 AFUs was considered negative for the expression of the protein. Then we quantified the percentage of cells with Lamin A fluorescent signal below 1000 AFUs for each day in the experiments shown in Fig. 3C (Fig. 3D, left axis). The U937-TR-miRNA-Lmna cell line took 5 days of tetracycline treatment to reach 99.4% of negative cells for Lamin A. Two days after removal of tetracycline, only 2.3% of the cells were negative for Lamin A expression. To determine the index of Lamin A signal reduction, we normalized the mean value of AFUs of the cell population for each day of treatment, with respect to that on day zero (Fig. 3D, right axis). After 3 days of tetracycline treatment, the reduction index reached a value of 0.05 and two more days to reach a value of 0.01. The reduction index returned to its original value 4 days after tetracycline removal. The use of cell cytometry to detect the levels of protein expression allowed us to determine with precision the timing of gene silencing of our inducible system. This technique also revealed the existence of outliers in the cell population under inducible gene silencing. Even though the proportion of such outliers is low (0.3–0.4% of the cell population at days 0 and 9, respectively), it is important to recognize their presence in any assay that could use this cell model. Altogether, these results demonstrate the feasibility of controlled gene expression of a cell line derived from U937-TR. As such, this cell line could be a valuable tool for the functional analysis of genes that represent a challenge for knock out or permanent silencing. To the extent of our knowledge, we are the first to report the characterization of this inducible system for the expression of particular miRNAs in macrophages obtained from U937-differentiated cells.
The phenotypic characteristics of the different cell lines studied here suggest that after the genetic modifications necessary to obtain them, each cell line reaches a new baseline sometimes very similar to that of the parental cell line, but others different enough as to consider it as a new population that needs characterization. One advantage of a cell line with inducible gene expression is that the same line in its steady state can be used as the negative control for that gene, reducing the possibility of non-specific effects related with the process of population selection.
Through collaboration and sharing of the biological tools characterized is this work, we hope to help the scientific community advance the understanding of many processes regarding the cell biology of monocytes and macrophages. Despite its advantages, we should be careful while using this model, as others have shown that TR can by itself modify gene expression in U937 cells (Hackl et al., Reference Hackl, Rommer, Konrad, Nassimbeni and Wieser2010).
The U937-TR cell line generated and characterized in this work can be used as a tool to study processes that require careful gene expression control. The cell line has its own functional characteristics that may differ from the parental U937 cell line, so the inducible gene expression system can be harnessed to compare scenarios in which the gene(s) of interest is (are) switched on or off. We expect that as the parental cell line, the U937-TR will be used as a platform to generate derived cell lines for the study of processes as diverse as: inflammation, host–pathogen interaction (with bacteria, parasites and virus), monocyte and macrophage cell biology.
Supplementary material
The supplementary material for this article can be found at https://doi.org/10.1017/S0031182020001110
Acknowledgements
We thank the Departamento de Salud Pública, Laboratorio de Parasitología and Laboratorio de Equipos Comunes, Facultad de Medicina, Universidad Nacional de Colombia – Sede Bogotá, for allowing us to use their facilities.
Financial support
This work was supported by Universidad Nacional de Colombia – Sede Bogotá, Dirección de Investigación (HERMES Grant numbers: 23538, 2015; 12512, 2011; 11232, 2010; 8584, 2009).
Author's contributions
CG carried out the lab work, designed experiments, performed data analysis and drafted the manuscript. CC conceived, designed and coordinated the study; and performed data analysis, drafted and completed the manuscript. All the authors gave final approval of the manuscript for publication.
Conflict of interest
None.
Ethical standards
Not applicable.