1. Introduction
The advection of particles by a fluid flow plays an important role in a large number of natural and industrial situations; a few examples are cloud microphysics, combustion processes and formation of marine aggregates or planets. The underlying flow is turbulent in many cases. When the inertia of the particles is small enough they can be accurately modelled as tracers, i.e. particles that follow the fluid flow exactly. When this is not the case the particles can deviate from the flow due to their inertia and one then speaks of inertial particles. A fundamental difference between these two types of particles is that the dynamics of tracers preserves the phase space volume (when the flow is incompressible) whereas the dynamics of inertial particles is dissipative, thus allowing for the existence of attractors. As a direct consequence, inertial particles can accumulate in certain regions of the flow – an effect termed preferential concentration – while tracers stay homogeneously distributed for all times.
The equations of motion for a particle in a fluid flow can (under certain assumptions) be systematically derived from the Navier–Stokes equation, as has been done by Gatignol (Reference Gatignol1983) and Maxey & Riley (Reference Maxey and Riley1983) (see the references therein for a historical overview of the literature before 1983). These equations of motion comprise different terms, which makes it possible to decompose the total hydrodynamical force on the particle into different contributions like the Stokes drag, the added mass effect and the history force. The latter is an integral over the whole history of the particle’s motion – a memory effect. Boussinesq (Reference Boussinesq1885) and Basset (Reference Basset1888) were the first to point out the existence of the history force, which is therefore often called the Boussinesq–Basset force.
Before we proceed to the full equation, let us present an intuitive argument for the existence of the history force and try to guess its form. Consider a spherical particle moving through a still fluid with a constant velocity. If the Reynolds number is small, we can neglect the nonlinear convective term in the Navier–Stokes equation and the flow is then given by the Stokes flow around a sphere. Now imagine a sudden change
 $\text{d}\boldsymbol{v}_{0}$
in the velocity of the particle at time
 $t=0$
. This disturbance will lead to the generation of vorticity at the particle’s surface, which will decay diffusively, and thus its action on the particle as
 $1/\sqrt{t}$
. We might expect that the force on the particle due to this decaying part of the flow will be proportional to
 $\text{d}\boldsymbol{v}_{0}/\sqrt{t}$
. This is already a memory effect because the particle ‘remembers’ the disturbance at
 $t=0$
in all following instants. The particle obviously does not have a memory itself but rather the information is stored in the flow around it. Now imagine a general motion of the particle as a series of velocity jumps
 $\text{d}\boldsymbol{v}({\it\tau})$
. Then the superposition of the flows due to these disturbances will produce a force proportional to
 $$\begin{eqnarray}\int _{0}^{t}\frac{1}{\sqrt{t-{\it\tau}}}\,\text{d}\boldsymbol{v}({\it\tau})=\int _{0}^{t}\frac{1}{\sqrt{t-{\it\tau}}}\,\frac{\text{d}\boldsymbol{v}}{\text{d}{\it\tau}}\,\text{d}{\it\tau}\end{eqnarray}$$
(a superposition is admissible because of the small Reynolds number and thus the approximate linearity of the Navier–Stokes equation). Up to a constant prefactor (1.1) is the history force on a particle moving in a still fluid. It describes the effect of the decaying parts of the flow which were generated by the acceleration of the particle at previous instants (on the particle at the present instant).
In the case of a general fluid flow the motion of a spherical particle is described by the following equation:
 $$\begin{eqnarray}\frac{\text{d}\boldsymbol{v}}{\text{d}t}={\it\beta}\frac{\text{D}\boldsymbol{u}}{\text{D}t}-\frac{1}{{\it\tau}_{p}}\left(\boldsymbol{v}-\boldsymbol{u}\right)-\sqrt{\frac{3{\it\beta}}{{\it\tau}_{p}}}\frac{1}{\sqrt{{\rm\pi}}}\frac{\text{d}}{\text{d}t}\int _{0}^{t}\frac{\boldsymbol{v}-\boldsymbol{u}}{\sqrt{t-{\it\tau}}}\,\text{d}{\it\tau},\end{eqnarray}$$
where
 $\boldsymbol{v}\equiv \text{d}\boldsymbol{x}/\text{d}t$
,
 $\boldsymbol{u}=\boldsymbol{u}(\boldsymbol{x}(t),t)$
and
 $\text{D}\boldsymbol{u}/\text{D}t=\partial _{t}\boldsymbol{u}+\boldsymbol{u}\boldsymbol{\cdot }\boldsymbol{{\rm\nabla}}\boldsymbol{u}$
denote the particle velocity, the fluid velocity and the fluid acceleration at the position of the particle;
 $\boldsymbol{u}$
is the undisturbed flow, without the particle’s presence. There are two parameters in (1.2); the first is the density parameter
 $$\begin{eqnarray}{\it\beta}=\frac{3}{2{\it\varrho}+1},\end{eqnarray}$$
where
 ${\it\varrho}={\it\varrho}_{p}/{\it\varrho}_{f}$
is the particle’s density
 ${\it\varrho}_{p}$
normalized by that of the fluid
 ${\it\varrho}_{f}$
. When
 ${\it\varrho}>1$
the particle is heavier than the fluid and
 $0<{\it\beta}<1$
; when
 ${\it\varrho}<1$
it is lighter than the fluid and
 $1<{\it\beta}<3$
. The second parameter is the particle response time
 $$\begin{eqnarray}{\it\tau}_{p}=\frac{1}{3{\it\beta}}\frac{r^{2}}{{\it\nu}},\end{eqnarray}$$
where
 $r$
is the radius of the particle and
 ${\it\nu}$
is the kinematic viscosity of the fluid. The terms appearing on the right-hand side of (1.2) are the pressure term (which is combination of what is typically called the pressure gradient and a contribution from the added mass term), the Stokes drag and the history force. The latter is an integral over the whole history of the particle and describes the effect of the decaying disturbance flow generated by the particle at earlier times on the particle at the present time, in harmony with the intuitive argument described above. The history force is a viscous effect and is sometimes referred to as the unsteady drag. We have omitted in (1.2) the so-called Faxén corrections and the influence of gravity.
The equation of motion (1.2) is the version derived by Gatignol (Reference Gatignol1983) and Maxey & Riley (Reference Maxey and Riley1983) with a slightly different (and widely used) form of the added mass term by Auton, Hunt & Prud’Homme (Reference Auton, Hunt and Prud’Homme1988) and a non-standard form of the history force. It is non-standard because the derivative is outside the integral. This form is actually more general as it is valid for initial conditions with
 $\boldsymbol{v}(0)\neq \boldsymbol{u}(0)$
. The following relation (derived via partial integration) shows the connection between the generalized form and the standard form (i.e. with the derivative inside the integral):
 $$\begin{eqnarray}\displaystyle \frac{\text{d}}{\text{d}t}\int _{0}^{t}\frac{\boldsymbol{v}-\boldsymbol{u}}{\sqrt{t-{\it\tau}}}\,\text{d}{\it\tau}=\int _{0}^{t}\frac{\displaystyle \frac{\text{d}}{\text{d}{\it\tau}}\left(\boldsymbol{v}-\boldsymbol{u}\right)}{\sqrt{t-{\it\tau}}}\,\text{d}{\it\tau}+\frac{\boldsymbol{v}(0)-\boldsymbol{u}(0)}{\sqrt{t}}=\sqrt{{\rm\pi}}\left(\frac{\text{d}}{\text{d}t}\right)^{1/2}\left(\boldsymbol{v}-\boldsymbol{u}\right).\end{eqnarray}$$
The term
 $(\boldsymbol{v}(0)-\boldsymbol{u}(0))/\sqrt{t}$
should be added to the standard form when
 $\boldsymbol{v}(0)\neq \boldsymbol{u}(0)$
, as pointed out by Michaelides (Reference Michaelides1992) and Maxey (Reference Maxey1993). Thus, the left-hand side of (1.5) is a form of the history force that is valid for any type of initial condition. This generalized form is also exactly the definition of the fractional derivative of Riemann–Liouville type of order 1/2 (see, e.g., Podlubny Reference Podlubny1998). This connection to fractional derivatives and relation (1.5) was first pointed out by Tatom (Reference Tatom1988). We will use the fractional derivative notation to abbreviate the history force in the following.
The history force has been frequently neglected in applications of the equation of motion (1.2). This is often done to simplify the problem: the history force turns the equation of motion into an integro-differential equation and thus makes it much more difficult to reason about the solutions. For example, the existence, uniqueness, regularity and asymptotics of the solutions of (1.2) have been only recently studied by Farazmand & Haller (Reference Farazmand and Haller2015) and Langlois, Farazmand & Haller (Reference Langlois, Farazmand and Haller2015). Another difficulty is the computation of numerical solutions with the history force: on the one hand there is the singularity of the integrand of the history force which impedes an accurate numerical approximation and on the other hand there is the necessity to recompute the history integral for every new time step which causes high computational costs. The first problem can be resolved by an appropriate treatment of the history force and, by now, higher-order integration schemes are available (Daitche Reference Daitche2013). The second problem is inherent to the dynamics with memory and can be attenuated only by an approximation of the history kernel (see, e.g., van Hinsberg, ten Thije Boonkkamp & Clercx Reference van Hinsberg, ten Thije Boonkkamp and Clercx2011).
The effect of the history force in non-chaotic flows has been studied analytically by Druzhinin & Ostrovsky (Reference Druzhinin and Ostrovsky1994), Coimbra & Rangel (Reference Coimbra and Rangel1998), Candelier, Angilella & Souhar (Reference Candelier, Angilella and Souhar2004), Hill (Reference Hill2005), Candelier, Mehaddi & Vauquelin (Reference Candelier, Mehaddi and Vauquelin2014) and Lim, Kobayashi & Coimbra (Reference Lim, Kobayashi and Coimbra2014) and experimentally by Mordant & Pinton (Reference Mordant and Pinton2000), Abbad & Souhar (Reference Abbad and Souhar2004), Coimbra et al. (Reference Coimbra, L’Esperance, Lambert, Trolinger and Rangel2004), Toegel, Luther & Lohse (Reference Toegel, Luther and Lohse2006) and Garbin et al. (Reference Garbin, Dollet, Overvelde, Cojoc, Di Fabrizio, van Wijngaarden, Prosperetti, de Jong, Lohse and Versluis2009). It was shown that memory can be quite important. For example, Candelier et al. (Reference Candelier, Angilella and Souhar2004) and Hill (Reference Hill2005) solved (1.2) for a particle in a vortex (in two and three dimensions respectively) and showed that the history force cannot be neglected. Another interesting example is the experimental study of microbubbles by Toegel et al. (Reference Toegel, Luther and Lohse2006) and Garbin et al. (Reference Garbin, Dollet, Overvelde, Cojoc, Di Fabrizio, van Wijngaarden, Prosperetti, de Jong, Lohse and Versluis2009) where the history force was found to be necessary for a match between experiment and theory. Chaotic dynamics of inertial particles has been studied by Yannacopoulos, Rowlands & King (Reference Yannacopoulos, Rowlands and King1997), Daitche & Tél (Reference Daitche and Tél2011), Guseva, Feudel & Tél (Reference Guseva, Feudel and Tél2013) and Daitche & Tél (Reference Daitche and Tél2014), showing that the history force can qualitatively change the dynamics; for example, the history force reduces the tendency for accumulation and can change the nature of attractors from non-chaotic to chaotic and vice versa. Reeks & McKee (Reference Reeks and McKee1984), Mei, Adrian & Hanratty (Reference Mei, Adrian and Hanratty1991) and van Aartrijk & Clercx (Reference van Aartrijk and Clercx2010) have shown that memory can affect the dispersion of particles in turbulence. Calzavarini et al. (Reference Calzavarini, Volk, Lévêque, Pinton and Toschi2012) studied the influence of Faxén corrections, nonlinear drag and history force on the statistical properties of large neutrally buoyant particles (
 $r/{\it\eta}\in [3,30]$
, where
 ${\it\eta}$
is the Kolmogorov length scale) moving in a turbulent flow and found a significant influence of all three terms (especially for particles considerably larger than
 ${\it\eta}$
). The importance of different forces acting on a particle in turbulence has been studied by Armenio & Fiorotto (Reference Armenio and Fiorotto2001) and Olivieri et al. (Reference Olivieri, Picano, Sardina, Iudicone and Brandt2014), showing that the magnitude of the history force can be significant and that it can also alter the contribution of the other forces. Olivieri et al. (Reference Olivieri, Picano, Sardina, Iudicone and Brandt2014) also found that memory can reduce preferential concentration. We will present a detailed comparison with the results by Olivieri et al. (Reference Olivieri, Picano, Sardina, Iudicone and Brandt2014) in § 8, where we find a considerable difference from our results.
One of the conditions for the derivation of (1.2) is that the particle Reynolds number
 $Re_{p}=r|\boldsymbol{v}-\boldsymbol{u}|/{\it\nu}$
is small. Lovalenti & Brady (Reference Lovalenti and Brady1993) and Mei (Reference Mei1994) have developed extended versions of (1.2) for finite
 $Re_{p}$
(up to a few hundreds by Mei (Reference Mei1994)). Both versions contain significantly more complicated forms of the history force; Mei’s version also includes a nonlinear form of the drag. Maxey, Chang & Wang (Reference Maxey, Chang and Wang1996) found that at
 $Re_{p}=17$
the standard form (1.2) ‘may be quite adequate in practice even though not justified by theory’. Bergougnoux et al. (Reference Bergougnoux, Bouchet, Lopez and Guazzelli2014) found in an experimental study that at
 $Re_{p}=5.2$
a nonlinear form of the drag was necessary to match their measurements with theory. On the other hand, L’Espérance et al. (Reference L’Espérance, Coimbra, Trolinger and Rangel2005) studied particle Reynolds numbers up to 5 and found the experiments to match the theoretical prediction of the standard form (1.2). Moreover, the experimental studies by Abbad & Souhar (Reference Abbad and Souhar2004) and Weinstein, Kassoy & Bell (Reference Weinstein, Kassoy and Bell2008) considered particle Reynolds numbers of up to 0.5 and 2.5 respectively, and found the standard form of the history force to be sufficient (these two studies used nonlinear forms of the drag). In our simulations the typical
 $Re_{p}$
is smaller than or of the order of unity (except for
 ${\it\varrho}=0$
and
 $r/{\it\eta}\geqslant 3$
, when it becomes larger than 3). We thus assume that the standard version (1.2) is applicable in our case. In a comparison of the magnitudes of the Faxén corrections and the history force we found that the former are much smaller in most cases considered here, see appendix A. Thus we neglect the Faxén corrections in the following.
A force not present in the original derivation of (1.2) is the lift force. It was shown that it can be important in several cases, see, e.g., Coimbra & Kobayashi (Reference Coimbra and Kobayashi2002) and Candelier (Reference Candelier2008), but there are also cases where it is negligible, see, e.g., Hill (Reference Hill2005). An analytical expression for this force is not known in general and different forms are used in the literature. Our aim here is to concentrate on the effects of the history force and we therefore neglect the lift force for the sake of simplicity. For studies of the lift force in turbulence we refer the reader to Wang et al. (Reference Wang, Squires, Chen and McLaughlin1997), Mazzitelli, Lohse & Toschi (Reference Mazzitelli, Lohse and Toschi2003) and van Aartrijk & Clercx (Reference van Aartrijk and Clercx2009).
In turbulence the relevant time scale with which the particle response time
 ${\it\tau}_{p}$
should be compared is the Kolmogorov time
 ${\it\tau}_{{\it\eta}}=\sqrt{{\it\nu}/{\it\epsilon}}$
, where
 ${\it\epsilon}$
is the mean energy dissipation. The Stokes number
 $$\begin{eqnarray}St=\frac{{\it\tau}_{p}}{{\it\tau}_{{\it\eta}}}\end{eqnarray}$$
is the ratio of these two characteristic time scales and is a measure of the importance of the particle’s inertia. The non-dimensional form of (1.2) can be obtained by replacing
 ${\it\tau}_{p}$
with
 $St$
and assuming all the other quantities to be dimensionless. Throughout the paper we will use the Kolmogorov scales of turbulence
 ${\it\eta}=\left({\it\nu}^{3}/{\it\epsilon}\right)^{1/4}$
(length),
 ${\it\tau}_{{\it\eta}}$
(time),
 $u_{{\it\eta}}={\it\eta}/{\it\tau}_{{\it\eta}}$
(velocity) and
 $a_{{\it\eta}}=u_{{\it\eta}}/{\it\tau}_{{\it\eta}}$
(acceleration) to normalize dimensional quantities. These scales are the smallest scales of the turbulent motion and are thus relevant for small particles, which ‘live’ on the smallest scales; e.g. for the particles considered here
 ${\it\tau}_{p}/{\it\tau}_{{\it\eta}}$
and
 $r/{\it\eta}$
are at most of the order of a few times unity.
The aim of the present paper is to provide a comprehensive study of the role of the history force for the motion of particles in a turbulent flow. To this end we prepared numerical simulations for a wide range of particle parameters, which will be investigated for effects of memory on different statistical particle properties. An important question we want to answer here is for which particle parameters the effects of memory are important.
The paper is structured as follows. The next section will present details on the numerical simulations. The magnitude of the history force will be studied in § 3, followed by investigations of its effect on the slip velocity
 $\boldsymbol{v}-\boldsymbol{u}$
(§ 4), the acceleration (§ 5), preferential concentration (§ 6) and collision rates (§ 7). Section 8 will detail a comparison with the recent work by Olivieri et al. (Reference Olivieri, Picano, Sardina, Iudicone and Brandt2014), followed by a summary and discussion in § 9. Appendix A presents a comparison of the history force and the Faxén corrections. A note on the case of neutrally buoyant particles, which is not considered in the main part of text, is given in appendix B. The numerical scheme for the integration of particle trajectories with the history force and the method of forcing the turbulence are described in appendices C and D respectively.
Parameters of the simulated turbulent flow: Taylor Reynolds number
 $Re_{{\it\lambda}}={\it\lambda}u_{rms}/{\it\nu}$
, size of the periodic box
 $L_{box}$
, integral scale
 $L=u_{rms}^{3}/{\it\epsilon}$
, Taylor microscale
 ${\it\lambda}=u_{rms}\sqrt{15{\it\nu}/{\it\epsilon}}$
, size of a grid cell
 ${\rm\Delta}x$
, length of the whole simulation
 $T_{sim}$
, large-eddy turnover time
 $T=L/u_{rms}$
, time step
 ${\rm\Delta}t$
, root-mean-square (r.m.s.) of the velocity
 $u_{rms}=\sqrt{\langle \boldsymbol{u}^{2}\rangle /3}$
, number of grid points
 $N^{3}$
. All dimensional quantities are given in multiples of the corresponding Kolmogorov scales.

2. Numerical simulations
The turbulent flow is generated in a triply periodic box by a large-scale forcing (as described in appendix D). We solve the vorticity equation, which is equivalent to the incompressible Naiver–Stokes equation, by a standard dealiased Fourier pseudospectral method (Canuto et al. Reference Canuto, Hussaini, Quarteroni and Zang1987; Hou & Li Reference Hou and Li2007) with a third-order Runge–Kutta time-stepping scheme (Shu & Osher Reference Shu and Osher1988). The particle trajectories are integrated with a specialized scheme which treats the history force appropriately; it is a modified version of the third-order scheme developed by Daitche (Reference Daitche2013) and is described in appendix C. The values of Eulerian quantities, which are present on a grid, are obtained at the particle positions through tricubic interpolation. The turbulent flow is statistically homogeneous, isotropic and stationary, with the flow characteristics depicted in table 1.
For this study a number of simulations with different particle parameters have been prepared. For the density ratio
 ${\it\varrho}$
the values 1000, 100, 10, 2, 0.5, 0 were chosen. The density ratio 1000 corresponds to water droplets moving in air, relevant for, e.g., cloud microphysics. The density ratios 10 and 2 are close to those of metals and sand in water. The density ratio 1 is the case of neutrally buoyant particles, which is not discussed in the main text but in appendix B. The density ratio 0 corresponds to air bubbles in water. The Stokes number has been varied in the range
 $[0.1,3.0]$
. It is typically in this range where interesting properties of inertial particles appear. Moreover, this range is constrained from above by the limitations of (1.2) (the particle Reynolds number grows with
 $St$
) and from below by the time step of the simulation (it should be significantly smaller than
 ${\it\tau}_{p}$
). For every combination of the values of
 ${\it\varrho}$
and
 $St$
a simulation of particles with and without the history force has been prepared. The number of simulated particles for every parameter combination is
 $N_{p}=10^{5}$
, except for the investigations in §§ 6 and 7 where
 $N_{p}=5\times 10^{5}$
(in this case the length of the simulations is
 $T_{sim}=700{\it\tau}_{{\it\eta}}=24T$
). The initial particle positions have been chosen randomly and homogeneously distributed in space; the initial particle velocity is that of the fluid at the particle’s position. Statistical quantities (e.g. averages) have been obtained by sampling over the particle ensemble and over time. To ensure that the particles have equilibrated with the flow, this sampling is started after an initial period of five large-eddy turnover times (in all cases the autocorrelation function of the particle velocity has decayed below
 $10^{-3}$
after
 $5T$
).
3. Forces
We start by comparing the magnitudes of the different forces acting on a particle. In the following, the moduli of the particle acceleration and of the three terms on the right-hand side of (1.2) will be denoted by
 $a$
,
 $a_{P}$
(pressure term),
 $a_{S}$
(Stokes drag) and
 $a_{H}$
(history force) respectively.
Probability density functions of the total acceleration
 $a$
and the different contributions
 $a_{i}$
due to the pressure term (
 $i=P$
), the Stokes drag (
 $i=S$
) and the history force (
 $i=H$
). The particle parameters are (a)
 ${\it\varrho}=2$
,
 $St=0.5$
(
 $r/{\it\eta}=0.95$
) and (b)
 ${\it\varrho}=0$
,
 $St=0.5$
(
 $r/{\it\eta}=2.1$
). The vertical lines show the positions of the averages:
 $\langle a_{P}\rangle /\langle a\rangle =0.62$
,
 $\langle a_{S}\rangle /\langle a\rangle =0.25$
,
 $\langle a_{H}\rangle /\langle a\rangle =0.17$
in (a) and
 $\langle a_{P}\rangle /\langle a\rangle =2.4$
,
 $\langle a_{S}\rangle /\langle a\rangle =0.62$
,
 $\langle a_{H}\rangle /\langle a\rangle =0.93$
in (b).

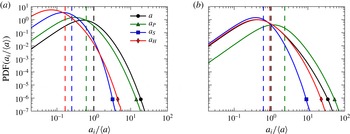
Figure 1(a,b) shows the probability density functions (PDFs) of
 $a_{P}$
,
 $a_{S}$
and
 $a_{H}$
for particles heavier (
 ${\it\varrho}=2$
) and lighter (
 ${\it\varrho}=0$
) than the fluid. In both cases
 $a_{P}$
is the dominant contribution, followed by
 $a_{S}$
and
 $a_{H}$
. The Stokes drag and the history force are of similar magnitude, showing that the history force is a viscous effect that can be as important as the drag. In these particular cases we find
 $\langle a_{H}\rangle /\langle a_{S}\rangle =66\,\%$
in figure 1(a) and
 $\langle a_{H}\rangle /\langle a_{S}\rangle =150\,\%$
in figure 1(b). Additionally, the PDF of the history force has a longer tail than that of the Stokes drag (see figure 1
a and also note that the
 $x$
-axis is logarithmic), i.e. the history force has more extreme events.
Let us now consider the relative importance of the history force and compare it with the Stokes drag by means of the ratio
 $a_{H}/a_{S}$
. We choose to compare the history force with the Stokes drag because both forces represent viscous effects and because the Stokes drag is important in all cases (in contrast to the pressure term). Before proceeding to the numerical simulations, let us try to obtain an estimate of this ratio. To this end we apply the approximation
 $$\begin{eqnarray}\left(\frac{\text{d}}{\text{d}t}\right)^{1/2}\left(\boldsymbol{v}-\boldsymbol{u}\right)\approx \frac{{\it\alpha}}{\sqrt{{\it\tau}_{{\it\eta}}}}\left(\boldsymbol{v}-\boldsymbol{u}\right),\end{eqnarray}$$
which is motivated by the fact that the history force is a (fractional) time derivative. The choice of
 ${\it\tau}_{{\it\eta}}$
as the characteristic time scale of
 $\boldsymbol{v}-\boldsymbol{u}$
seems natural as the particle ‘lives’ on the small scales and should follow the flow to some degree (except for very large
 $St$
). The constant
 ${\it\alpha}$
is expected to be of the order of unity. With this approximation and the definition of
 $a_{H}$
and
 $a_{S}$
we obtain an estimate for the relative magnitude of the history force (see also Daitche & Tél Reference Daitche and Tél2014):
 $$\begin{eqnarray}\frac{a_{H}}{a_{S}}\approx {\it\alpha}\sqrt{\frac{3{\it\beta}{\it\tau}_{p}}{{\it\tau}_{{\it\eta}}}}={\it\alpha}\frac{r}{{\it\eta}}.\end{eqnarray}$$
Thus, we expect the importance of the history force (relative to the Stokes drag) to scale solely with the particle size and to be independent of its density.
The ratio of the average magnitude of the history force and the Stokes drag as a function of (a)
 $r/{\it\eta}$
and (b)
 $St$
.

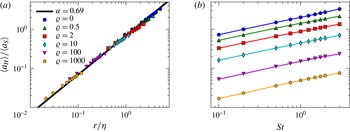
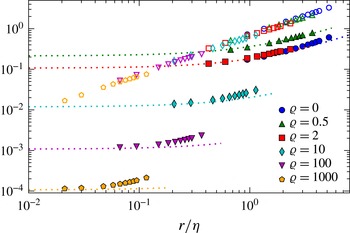
Figure 2(a) shows
 $\langle a_{H}\rangle /\langle a_{S}\rangle$
, measured in the turbulence simulations, as a function of
 $r/{\it\eta}$
. We see a collapse of the data for different densities, which confirms our expectation that the particle size is the determining parameter for the relative magnitude of the history force. (When looking more closely we actually see a very weak dependence on the density – the collapse is not perfect.) A fit of our prediction (3.2) to the data yields
 ${\it\alpha}=0.69$
and we see that this simple estimate holds quite well.
Figure 2(b) shows
 $\langle a_{H}\rangle /\langle a_{S}\rangle$
as a function of the Stokes number. The straight lines indicate a power law behaviour; indeed (3.2) suggests that this ratio scales with
 $\sqrt{St}$
for fixed
 ${\it\beta}$
. There is no collapse for different densities in contrast to figure 2(a) and the relative magnitude of the history force decays with growing density. This tendency is true for a fixed Stokes number. Because
 $St$
depends on both the density and the particle size, increasing
 ${\it\varrho}$
and holding
 $St$
fixed means that we implicitly decrease the particle size. Thus, the dependence on
 ${\it\varrho}$
in figure 2(b) is actually a disguised dependence on
 $r$
. That there is no ‘real’ dependence on
 ${\it\varrho}$
can be concluded from figure 2(a).
We are now able to make an informed categorization of the importance of the history force based on its relative magnitude (compared with the Stokes drag). For
 $r/{\it\eta}$
around
 $10^{-2}$
or less the relative magnitude is very small (
 ${<}1\,\%$
) and memory should be negligible in most cases. For
 $r/{\it\eta}$
around 0.1 the relative magnitude is around 7 %; while not negligible the history force is expected to play a minor role. For
 $r$
of the order of
 ${\it\eta}$
the contribution of the history force is of the order of the Stokes drag and is thus expected to be important for the particle motion. (It should be noted that for the particle parameters studied here, the particle density is relatively low when
 $r$
is of the order of
 ${\it\eta}$
. Therefore, in this case the largest contribution to the acceleration comes from
 $a_{P}$
, as can be seen in figure 1.)
4. Slip velocity
(a) Probability density functions of the slip velocity for particles with and without memory for
 ${\it\varrho}=2$
and
 $St=0.5$
(
 $r/{\it\eta}=0.95$
). The vertical lines show the positions of the averages:
 $\langle |\boldsymbol{v}-\boldsymbol{u}|/u_{{\it\eta}}\rangle _{memory}=0.24$
and
 $\langle |\boldsymbol{v}-\boldsymbol{u}|/u_{{\it\eta}}\rangle _{no\,memory}=0.37$
. (b) The average slip velocity with (filled symbols) and without (unfilled symbols) memory as a function of the particle size and for different particle densities.

Now that we can estimate the magnitude of the history force, let us turn to its effects on the particle dynamics. A basic property of inertial particles is that they can deviate from the fluid flow (in contrast to tracers). It is thus natural to study the effect of the history force on this deviation, namely on the slip velocity
 $\boldsymbol{v}-\boldsymbol{u}$
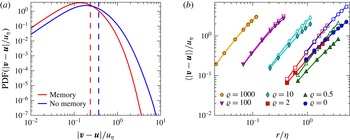
. Figure 3(a) shows the PDF of
 $\left|\boldsymbol{v}-\boldsymbol{u}\right|$
with and without the history force (denoted by ‘memory’ and ‘no memory’ respectively). Memory leads to a reduction of the slip velocity; in this case the mean slip velocity is reduced by 35 % in comparison to the case without memory. Moreover, the tail of the PDF becomes shorter, i.e., strong detachments from the flow occur less frequently with memory. Figure 3(b) presents an overview of the full parameter space, showing the average slip velocity with and without memory. The natural parameter for the slip velocity is the Stokes number; however, to make the role of the size clearer the data are shown as a function of
 $r/{\it\eta}$
. We see that the effect of the history force (the difference between the cases with and without memory) increases with
 $r$
.
The ratio of the average slip velocity with and without memory as a function of (a)
 $r/{\it\eta}$
and (b)
 $St$
.

To obtain a compact representation of this effect of memory let us use the ratio
 $|\boldsymbol{v}-\boldsymbol{u}|_{memory}/|\boldsymbol{v}-\boldsymbol{u}|_{no\,memory}$
, i.e. the slip velocity with the history force divided by the one without. Before proceeding to the data from the simulations let us first try to obtain an analytical estimate. Using the equation of motion (1.2) and the approximation (3.1) we can estimate the slip velocity as
 $$\begin{eqnarray}\boldsymbol{v}-\boldsymbol{u}\approx \left({\it\beta}\,\frac{\text{D}\boldsymbol{u}}{\text{D}t}-\frac{\text{d}\boldsymbol{v}}{\text{d}t}\right)\left(\frac{1}{{\it\tau}_{p}}+{\it\alpha}\sqrt{\frac{3{\it\beta}}{{\it\tau}_{p}{\it\tau}_{{\it\eta}}}}\right)^{-1}=\left({\it\beta}\frac{\text{D}\boldsymbol{u}}{\text{D}t}-\frac{\text{d}\boldsymbol{v}}{\text{d}t}\right)\frac{{\it\tau}_{p}}{1+{\it\alpha}\displaystyle \frac{r}{{\it\eta}}},\end{eqnarray}$$
where the case without memory is contained for
 ${\it\alpha}=0$
. If we assume that the first factor on the right-hand side of (4.1) is the same for both cases we obtain
 $$\begin{eqnarray}\frac{\left|\boldsymbol{v}-\boldsymbol{u}\right|_{memory}}{\left|\boldsymbol{v}-\boldsymbol{u}\right|_{no\,memory}}\approx \frac{1}{1+{\it\alpha}\displaystyle \frac{r}{{\it\eta}}}.\end{eqnarray}$$
The parameter
 ${\it\alpha}$
was introduced in § 3, where its value was determined from the numerical simulations:
 ${\it\alpha}=0.69$
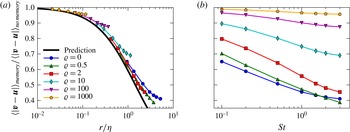
. Thus, (4.2) provides a prediction for the slip velocity ratio. Figure 4(a) shows the ratio
 $\langle |\boldsymbol{v}-\boldsymbol{u}|\rangle _{memory}/\langle |\boldsymbol{v}-\boldsymbol{u}|\rangle _{no\,memory}$
obtained from the simulations along with this prediction. Although not perfect, this estimate – based on rather simple assumptions – fits reasonably well to the simulations (note that the black line in figure 4(a) is not a fit of (4.2) to the data; we used the previously obtained value of
 ${\it\alpha}$
). An important observation is that the slip velocity ratio collapses for different densities when considered as a function of
 $r$
. Although this collapse is not perfect (there seems to be a systematic deviation for
 $St>1$
), it is still remarkable that the density plays only a minor role also for the effect of memory on the slip velocity. When the slip velocity ratio is considered as a function of
 $St$
, there is no collapse at all, see figure 4(b).
This result suggests again that the natural parameter for the effect of the history force is the particle size. Due to its simplicity, formula (4.2), as well as (3.2), can be very useful for estimates of this effect (when
 ${\it\alpha}$
is not known, one might assume
 ${\it\alpha}\approx 1$
).
The findings of this section support the categorization of the memory effect for different particle sizes given at the end of the previous section. For
 $r/{\it\eta}\leqslant 10^{-2}$
the effect is negligible as the relative reduction of the slip velocity (
 $1-\langle |\boldsymbol{v}-\boldsymbol{u}|\rangle _{memory}/\langle |\boldsymbol{v}-\boldsymbol{u}|\rangle _{no\,memory}$
) is below 1 %. For
 $r/{\it\eta}\approx 0.1$
the reduction is around 5 %, i.e. not completely negligible but still small. For
 $r/{\it\eta}\approx 1$
it is around 35 % and thus considerable.
5. Acceleration
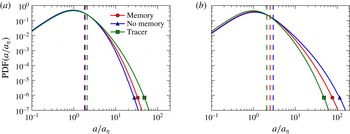
Let us now turn to the influence of the history force on the particle acceleration, a much studied quantity in turbulence research. Figure 5(a,b) shows the PDFs of the modulus of the acceleration for particles with and without memory and tracers. For heavy particles (figure 5
a) the history force increases the acceleration: the average increases slightly and the tail more notably (note the logarithmic
 $x$
-axis). For light particles (figure 5
b) the effect is opposite, the history force decreases the acceleration. The change of the mean acceleration is stronger in this case. We can describe these observations in a unified way: the acceleration PDF with memory comes closer to that of tracers (compare figures 5
a and 5
b).
Probability density functions of the magnitude of the acceleration for particles with and without memory and tracers. The particle parameters are (a)
 ${\it\varrho}=2$
,
 $St=0.5$
(
 $r/{\it\eta}=0.95$
) and (b)
 ${\it\varrho}=0$
,
 $St=0.5$
(
 $r/{\it\eta}=2.1$
). The vertical lines show the positions of the averages:
 $\langle a/a_{{\it\eta}}\rangle _{tracer}=2.1$
and
 $\langle a/a_{{\it\eta}}\rangle _{memory}=1.9$
,
 $\langle a/a_{{\it\eta}}\rangle _{no\,memory}=1.8$
in (a) and
 $\langle a/a_{{\it\eta}}\rangle _{memory}=2.5$
,
 $\langle a/a_{{\it\eta}}\rangle _{no\,memory}=3.0$
in (b).

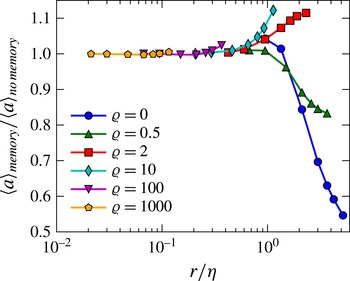
The ratio of the averaged acceleration magnitudes with and without memory.

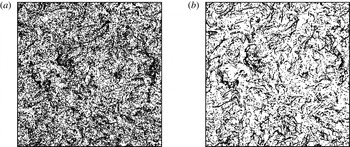
The distribution of light particles (a) with and (b) without memory. Both plots show the positions of
 $5\times 10^{4}$
particles contained in the slab
 $[0,L_{\mathit{box}}]\times [0,L_{\mathit{box}}]\times [0,L_{\mathit{box}}/10]$
at
 $t=291{\it\tau}_{{\it\eta}}$
(this corresponds to 10 large-eddy turnover times). The particles were homogeneously distributed at the beginning of the simulation and have the parameters
 ${\it\varrho}=0$
and
 $St=0.5$
.

To obtain an overview of the parameter dependence we again turn to ratios. Figure 6 shows the ratio of the (averaged) magnitudes of acceleration with and without memory. We see that the history force generally increases the acceleration of heavy particles and decreases the acceleration of light particles, as we found in two particular cases above. This effect is noticeable but not very large, except for
 ${\it\varrho}=0$
and large particle sizes. It should be noted that there is no collapse of the ratios shown in figure 6 in contrast to the slip velocity ratio shown in figure 4(a) and the force ratio shown in figure 2(a). Although the influence of memory generally increases with
 $r$
also for this observable, there is additionally a clear dependence on the density.
6. Preferential concentration
A much studied phenomenon concerning inertial particles is preferential concentration: the tendency of particles to gather in certain regions of the flow. Figure 7 shows the distribution of light particles with and without memory. In both cases we can see an inhomogeneous distribution of particles, i.e. preferential concentration. We also clearly see that the preferential concentration is weaker with the history force (figures 7 a and 7 b show the same number of particles).
To obtain an overview of the parameter dependence of this effect we need to quantify preferential concentration. There are several possible approaches; we use the correlation dimension
 $D_{2}$
as introduced by Grassberger & Procaccia (Reference Grassberger and Procaccia1983). Let
 $P(R)$
be the probability to find a given particle pair with a distance below
 $R$
, i.e.
 $$\begin{eqnarray}P(R)=\left\langle {\it\Theta}\left(R-\left|\boldsymbol{x}_{1}-\boldsymbol{x}_{2}\right|\right)\right\rangle ,\end{eqnarray}$$
where
 ${\it\Theta}$
is the Heaviside function and
 $\boldsymbol{x}_{1}$
and
 $\boldsymbol{x}_{2}$
are the positions of the two particles. Then the correlation dimension is defined through
 $$\begin{eqnarray}P(R)\propto R^{D_{2}}\quad R\rightarrow 0.\end{eqnarray}$$
In studies of preferential concentration the radial distribution function
 $g(R)$
is frequently used. It is closely related to
 $P(R)$
and
 $D_{2}$
(
 $d$
is the space dimension):
 $$\begin{eqnarray}g(R)\propto \frac{\partial _{R}P(R)}{R^{d-1}}\propto R^{D_{2}-d},\end{eqnarray}$$
see, e.g., Bec et al. (Reference Bec, Celani, Cencini and Musacchio2005). Thus,
 $D_{2}$
can also be seen as a characterization of the radial distribution function.
To determine
 $D_{2}$
we measured
 $P(R)$
in our simulations and fitted a power law in the range
 $\log _{10}R/{\it\eta}\in \left[-1,1\right]$
. To estimate the uncertainty we also fitted power laws in smaller intervals distributed in the full interval (each ranging over one decade), i.e. the fits were performed in the ranges
 $\log _{10}R/{\it\eta}\in \left[x,x+1\right],\,x\in [-1,0]$
. The uncertainty of
 $D_{2}$
was then estimated as the standard deviation of these fits, and is shown in figure 8 as error bars. The uncertainty of the difference
 $D_{2,memory}-D_{2,no\,memory}$
was estimated by applying the above procedure to
 $P_{memory}/P_{no\,memory}$
.
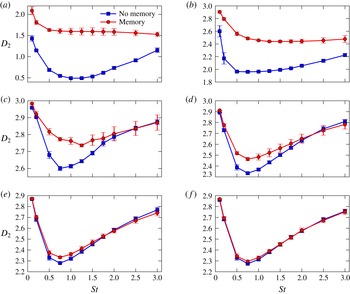
Figure 8 shows the correlation dimension as a function of the Stokes number for different densities. Without memory we see the typical unimodal shape of
 $D_{2}(St)$
found in previous studies, e.g. Calzavarini et al. (Reference Calzavarini, Kerscher, Lohse and Toschi2008). The minimal value of
 $D_{2}$
, corresponding to maximal preferential concentration, is obtained around
 $St\approx 1$
. Concerning the influence of the history force we find that for
 ${\it\varrho}=1000$
there is hardly any effect; for
 ${\it\varrho}=100$
there is a small effect; for
 ${\it\varrho}=2$
and
 ${\it\varrho}=10$
the effect is quite noticeable; for light particles (
 ${\it\varrho}=0$
and
 ${\it\varrho}=0.5$
) the effect is strong, e.g. for
 ${\it\varrho}=0$
the smallest value of
 $D_{2}$
increases by 1.1 when memory is included – a very considerable change for a fractal dimension. It is interesting to note that the position of the smallest
 $D_{2}$
is shifted by the history force for
 ${\it\varrho}=2$
; for
 ${\it\varrho}=0.5$
and
 ${\it\varrho}=0$
there does not seem to be a clear minimum with memory but rather an extended plateau. It should also be noted that the influence of memory is strongest where
 $D_{2}$
attains its minimum. To sum up, if we fix the Stokes number and decrease
 ${\it\varrho}$
, the effect of the history force on
 $D_{2}$
and thus on preferential concentration increases and becomes very strong for small densities.
The correlation dimension
 $D_{2}$
of the particle distribution in space as a function of
 $St$
for different densities with and without memory: (a)
 ${\it\varrho}=0$
; (b)
 ${\it\varrho}=0.5$
; (c)
 ${\it\varrho}=2$
; (d)
 ${\it\varrho}=10$
; (e)
 ${\it\varrho}=100$
; (f)
 ${\it\varrho}=1000$
.

The change in the correlation dimension
 $D_{2}$
due to memory as a function of the particle size and density.

For a fixed Stokes number we cannot discern the dependences of this effect on
 $r$
and
 ${\it\varrho}.$
As
 $St$
depends on both parameters, varying
 ${\it\varrho}$
implicitly varies
 $r$
; in particular, decreasing
 ${\it\varrho}$
increases
 $r$
, see (1.3)–(1.6). Thus, the dependence on
 ${\it\varrho}$
in figure 8 might be a disguised dependence on
 $r$
(as is the case in figure 2
b for the relative magnitude of the history force and in figure 4
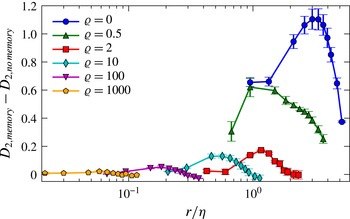
b for the slip velocity ratio). Thus, we have to consider this effect as a function of the particle size and density to discern the dependences. Figure 9 shows the change of the correlation dimension
 $D_{2,\,memory}-D_{2,\,no\,memory}$
as a function of these two variables. We see a dependence on both
 $r$
and
 ${\it\varrho}$
. This is in contrast to the behaviour of the relative magnitude of the history force (§ 3) and the slip velocity ratio (§ 4), where the determining parameter was solely
 $r$
and similar to the case of the acceleration (previous section). Moreover, the dependence on
 $r$
and
 ${\it\varrho}$
is quite non-trivial, e.g. it is non-monotonic in both variables.
A good way to summarize these findings is as follows: for a fixed Stokes number the influence of the history force increases monotonically when the particle density decreases or (equivalently) when the particle size increases. However, one has to keep in mind that this dependence cannot be attributed to only one of the two parameters.
7. Collision rates
The collision rate of particles in turbulent flows is important for the understanding of, e.g., cloud microphysics or aggregation processes; it is also closely related to preferential concentration. One of the main findings in this area is that turbulence can enhance the collision rate enormously. We will study here the effect of the history force on the collision rate.
Let
 $N_{c}(t,{\rm\Delta}{\it\tau})$
be the number of particle collisions during a small time interval
 $\left[t,t+{\rm\Delta}{\it\tau}\right]$
, then the collision rate per unit volume is
 $$\begin{eqnarray}R(t)=\frac{N_{c}(t,{\rm\Delta}{\it\tau})}{L_{box}^{3}{\rm\Delta}{\it\tau}}.\end{eqnarray}$$
This quantity is independent of
 $t$
in stationary turbulence, but grows quadratically with the particle number density
 $n=N_{p}/L_{box}^{3}$
. A quantity where this dependence is factored out is the collision kernel
 $$\begin{eqnarray}{\it\Gamma}=\frac{2R}{n^{2}},\end{eqnarray}$$
which we will use in the following.
To obtain
 $N_{c}(t,{\rm\Delta}{\it\tau})$
we have simulated an ensemble of
 $N_{p}=5\times 10^{5}$
particles for every parameter value and saved snapshots of the particle positions every
 ${\rm\Delta}{\it\tau}=0.2{\it\tau}_{{\it\eta}}$
time units. The collisions have been determined using the so-called ghost collision approximation, i.e. in our simulations the particles do not interact on contact but simply slip through each other. A collision is considered to occur when the distance between two particles becomes less then
 $2r$
. To determine the occurrence of such events, the particle trajectories have been interpolated linearly in between the saved snapshots. To estimate the uncertainty of the measured
 ${\it\Gamma}$
due to a finite sampling, we have split the whole data set into two halves, computed
 ${\it\Gamma}$
on them and considered the deviation. The magnitude of this uncertainty was found to be smaller than the size of the symbols in figure 10.
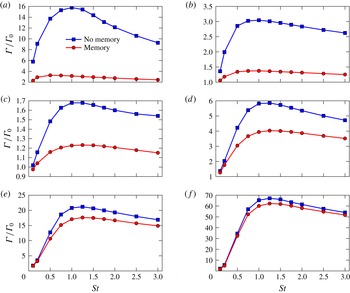
The collision kernel
 ${\it\Gamma}$
as a function of the Stokes number for different densities with and without memory: (a)
 ${\it\varrho}=0$
; (b)
 ${\it\varrho}=0.5$
; (c)
 ${\it\varrho}=2$
; (d)
 ${\it\varrho}=10$
; (e)
 ${\it\varrho}=100$
; (f)
 ${\it\varrho}=1000$
. It is normalized by
 ${\it\Gamma}_{0}=\sqrt{8{\rm\pi}/15}(2r)^{3}/{\it\tau}_{{\it\eta}}$
, the collision kernel based on the dynamics of tracers, as derived by Saffman & Turner (Reference Saffman and Turner1956).

Figure 10 shows the collision kernel as a function of the Stokes number for different densities. We see that the inclusion of the history force leads to a decrease in the collision rate. This effect is very strong for small densities and decreases for denser particles (when
 $St$
is fixed). The general picture is quite similar to that of the previous section where preferential concentration was studied, and we see that memory can be important in determining the collision rate of inertial particles.
An interesting difference from the case of preferential concentration is that for large
 ${\it\varrho}$
the influence of memory on collision rates is stronger than on preferential concentration (compare figures 8 and 10). For example, at
 ${\it\varrho}=1000$
and
 $St=1$
there is a very small change in
 $D_{2}$
due to memory but a more noticeable one in
 ${\it\Gamma}$
(8 % relative change). The collision rate in turbulence is generally believed to be influenced by two effects: preferential concentration and caustics (also called the sling effect), see e.g. Voßkuhle et al. (Reference Voßkuhle, Pumir, Lévêque and Wilkinson2014). In this context the former is generally quantified by the radial distribution function at the length scale of the particle and the latter by the mean approaching velocity of colliding particles. A study of these quantities would be needed to further understand the influence of memory on collision rates.
As detailed in the last section, we are not able to discern the roles of
 $r$
and
 ${\it\varrho}$
when
 $St$
is fixed, as is the case in figure 10. This can only be done by looking at the change of
 ${\it\Gamma}$
as a function of
 $r$
and
 ${\it\varrho}$
, as has been done for the correlation dimension in figure 9. In the analogous figure for
 ${\it\Gamma}_{memory}/{\it\Gamma}_{no\,memory}$
(not shown here) one observes a similar picture: the influence of memory depends on both
 $r$
and
 ${\it\varrho}$
. The summary of the findings for collision rates is similar as well: for a fixed Stokes number the influence of memory increases monotonically when the particle density decreases or (equivalently) when the particle size increases.
8. Comparison with the work of Olivieri et al. (Reference Olivieri, Picano, Sardina, Iudicone and Brandt2014)
Recently Olivieri et al. (Reference Olivieri, Picano, Sardina, Iudicone and Brandt2014) published a study of the history force in turbulence. During the preparation of the present work discrepancies with this publication were found. The type of flow used by Olivieri et al. (Reference Olivieri, Picano, Sardina, Iudicone and Brandt2014) is very similar to ours, therefore we present here a detailed quantitative comparison. We note that there is a difference in the methods of forcing the turbulence, which might be a cause of the discrepancies. Our forcing (which is described in appendix D) varies on a large time scale, while the forcing by Olivieri et al. (Reference Olivieri, Picano, Sardina, Iudicone and Brandt2014) changes randomly at every time step (L. Brandt, private communication, 2014), i.e. the flow and the particles are forced on small time scales.
Olivieri et al. (Reference Olivieri, Picano, Sardina, Iudicone and Brandt2014) analyse the contributions of different forces to the whole acceleration of the particle. In our notation their quantities are
 $$\begin{eqnarray}\displaystyle \boldsymbol{a}_{\mathit{PG}} & = & \displaystyle \displaystyle \frac{1}{{\it\varrho}}\frac{\text{D}\boldsymbol{u}}{\text{D}t},\end{eqnarray}$$
 $$\begin{eqnarray}\displaystyle \boldsymbol{a}_{\mathit{AM}} & = & \displaystyle \displaystyle \frac{1}{2{\it\varrho}}\left(\frac{\text{D}\boldsymbol{u}}{\text{D}t}-\frac{\text{d}\boldsymbol{v}}{\text{d}t}\right),\end{eqnarray}$$
 $$\begin{eqnarray}\displaystyle \boldsymbol{a}_{\mathit{SD}} & = & \displaystyle \displaystyle {\it\xi}\frac{\boldsymbol{u}-\boldsymbol{v}}{{\it\tau}_{p}},\end{eqnarray}$$
 $$\begin{eqnarray}\displaystyle \boldsymbol{a}_{\mathit{BA}} & = & \displaystyle \displaystyle {\it\xi}\sqrt{\frac{3{\it\beta}}{{\it\tau}_{p}}}\left(\frac{\text{d}}{\text{d}t}\right)^{1/2}\left(\boldsymbol{u}-\boldsymbol{v}\right),\end{eqnarray}$$
 ${\it\xi}={\it\tau}_{p}/{\it\tau}_{p}^{\prime }=(2{\it\varrho}+1)/(2{\it\varrho})$
accounts for the slightly different definition of the particle response time by Olivieri et al. (Reference Olivieri, Picano, Sardina, Iudicone and Brandt2014):
 ${\it\tau}_{p}^{\prime }=2{\it\varrho}r^{2}/(9{\it\nu})$
. We will use the corresponding Stokes number
 $St^{\prime }={\it\tau}_{p}^{\prime }/{\it\tau}_{{\it\eta}}=St/{\it\xi}$
for the particle parameters in this section. It should be noted that
 ${\it\xi}$
and
 ${\it\beta}$
are shorthand notations for certain combinations of
 ${\it\varrho}$
and that these three quantities are equivalent to each other.
To quantify the contributions of the different forces Olivieri et al. (Reference Olivieri, Picano, Sardina, Iudicone and Brandt2014) consider the component-wise ratios of the accelerations given above and the full particle acceleration
 $\boldsymbol{a}\equiv \text{d}\boldsymbol{v}/\text{d}t=\boldsymbol{a}_{\mathit{PG}}+\boldsymbol{a}_{\mathit{AM}}+\boldsymbol{a}_{\mathit{SD}}+\boldsymbol{a}_{\mathit{BA}}$
:
 $$\begin{eqnarray}\frac{a_{\mathit{PG},x}}{a_{x}},\quad \frac{a_{\mathit{SD},x}}{a_{x}},\quad \frac{a_{\mathit{BA},x}}{a_{x}}.\end{eqnarray}$$
Because of the statistical isotropy of the underlying turbulent flow, it suffices to consider only one component (we choose the
 $x$
-component). We omit here the contribution of the added mass effect as it is fully determined by the pressure gradient contribution:
 $a_{\mathit{AM},x}/a_{x}=(a_{\mathit{PG},x}/a_{x}+1/{\it\varrho})/2$
.
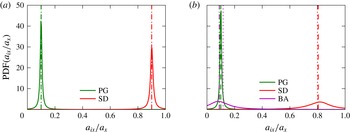
Probability density functions of the ratios
 $a_{i,x}/a_{x}$
,
 $i\in \left\{\text{PG, SD, BA}\right\}$
for
 ${\it\varrho}=10$
and
 $St^{\prime }=0.1$
without (a) and with (b) memory. The vertical dashed lines show the positions of the averages of the PDFs. The average values predicted by the approximate formulae (8.10)–(8.12) are shown with vertical dotted lines.

Figure 11 shows the PDFs of the three ratios (8.5a–c
) for
 ${\it\varrho}=10$
,
 $St^{\prime }=0.1$
in our simulations with and without memory. (It should be noted that the choice of colours in the figures of this section is different from the rest of the paper; it is the same as in Olivieri et al. (Reference Olivieri, Picano, Sardina, Iudicone and Brandt2014), to facilitate the comparison.) Let us consider the case without memory first. It is shown in figure 11(a) and corresponds to figure 3(a) in Olivieri et al. (Reference Olivieri, Picano, Sardina, Iudicone and Brandt2014). When comparing these figures one sees a considerable difference. First, the mean values (represented by dashed lines) are different, e.g. in our simulations we find that the Stokes drag on average contributes to 90 % of the particle acceleration while Olivieri et al. (Reference Olivieri, Picano, Sardina, Iudicone and Brandt2014) find 75 %. Second, the PDFs obtained from our simulations are much sharper and well separated while in Olivieri et al. (Reference Olivieri, Picano, Sardina, Iudicone and Brandt2014) they are rather broad and overlap considerably. The case with memory is similar, compare our figure 11(b) and figure 3(c) in Olivieri et al. (Reference Olivieri, Picano, Sardina, Iudicone and Brandt2014). The mean value of
 $a_{\mathit{BA},x}/a_{x}$
(representing the contribution of the history force) found by Olivieri et al. (Reference Olivieri, Picano, Sardina, Iudicone and Brandt2014) is similar to the Stokes drag contribution while we find it to be much smaller. It should be noted that the differences appear also for the case without memory and thus cannot stem solely from the treatment of the history force.
Let us obtain an independent estimate of the ratios (8.5a–c ). To this end we use the approximation (3.1) and the weakly inertial estimate for the slip velocity,
 $$\begin{eqnarray}\boldsymbol{u}-\boldsymbol{v}\approx {\it\tau}_{p}\left(1-{\it\beta}\right)\frac{\text{D}\boldsymbol{u}}{\text{D}t}\end{eqnarray}$$
(which can be obtained by expanding (1.2) in powers of
 ${\it\tau}_{p}$
and keeping the linear terms, see, e.g., Druzhinin & Ostrovsky (Reference Druzhinin and Ostrovsky1994)), and obtain estimates for (8.3), (8.4) and the total acceleration:
 $$\begin{eqnarray}\displaystyle \displaystyle \boldsymbol{a}_{\mathit{SD}} & {\approx} & \displaystyle {\it\xi}\left(1-{\it\beta}\right)\frac{\text{D}\boldsymbol{u}}{\text{D}t},\end{eqnarray}$$
 $$\begin{eqnarray}\displaystyle \displaystyle \boldsymbol{a}_{\mathit{BA}} & {\approx} & \displaystyle {\it\xi}{\it\alpha}\frac{r}{{\it\eta}}\left(1-{\it\beta}\right)\frac{\text{D}\boldsymbol{u}}{\text{D}t},\end{eqnarray}$$
 $$\begin{eqnarray}\displaystyle \displaystyle \boldsymbol{a} & {\approx} & \displaystyle \left(1+{\it\alpha}\frac{r}{{\it\eta}}\left(1-{\it\beta}\right)\right)\frac{\text{D}\boldsymbol{u}}{\text{D}t}.\end{eqnarray}$$
 ${\it\alpha}=0$
. For the ratios (8.5a–c
) we obtain estimates that depend on the particle parameters and
 ${\it\alpha}$
only:
 $$\begin{eqnarray}\displaystyle \frac{a_{\mathit{PG},x}}{a_{x}} & {\approx} & \displaystyle \frac{2}{3}\frac{{\it\xi}{\it\beta}}{1+\displaystyle \frac{r}{{\it\eta}}{\it\alpha}\left(1-{\it\beta}\right)},\end{eqnarray}$$
 $$\begin{eqnarray}\displaystyle \frac{a_{\mathit{SD},x}}{a_{x}} & {\approx} & \displaystyle \frac{{\it\xi}\left(1-{\it\beta}\right)}{1+{\it\alpha}\displaystyle \frac{r}{{\it\eta}}\left(1-{\it\beta}\right)},\end{eqnarray}$$
 $$\begin{eqnarray}\displaystyle \frac{a_{\mathit{BA},x}}{a_{x}} & {\approx} & \displaystyle \frac{{\it\xi}{\it\alpha}\displaystyle \frac{r}{{\it\eta}}\left(1-{\it\beta}\right)}{1+\displaystyle {\it\alpha}\frac{r}{{\it\eta}}\left(1-{\it\beta}\right)}.\end{eqnarray}$$
These estimates are shown in figure 11 as dotted lines. For the case without memory they coincide perfectly with the mean values obtained from the simulations (the dashed and dotted lines overlap). With memory the agreement between the estimate and the measured values is not perfect but still good. The main source of error here is probably the value of the coefficient
 ${\it\alpha}$
. We thus see that the above estimates fit quite well to our simulations but not to the ones by Olivieri et al. (Reference Olivieri, Picano, Sardina, Iudicone and Brandt2014).
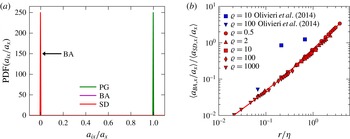
(a) Probability density functions of the ratios
 $a_{i,x}/a_{x}$
,
 $i\in \{\text{PG, SD, BA}\}$
for
 ${\it\varrho}=1$
and
 $St^{\prime }=0.01$
with memory. (b) The ratio (8.13) as a function of the particle size from our simulations and those by Olivieri et al. (Reference Olivieri, Picano, Sardina, Iudicone and Brandt2014).

Let us come to the case of neutrally buoyant particles. Figure 12(a) shows the PDFs of the ratios (8.5a–c
) for
 ${\it\varrho}=1$
and
 $St^{\prime }=0.01$
with memory (without memory the picture is the same). The PDFs are sharp peaks around the values 0 and 1. We find that the contributions by the Stokes drag and the history force are negligible and basically the full contribution to the acceleration is from the pressure gradient
 $\boldsymbol{a}_{\mathit{PG}}$
. This is expected for neutrally buoyant particles with very small Stokes numbers (
 $St^{\prime }=0.01$
here) as they should behave like tracers: with
 $\boldsymbol{v}=\boldsymbol{u}$
we obtain
 $\boldsymbol{a}_{\mathit{SD}}=\boldsymbol{a}_{\mathit{BA}}=0$
,
 $\boldsymbol{a}=\boldsymbol{a}_{\mathit{PG}}=\text{D}\boldsymbol{u}/\text{D}t$
and thus
 $a_{\mathit{SD},x}/a_{x}=a_{\mathit{BA},x}/a_{x}=0$
,
 $a_{\mathit{PG},x}/a_{x}=1$
. This picture is very different in Olivieri et al. (Reference Olivieri, Picano, Sardina, Iudicone and Brandt2014), see their figure 4. The average contribution of the Stokes drag is far from zero and even larger than the contribution of the pressure gradient. Another strong difference is that the PDFs are rather broad in contrast to the sharp peaks found here.
To obtain an overview of the deviations (for
 ${\it\varrho}\neq 1$
) let us consider the ratio
 $$\begin{eqnarray}\frac{\left\langle a_{\mathit{BA},x}/a_{x}\right\rangle }{\left\langle a_{\mathit{SD},x}/a_{x}\right\rangle },\end{eqnarray}$$
with the aim of describing the importance of the history force relative to the Stokes drag, akin to
 $\langle a_{H}\rangle /\langle a_{S}\rangle$
studied in § 3. Figure 12(b) shows the ratios (8.13) obtained from our simulations (the dependence on
 $r/{\it\eta}$
is similar to that in figure 2
a) and compares these with three data points obtained from Olivieri et al. (Reference Olivieri, Picano, Sardina, Iudicone and Brandt2014). We see that the difference is considerable; the largest deviation is by almost one order of magnitude (for
 ${\it\varrho}=10$
,
 $St^{\prime }=0.1$
and thus
 $r/{\it\eta}=0.21$
).
To quantify preferential concentration Olivieri et al. (Reference Olivieri, Picano, Sardina, Iudicone and Brandt2014) use the radial distribution function
 $g(R)$
and find that memory reduces
 $g(R)$
and thus the preferential concentration. Generally, this is what we also find, but the amount of reduction is much smaller in our case. For example, at
 $St^{\prime }=1$
we find the relative reduction
 $$\begin{eqnarray}1-\frac{g(R={\it\eta})_{memory}}{g(R={\it\eta})_{no\,memory}}\end{eqnarray}$$
to be 25 % for
 ${\it\varrho}=10$
and 3.5 % for
 ${\it\varrho}=1000$
, while Olivieri et al. (Reference Olivieri, Picano, Sardina, Iudicone and Brandt2014) find 52 % and 23 % respectively.
To conclude, we see that there are strong differences between our results and those of Olivieri et al. (Reference Olivieri, Picano, Sardina, Iudicone and Brandt2014). A comparison with analytical estimates of the forces favours our results. From our perspective the simulations by Olivieri et al. (Reference Olivieri, Picano, Sardina, Iudicone and Brandt2014) seem to overestimate the importance of the history force. We note, however, that the conclusions by Olivieri et al. (Reference Olivieri, Picano, Sardina, Iudicone and Brandt2014) are similar to ours on a more general qualitative level.
9. Summary and discussion
In the present paper we we have studied the importance of the history force – a memory effect – for the motion of inertial particles in a turbulent flow. We have found that it can be quite important (depending on the particle parameters). Its effect is to reduce (i) the slip velocity, (ii) the difference in acceleration between inertial particles and tracers, (iii) the preferential concentration and (iv) the collision rate. We can concisely summarize these findings as follows: the history force causes inertial particles to stay closer to the flow and to behave more like tracers. This is in accordance with previous findings in a smooth flow with chaotic advection (Daitche & Tél Reference Daitche and Tél2011, Reference Daitche and Tél2014).
How large the effects of memory are depends on the particle parameters. We have found simple approximative relations for the magnitude of the history force relative to the Stokes drag,
 $$\begin{eqnarray}\frac{a_{history\,force}}{a_{Stokes\,drag}}\approx {\it\alpha}\frac{r}{{\it\eta}},\end{eqnarray}$$
and for the reduction of the slip velocity by memory,
 $$\begin{eqnarray}\frac{\left|\boldsymbol{v}-\boldsymbol{u}\right|_{memory}}{\left|\boldsymbol{v}-\boldsymbol{u}\right|_{no\,memory}}\approx \frac{1}{1+{\it\alpha}\displaystyle \frac{r}{{\it\eta}}}.\end{eqnarray}$$
The constant
 ${\it\alpha}$
is expected to be of the order of unity and from numerical simulations we have determined
 ${\it\alpha}=0.69$
. These relations make it possible to quickly obtain an estimate of the importance of the history force (when
 ${\it\alpha}$
is not known, setting
 ${\it\alpha}=1$
should still yield a reasonable estimate). The fact that these relations fit well to numerical simulations shows that for the magnitude of the history force and for the reduction of the slip velocity the determining parameter is the particle size and the density is of minor importance.
This, however, is not true for all effects of memory. We have found that the influence of the history force on particle acceleration, preferential concentration and collision rates depends on both the particle size and the density. In these cases we were not able to find simple estimates as above. A general summary of the findings on preferential concentration and collision rates is that for a fixed Stokes number a decreasing density or equivalently an increasing particle size leads to stronger effects of the history force. These effects can become quite strong for small densities/large sizes.
An important field of study for inertial particles is the motion of water droplets in air (e.g. in a cloud), where the density ratio
 ${\it\varrho}\approx 1000$
is very large. In this case we have found the effect of memory to be rather small. This is also true for the relative magnitude of the history force and the reduction of the slip velocity, which do not depend on the particle density (at least approximately). At first this might seem contradictory, but it becomes clear when we note the following: we considered a fixed range of Stokes numbers (
 $St\in \left[0.1,3\right]$
), the corresponding particle sizes for
 ${\it\varrho}=1000$
are quite small (
 $r/{\it\eta}\in \left[0.02,0.12\right]$
) and hence also the effect of memory. It might, however, become more significant for larger
 $r/{\it\eta}$
. Even within the investigated range, an interesting finding is that the change of the collision rate caused by the history force at
 ${\it\varrho}=1000$
and
 $St=1$
is 8 %. Although this is still small, it is significantly larger than the effect on all other studied quantities for
 ${\it\varrho}=1000$
. It remains to be seen whether this has any practical implications.
Acknowledgements
The author would like to thank T. Tél for many insightful comments and discussions, as well as J. Bec, L. Brandt, U. Feudel, H. Homann, O. Kamps and M. Wilczek. The Eulerian part of the simulation code was written by M. Wilczek. This research was supported by the German National Academic Foundation (Studienstiftung des deutschen Volkes).
Appendix A. Faxén corrections in comparison to the history force
The aim of the present section is to compare the magnitudes of the Faxén corrections and the history force. We will see that the former are much smaller than the latter for most particle parameters considered in this paper.
With the Faxén corrections the evolution equation (1.2) becomes
 $$\begin{eqnarray}\frac{\text{d}\boldsymbol{v}}{\text{d}t}={\it\beta}\frac{\text{D}}{\text{D}t}\left(\boldsymbol{u}+\frac{r^{2}}{10}{\rm\Delta}\boldsymbol{u}\right)-\frac{1}{{\it\tau}_{p}}\left(\boldsymbol{v}-\boldsymbol{u}-\frac{r^{2}}{6}{\rm\Delta}\boldsymbol{u}\right)-\sqrt{\frac{3{\it\beta}}{{\it\tau}_{p}}}\left(\frac{\text{d}}{\text{d}t}\right)^{1/2}\left(\boldsymbol{v}-\boldsymbol{u}-\frac{r^{2}}{6}{\rm\Delta}\boldsymbol{u}\right),\end{eqnarray}$$
see Gatignol (Reference Gatignol1983) and Maxey & Riley (Reference Maxey and Riley1983). The full Faxén corrections are actually defined in terms of surface and volume integrals of
 $\boldsymbol{u}$
and
 $\text{D}\boldsymbol{u}/\text{D}t$
. The
 ${\rm\Delta}\boldsymbol{u}$
terms in (A 1), which are the commonly used forms of Faxén corrections, are the first non-vanishing terms of a Taylor expansion of these integrals. We restrict ourself here to these approximations (the full Faxén corrections have been considered by Calzavarini et al. (Reference Calzavarini, Volk, Lévêque, Pinton and Toschi2012) in the case of neutrally buoyant particles through a special numerical scheme). The second limitation of our comparison is that we do not solve (A 1) but (1.2) without Faxén corrections and only afterwards evaluate
 ${\rm\Delta}\boldsymbol{u}$
along the particle trajectories. Our aim is to obtain a rough comparison of the typical magnitudes of the Faxén corrections and the history force; we expect that our approach, in spite of these limitations, will be sufficient for this purpose.
In § 3 we compared the history force with the drag and found a simple approximate rule for their ratio (3.2). We proceed in the same way for the Faxén corrections, by considering the ratio to the Stokes drag. The last two terms in (A 1) yield the ratio
 $(r^{2}/6)|{\rm\Delta}\boldsymbol{u}|/|\boldsymbol{v}-\boldsymbol{u}|$
. By approximating the slip velocity with
 $$\begin{eqnarray}\boldsymbol{v}-\boldsymbol{u}\approx {\it\tau}_{p}\left({\it\beta}-1\right)\frac{1}{1+{\it\alpha}\displaystyle \frac{r}{{\it\eta}}}\frac{\text{D}\boldsymbol{u}}{\text{D}t},\end{eqnarray}$$
which follows from (4.1) with
 $\text{d}\boldsymbol{v}/\text{d}t\approx \text{D}\boldsymbol{u}/\text{D}t$
, and using (1.4) we obtain
 $$\begin{eqnarray}\frac{r^{2}}{6}\frac{\left|{\rm\Delta}\boldsymbol{u}\right|}{\left|\boldsymbol{v}-\boldsymbol{u}\right|}\approx \frac{1}{2}\frac{{\it\beta}}{\left|{\it\beta}-1\right|}\left(1+{\it\alpha}\frac{r}{{\it\eta}}\right)\frac{\left|{\it\nu}{\rm\Delta}\boldsymbol{u}\right|}{\left|\text{D}\boldsymbol{u}/\text{D}t\right|}.\end{eqnarray}$$
Approximation (A 2) is similar to (8.6), but is of the slightly higher order
 $3/2$
in
 ${\it\tau}_{p}$
(as
 $1/\left(1+{\it\alpha}r/{\it\eta}\right)\approx 1-{\it\alpha}r/{\it\eta}$
and
 $r\propto \sqrt{{\it\tau}_{p}}$
). By averaging over tracers in our simulation we find
 $$\begin{eqnarray}\frac{\left\langle \left|{\it\nu}{\rm\Delta}\boldsymbol{u}\right|\right\rangle }{\left\langle \left|\text{D}\boldsymbol{u}/\text{D}t\right|\right\rangle }=0.14.\end{eqnarray}$$
Because an average over tracers is equivalent to an Eulerian average, this ratio can be considered to be a property of the underlying flow, independent of the particle picture. Moreover, this result implies that the main contribution to
 $\text{D}\boldsymbol{u}/\text{D}t=-{\rm\nabla}p+{\it\nu}{\rm\Delta}\boldsymbol{u}$
is from
 ${\rm\nabla}p$
and thus justifies the commonly used name ‘pressure gradient’ for
 $\text{D}\boldsymbol{u}/\text{D}t$
. Figure 13 shows the ratio
 $(r^{2}/6)\left\langle \left|{\rm\Delta}\boldsymbol{u}\right|\right\rangle /\left\langle \left|\boldsymbol{v}-\boldsymbol{u}\right|\right\rangle$
obtained from simulations together with the approximation (A 3) for the numerical value (A 4). It fits quite well for
 ${\it\varrho}<10$
. For
 ${\it\varrho}\geqslant 10$
there is a notable mismatch; nevertheless, (A 3) provides a reasonable order of magnitude estimate.
A comparison of the magnitudes of the Faxén corrections and the history force. The ratio
 $(r^{2}/6)\langle |{\rm\Delta}\boldsymbol{u}|\rangle /\langle |\boldsymbol{v}-\boldsymbol{u}|\rangle$
(filled symbols), its approximation (A 3) (dotted lines) and the ratio
 $\langle a_{H}\rangle /\langle a_{S}\rangle$
(unfilled symbols) are shown.

Figure 13 also shows the ratio of the history force and the Stokes drag
 $\left\langle a_{H}\right\rangle /\left\langle a_{S}\right\rangle$
, which was studied in § 3. We see that for all studied parameter values the magnitude of the Faxén corrections is smaller than the magnitude of the history force; in most cases it is much smaller. From all of the considered densities the relative size of the Faxén corrections is largest at
 ${\it\varrho}=0.5$
. This is expected because this value is closest to
 ${\it\varrho}=1$
, in which case
 $\boldsymbol{v}\approx \boldsymbol{u}$
and thus the ratio
 $(r^{2}/6)\left|{\rm\Delta}\boldsymbol{u}\right|/\left|\boldsymbol{v}-\boldsymbol{u}\right|$
becomes very large.
For
 ${\it\varrho}=1$
we can expect
 $a_{H}\approx 0$
(see also appendix B), and because the Faxén corrections remain finite they are expected to be much more important than the history force for neutrally buoyant particles (indeed, even more important than the Stokes drag).
If we use the approximation (A 3) and extrapolate to smaller particles sizes, we see that the Faxén corrections become larger than the history force when
 $r$
is small enough. Indeed, the ratio
 $(r^{2}/6)\left|{\rm\Delta}\boldsymbol{u}\right|/\left|\boldsymbol{v}-\boldsymbol{u}\right|$
tends to a constant for
 $r\rightarrow 0$
while
 $a_{H}/a_{S}$
goes to zero, see figure 13. Thus, for small
 $r$
(how small depends on
 ${\it\varrho}$
) the Faxén corrections become more important than the history force. However, this is not the case for all of our studied parameter values. Moreover, when
 ${\it\varrho}$
is not close to 1 both terms are quite small when the Faxén terms become more important; then both might be neglected.
Let us now come to the Faxén correction from the first term in (A 1). Using (A 2) we find the approximation
 $$\begin{eqnarray}\frac{{\it\beta}\displaystyle \frac{\text{D}}{\text{D}t}\frac{r^{2}}{10}{\rm\Delta}\boldsymbol{u}}{\displaystyle \frac{1}{{\it\tau}_{p}}\left|\boldsymbol{v}-\boldsymbol{u}\right|}\approx \frac{1}{10}\frac{{\it\beta}}{\left|{\it\beta}-1\right|}\left(\frac{r}{{\it\eta}}\right)^{2}\left(1+{\it\alpha}\frac{r}{{\it\eta}}\right)\frac{\left|{\it\tau}_{{\it\eta}}\displaystyle \frac{\text{D}}{\text{D}t}{\it\nu}{\rm\Delta}\boldsymbol{u}\right|}{\left|\text{D}\boldsymbol{u}/\text{D}t\right|}\end{eqnarray}$$
and for the unknown ratio
 $$\begin{eqnarray}\frac{\left\langle \left|{\it\tau}_{{\it\eta}}\displaystyle \frac{\text{D}}{\text{D}t}{\it\nu}{\rm\Delta}\boldsymbol{u}\right|\right\rangle }{\left\langle \left|\text{D}\boldsymbol{u}/\text{D}t\right|\right\rangle }=0.11\end{eqnarray}$$
from simulations. Using this value and
 ${\it\alpha}=0.69$
(obtained in § 3) we can estimate that the Faxén correction from the first term in (A 1) is smaller than that from the second or third term when
 $r/{\it\eta}\leqslant 2.5$
. Furthermore, we find that the ratio (A 5) is smaller than
 $\left\langle a_{H}\right\rangle /\left\langle a_{S}\right\rangle$
for all of the considered parameter values (i.e. those shown in figure 13).
We thus conclude that the magnitude of the Faxén corrections is smaller than the magnitude of the history force for all of the investigated particle parameters; in most cases it is much smaller.
Appendix B. A note on neutrally buoyant particles
Up to now we have not considered the case of neutrally buoyant particles. This case is special because the trajectories of tracers, i.e.
 $\boldsymbol{v}=\boldsymbol{u}$
, are valid solutions of (1.2) for
 ${\it\varrho}=1$
. Indeed, we have found in our simulations (for Stokes numbers of 0.01, 0.1 and 1) that neutrally buoyant particles behave very similarly to tracers: the mean slip velocity is practically zero, the acceleration PDF is the same as for tracers, there is no preferential concentration and the collision rates equal those of tracers (with an artificially assigned corresponding radius). The inclusion of the history force does not change any of these findings and thus seems not to be important for neutrally buoyant particles.
We note that for larger particle sizes (not considered here) neutrally buoyant particles can behave differently from tracers; Calzavarini et al. (Reference Calzavarini, Volk, Lévêque, Pinton and Toschi2012) have studied the effect of memory in this case (along with the influence of Faxén corrections and nonlinear drag).
Concerning the forces acting on a particle, we find
 $\left\langle a_{S}\right\rangle \approx 0$
and
 $\left\langle a_{H}\right\rangle \approx 0$
for all studied Stokes numbers (see also figure 12
a). Thus, the overwhelming contribution to the particle acceleration comes from the pressure term
 $a_{P}$
. This does not mean that the Stokes drag is unimportant, because neglecting it (and the history force) in (1.2) would allow for solutions of the type
 $\boldsymbol{v}=\boldsymbol{u}+\boldsymbol{c}$
with an arbitrary constant
 $\boldsymbol{c}$
, which is undesirable. One needs the Stokes drag as a restoring effect which keeps the particle close to a tracer trajectory (even though it has to act rarely). The history force can also be considered as a restoring effect (indeed, it is sometimes called the unsteady drag). The fact that we do not find any influence of memory suggests that the Stokes drag is already sufficient to keep the particles very close to the tracer trajectories.
It should be noted that we neglected the Faxén corrections in our simulations. This might be a serious limitation for neutrally buoyant particles, as the findings of appendix A suggest. Thus, the results of this section should to be treated with some caution.
A fundamental question concerning neutrally buoyant particles is whether the tracer solutions are stable, see, e.g., Babiano et al. (Reference Babiano, Cartwright, Piro and Provenzale2000), Sapsis & Haller (Reference Sapsis and Haller2008). The history force might play a very non-trivial role here. For example, it was shown by Daitche & Tél (Reference Daitche and Tél2011) that the history force can destroy attractors and that the convergence towards attractors becomes very slow (
 ${\sim}t^{-1/2}$
) with memory. Thus, a thorough study of the influence of memory on neutrally buoyant particles would have to include a stability analysis of tracer trajectories; this, however, is beyond the scope of this paper.
Appendix C. A time-stepping scheme for particles with memory
Let us start by rewriting the evolution equation (1.2) for the slip velocity
 $\boldsymbol{w}=\boldsymbol{v}-\boldsymbol{u}$
:
 $$\begin{eqnarray}\displaystyle & \displaystyle \frac{\text{d}\boldsymbol{w}}{\text{d}t}=\left({\it\beta}-1\right)\frac{\text{d}\boldsymbol{u}}{\text{d}t}-{\it\beta}\boldsymbol{w}\boldsymbol{\cdot }\boldsymbol{{\rm\nabla}}\boldsymbol{u}-\frac{1}{{\it\tau}_{p}}\boldsymbol{w}-\sqrt{\frac{3{\it\beta}}{{\rm\pi}{\it\tau}_{p}}}\frac{\text{d}}{\text{d}t}\int _{0}^{t}\frac{\boldsymbol{w}}{\sqrt{t-{\it\tau}}}\,\text{d}{\it\tau}, & \displaystyle\end{eqnarray}$$
 $$\begin{eqnarray}\displaystyle & \displaystyle \frac{\text{d}\boldsymbol{x}}{\text{d}t}=\boldsymbol{w}+\boldsymbol{u}, & \displaystyle\end{eqnarray}$$
where
 $\text{d}\boldsymbol{u}/\text{d}t=\partial _{t}\boldsymbol{u}+\boldsymbol{v}\boldsymbol{\cdot }\boldsymbol{{\rm\nabla}}\boldsymbol{u}$
. We wish to obtain a numerical solution at the time points
 $t_{n}=nh$
, where
 $h$
is the time step. Integrating (C 1) from
 $t_{n}$
to
 $t_{n+1}$
we obtain
 $$\begin{eqnarray}\displaystyle \boldsymbol{w}_{n+1} & = & \displaystyle \boldsymbol{w}_{n}+\left({\it\beta}-1\right)\left(\boldsymbol{u}_{n+1}-\boldsymbol{u}_{n}\right)-{\it\beta}\int _{t_{n}}^{t_{n+1}}\boldsymbol{w}\boldsymbol{\cdot }\boldsymbol{{\rm\nabla}}\boldsymbol{u}\,\text{d}{\it\tau}-\frac{1}{{\it\tau}_{p}}\int _{t_{n}}^{t_{n+1}}\boldsymbol{w}\,\text{d}{\it\tau}\nonumber\\ \displaystyle & & \displaystyle +\,{\it\xi}\int _{0}^{t_{n+1}}\frac{\boldsymbol{w}}{\sqrt{t_{n+1}-{\it\tau}}}\,\text{d}{\it\tau}-{\it\xi}\int _{0}^{t_{n}}\frac{\boldsymbol{w}}{\sqrt{t_{n}-{\it\tau}}}\,\text{d}{\it\tau},\end{eqnarray}$$
where
 ${\it\xi}=-\sqrt{3{\it\beta}/({\rm\pi}{\it\tau}_{p})}$
. To obtain a numerical stepping scheme we have to approximate the integrals. We begin with the first two:
 $$\begin{eqnarray}\int _{t_{n}}^{t_{n+1}}f({\it\tau})\,\text{d}{\it\tau}\approx h\mathop{\sum }_{i=0}^{m}{\it\lambda}_{i}^{(m)}f({\it\tau}_{n+1-i}).\end{eqnarray}$$
The coefficients
 ${\it\lambda}_{i}^{(m)}$
are well known. For an explicit scheme, i.e.
 ${\it\lambda}_{0}=0$
, they are the coefficients
 ${\bf\lambda}^{B,m}$
of the Adams–Bashforth schemes:
 $$\begin{eqnarray}\displaystyle {\bf\lambda}^{B,2} & = & \displaystyle \left(0,1\right),\end{eqnarray}$$
 $$\begin{eqnarray}\displaystyle {\bf\lambda}^{B,3} & = & \displaystyle \left(0,{\textstyle \frac{3}{2}},-{\textstyle \frac{1}{2}}\right),\end{eqnarray}$$
 $$\begin{eqnarray}\displaystyle {\bf\lambda}^{B,4} & = & \displaystyle \left(0,{\textstyle \frac{23}{12}},-{\textstyle \frac{4}{3}},{\textstyle \frac{5}{12}}\right).\end{eqnarray}$$
 ${\bf\lambda}^{M,m}$
of the Adams–Moulton schemes:
 $$\begin{eqnarray}\displaystyle {\bf\lambda}^{M,2} & = & \displaystyle \left({\textstyle \frac{1}{2}},{\textstyle \frac{1}{2}}\right),\end{eqnarray}$$
 $$\begin{eqnarray}\displaystyle {\bf\lambda}^{M,3} & = & \displaystyle \left({\textstyle \frac{5}{12}},{\textstyle \frac{8}{12}},-{\textstyle \frac{1}{12}}\right).\end{eqnarray}$$
 $O(h^{m})$
for
 ${\bf\lambda}^{B,m}$
and
 $O(h^{m+1})$
for
 ${\bf\lambda}^{M,m}$
. The history integrals in (C 3) are approximated with
 $$\begin{eqnarray}\int _{0}^{t_{n}}\frac{\boldsymbol{w}}{\sqrt{t-{\it\tau}}}\,\text{d}{\it\tau}\approx \sqrt{h}\mathop{\sum }_{i=0}^{n}{\it\mu}_{i}\boldsymbol{w}_{n-i},\end{eqnarray}$$
where
 $\boldsymbol{w}_{n}=\boldsymbol{w}(t_{n})$
and the coefficients
 ${\it\mu}_{i}$
are given by Daitche (Reference Daitche2013). We thus obtain the following scheme for the slip velocity:
 $$\begin{eqnarray}\displaystyle \boldsymbol{w}_{n+1} & = & \displaystyle \boldsymbol{w}_{n}+\left({\it\beta}-1\right)\left(\boldsymbol{u}_{n+1}-\boldsymbol{u}_{n}\right)-{\it\beta}h\mathop{\sum }_{i=0}^{m}{\it\lambda}_{i}^{B,m}\left[\boldsymbol{w}\boldsymbol{\cdot }\boldsymbol{{\rm\nabla}}\boldsymbol{u}\right]_{n+1-i}-\frac{h}{{\it\tau}_{p}}\mathop{\sum }_{i=0}^{m}{\it\lambda}_{i}^{M,m}\boldsymbol{w}_{n+1-i}\nonumber\\ \displaystyle & & \displaystyle +\,{\it\xi}\sqrt{h}\left(\mathop{\sum }_{i=0}^{n+1}{\it\mu}_{i}\boldsymbol{w}_{n+1-i}-\mathop{\sum }_{i=0}^{n}{\it\mu}_{i}\boldsymbol{w}_{n-i}\right).\end{eqnarray}$$
The right-hand side contains
 $\boldsymbol{w}_{n+1}$
, but only linearly. Bringing it to the left-hand side yields an explicit scheme:
 $$\begin{eqnarray}\displaystyle & & \displaystyle \left(1+\frac{h}{{\it\tau}_{p}}{\it\lambda}_{0}^{M}-{\it\xi}\sqrt{h}{\it\mu}_{0}\right)\boldsymbol{w}_{n+1}\nonumber\\ \displaystyle & & \displaystyle \quad =\boldsymbol{w}_{n}+\left({\it\beta}-1\right)\left(\boldsymbol{u}_{n+1}-\boldsymbol{u}_{n}\right)-{\it\beta}h\mathop{\sum }_{i=0}^{m}{\it\lambda}_{i}^{B,m}\left[\boldsymbol{w}\boldsymbol{\cdot }\boldsymbol{{\rm\nabla}}\boldsymbol{u}\right]_{n+1-i}\nonumber\\ \displaystyle & & \displaystyle \qquad -\,\frac{h}{{\it\tau}_{p}}\mathop{\sum }_{i=1}^{m}{\it\lambda}_{i}^{M,m}\boldsymbol{w}_{n+1-i}+{\it\xi}\sqrt{h}\left(\mathop{\sum }_{i=1}^{n+1}{\it\mu}_{i}\boldsymbol{w}_{n+1-i}-\mathop{\sum }_{i=0}^{n}{\it\mu}_{i}\boldsymbol{w}_{n-i}\right),\end{eqnarray}$$
 $$\begin{eqnarray}\displaystyle \boldsymbol{x}_{n+1}=\boldsymbol{x}_{n}+h\mathop{\sum }_{i=0}^{m}{\it\lambda}_{i}^{B,m}(\boldsymbol{w}_{n+1-i}+\boldsymbol{u}_{n+1-i}). & & \displaystyle\end{eqnarray}$$
Using
 ${\it\lambda}_{i}^{B,4}$
,
 ${\it\lambda}_{i}^{M,3}$
and the third-order coefficients
 ${\it\mu}_{i}$
from Daitche (Reference Daitche2013) the above scheme has a one-step error of
 $O(h^{4})$
, i.e. it is a third-order scheme.
As this scheme relies on previous values of
 $\boldsymbol{x}$
and
 $\boldsymbol{w}$
, one needs to start the integration with lower-order schemes: the first step with
 ${\it\lambda}_{i}^{B,2}$
,
 ${\it\lambda}_{i}^{M,1}$
and the first-order
 ${\it\mu}_{i}$
; the second step with
 ${\it\lambda}_{i}^{B,3}$
,
 ${\it\lambda}_{i}^{M,2}$
and the second-order
 ${\it\mu}_{i}$
.
To further improve the accuracy of the scheme, corrector steps have been applied. A corrector step is performed by predicting
 $\boldsymbol{x}_{n+1}$
,
 $\boldsymbol{w}_{n+1}$
with the explicit scheme (C 12)–(C 13), replacing the
 ${\it\lambda}_{i}^{B}$
in this scheme with
 ${\it\lambda}_{i}^{M}$
(thus making it implicit), inserting the predicted
 $\boldsymbol{x}_{n+1}$
,
 $\boldsymbol{w}_{n+1}$
in the right-hand side and calculating a corrected estimate for
 $\boldsymbol{x}_{n+1}$
,
 $\boldsymbol{w}_{n+1}$
. (The corrector steps are not essential for the numerical scheme.)
That the one-step error of this scheme indeed scales with
 $h^{4}$
has been verified in a case where an analytical solution of (1.2) is available: a particle moving in a two-dimensional vortex (Candelier et al.
Reference Candelier, Angilella and Souhar2004), see also Daitche (Reference Daitche2013).
Appendix D. Forcing the turbulence
We solve the vorticity equation in a triply periodic box of length
 $L_{box}=2{\rm\pi}$
. In Fourier space the equation becomes
 $$\begin{eqnarray}\partial _{t}{\bf\omega}_{\boldsymbol{k}}=\text{i}\boldsymbol{k}\times \mathscr{F}[\boldsymbol{u}\times {\bf\omega}]_{\boldsymbol{k}}-{\it\nu}\boldsymbol{k}^{2}{\bf\omega}_{\boldsymbol{k}}+\boldsymbol{F}_{\boldsymbol{k}}.\end{eqnarray}$$
Here,
 ${\bf\omega}=\boldsymbol{{\rm\nabla}}\times \boldsymbol{u}$
is the vorticity,
 $\boldsymbol{k}\in \mathbb{Z}^{3}$
is the wavevector,
 $\mathscr{F}$
is the Fourier transform and
 $\boldsymbol{F}$
is the forcing. The latter is implicitly defined as described in the following. We force by inserting the energy lost during one time step back into large-scale modes
 ${\bf\omega}_{\boldsymbol{k}}$
with
 $\boldsymbol{k}$
in the forcing band
 $$\begin{eqnarray}B=\{\boldsymbol{k}\mid 3\leqslant \boldsymbol{k}^{2}\leqslant 9\}.\end{eqnarray}$$
Let
 ${\bf\omega}_{\boldsymbol{k}}^{n}$
be the current vorticity and
 $\tilde{{\bf\omega}}_{\boldsymbol{k}}^{n+1}$
the vorticity after one time step without forcing (more precisely, when using a scheme consisting of multiple stages, like a Runge–Kutta method,
 $\tilde{{\bf\omega}}_{\boldsymbol{k}}^{n+1}$
is the vorticity after one stage). The forcing is applied by rescaling the modes in the forcing band:
 $$\begin{eqnarray}{\bf\omega}_{\boldsymbol{k}}^{n+1}=\left\{\begin{array}{@{}ll@{}}f\tilde{{\bf\omega}}_{\boldsymbol{k}}^{n+1},\quad & \boldsymbol{k}\in B,\\ \tilde{{\bf\omega}}_{\boldsymbol{k}}^{n+1},\quad & \boldsymbol{k}\notin B.\end{array}\right.\end{eqnarray}$$
The factor
 $f$
is chosen such that the energy of the flow
 $$\begin{eqnarray}E\left[{\bf\omega}_{\boldsymbol{k}}\right]=\frac{1}{2}\mathop{\sum }_{\boldsymbol{k}}\frac{\left|{\bf\omega}_{\boldsymbol{k}}\right|^{2}}{\boldsymbol{k}^{2}}\end{eqnarray}$$
remains constant, i.e.
 $$\begin{eqnarray}E\left[{\bf\omega}_{\boldsymbol{k}}^{n+1}\right]=E\left[{\bf\omega}_{\boldsymbol{ k}}^{n}\right].\end{eqnarray}$$
The modes
 $\{{\bf\omega}_{\boldsymbol{k}}\mid \boldsymbol{k}\notin B\}$
evolve freely and the energy is kept constant by inserting energy into the modes
 $\{{\bf\omega}_{\boldsymbol{k}}\mid \boldsymbol{k}\in B\}$
. It should be noted that only the modulus of the modes is modified; their direction can evolve freely, which improves the statistical isotropy of the flow.