


1. Introduction
Set in the Fusion Broader Approach agreement between Europe and Japan, IFMIF (International Fusion Materials Irradiation Facility) will be the world's most intense neutron source dedicated to study materials covering internal walls of the future fusion reactors. It will include two identical linear accelerators accelerating 2 × 125 mA of CW deuteron beams to the energy of 40 MeV, resulting in a total beam power of 2 × 5 MW (Mosnier et al., Reference Mosnier, Beauvais, Brañas, Comunian, Facco, Garin, Gobin, Gournay, Heidinger, Ibarra, Joyer, Kimura, Kojima, Kubo, Maebara, Marroncle, Mendez, Nghiem, Ohira, Okumura, Orsini, Palmieri, Pepato, Pisent, Podadera, Sanz, Shinto, Takahashi, Toral, Vermare and Yonemoto2010). The two beam lines must converge on a liquid lithium target to produce the required neutron flux, with a rectangular and uniform footprint. In a first phase currently in progress, a full scale prototype accelerator up to 9 MeV – 1.1 MW is being studied and constructed in Europe, to be installed in Japan. For this prototype called LIPAc (Linear IFMIF Prototype Accelerator), the final beam must be properly expanded toward a beam dump. In this paper, the global parameters of IFMIF are compared to those of other high-power accelerators. This reveals the simultaneous combination of unprecedented characteristics to be achieved. The induced challenges in beam dynamics design are pointed out, and the strategies to overcome them are outlined. Obtained results are shown and discussed, with a focus on LIPAc start-to-end simulations results. Finally, the conflicts between beam halo and emittance minimizations are addressed, and possible ways for improvement discussed. This work has been briefly approached in short papers (Nghiem et al., Reference Nghiem, Chauvin, Comunian, Delferrière, Duperrier, Mosnier, Oliver, Simeoni and Uriot2011a; Chauvin et al., Reference Chauvin, Nghiem, Comunian, Delferrière, Duperrier, Monsier, Oliver and Uriot2011; Simeoni Jr et al., Reference Simeoni, Nghiem, Uriot, Chauvin and Mosnier2011). It is here gathered, updated and furthermore developed to form a coherent and complete topic.
2. Issues
The general layout of the IFMIF accelerators is given in Fig. 1 where beam energy and power are pointed out along the beam line. Due to the very high CW beam intensity required, the D+ beam power becomes significant from the earliest acceleration stages where the beam energy is still low. The average power is 18 kW at the ion source extraction, 0.6 MW at the RFQ exit, 1.1 MW after the first SRF-Linac's cryomodule, and finally 5 MW after the 4 cryomodules. This corresponds, respectively, to the energies of 100 keV, 5, 9, and 40 MeV, where energy of space-charge forces is still dominant or at least noticeable. This situation is unique when compared to worldwide linear accelerators in operation or planned (Nghiem et al., Reference Nghiem, Chauvin, Comunian, Delferrière, Duperrier, Mosnier, Oliver and Uriot2011b). For a given energy, IFMIF has the highest beam power and the highest space-charge regime. If we consider now the limit where the beam power becomes critical from the point of view of losses, let us say, for example, from 1 MW, IFMIF has by far the highest space-charge level. One relevant parameter to consider is the generalised perveance K given by
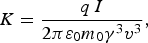 $$K = \displaystyle{{q\, I} \over {2{\rm \pi} {\rm \varepsilon} _0 m_0 {\rm {\rm \gamma} }^3 {v}^3 }}\comma$$
(Color online) Layouts of the IFMIF accelerators.

ε0 is the vacuum permittivity, I is the beam intensity, γ is the relativistic factor, and m 0, q, v are the particle rest mass, charge, and speed, respectively. For a given beam power, the IFMIF's K is higher by at least two or three orders of magnitude compared to the most powerful linacs. It means that when the beam power becomes very important so that the beam should be very precisely controlled, because even tiny loss fraction as low as 10−6 is harmful, the beam behavior is still very difficult to manage due to strong space-charge non-linearity effects.
Another parameter allowing to estimate the importance of space-charge effects is the tune depression factor κ given by
 $${\rm \kappa} = \displaystyle{{\rm \nu} \over {{\rm \nu} _0 }}\comma$$
where ν, and ν0 are, respectively, the actual betatron tune and the tune at zero current. It points out the focusing deficit seen by the beam due to repulsive space-charge forces that counteract imposed external focusing forces. For IFMIF, κ is very low, between 0.4 to 0.6 at the RFQ, and only 0.2 to 0.6 at the SRF Linac.
A way to combat space-charge effects is to apply as much as possible external focusing forces while accelerating particles. That is the role of the RFQ, which has to accelerate particles to high enough energy where energy of space-charge forces become less perceptible, before leaving the beam to more efficient acceleration procedure using separate cavities and focusing elements. That is why, with all other things being equal, for example, frequency or input energy, the RFQ must be longer. It should be even longer if in addition it has to sustain a higher beam power. And the longer it is, the more it is prone to RF instabilities. That is the IFMIF case where the RFQ must accelerate particles to the energy as high as 5 MeV, and is the longest RFQ ever constructed. It is a 175 MHz, four-vane RFQ with a “two-term modulation” field structure, and a maximum surface field of 24.7 MV/m corresponding to 1.76 kilpatrick (Kilpatrick, Reference Kilpatrick1957).
It turns out that the simultaneous combination of the highest intensity, the highest beam power, the highest space charge, and the longest RFQ makes that unprecedented challenges have to be faced, often conflicting between them. In this critical situation, a clear strategy must be defined in the earliest stage of beam dynamics design. And in such uncommon circumstances, some innovative decisions or methods have been adopted.
3. General strategy
The adopted strategy can be globally split into three main directions: identify and solve the issue for low energy sections (E < 5 MeV), for higher energy sections (E > 5 MeV), and for beam diagnostic definitions. For E < 5 MeV, i.e., for the ion source extraction, the LEBT and the RFQ, beam losses are still significant (≈2.5% of the beam), the global aim is to be able to obtain the required 125 mA. At these low energies, the conflicting issue comes from the emittance that can explode due to the strong space charge, while it must be maintained low enough to ensure optimal injection into the RFQ. All the efforts must therefore be dedicated to work around the space-charge effects: (1) Enlarge extraction aperture from ϕ = 9 mm of our SILHI source to ϕ = 12 mm, which is at the limit of the pumping system; (2) Shorten as much as possible the drifts where there is poor space-charge compensation, i.e., the source extraction length by using four instead of five electrodes and the RFQ injection length that is reduced to the mechanical limit; (3) Enhance this compensation in the LEBT by injecting heavy ion gas and installing electron repellers at entrance and exit; (4) Increase extraction field and RFQ focusing field to the limit of electric breakdown.
A crucial point too is to finely calculate, considering all the above ingredients, the final space charge resulting from contradictory effects of D + charges and electrons created by collision on residual gaz. We have used the SolMAxP code (Chancé et al., Reference Chancé, Chauvin and Duperrier2012) to calculate the resulting space charge potential map in the LEBT. It is worth pointing out that it is not uniform, neither in longitudinal nor in transverse (Chauvin et al., Reference Chauvin, Delferrière, Duperrier, Gobin, Nghiem and Uriot2012). This potential map is used for beam transport and matching to the RFQ.
For E > 5 MeV, i.e., for the MEBT, the SRF- Linac and the HEBT, losses can cause harmful material activation and must be maintained much less than 1 W/m. As simultaneously the beam power is in the MW class, the global aim is to maintain losses much less than 10−6 of the beam. We call them “microlosses”. This very limiting constraint is made even more severe by the presence of strong space-charge forces, so that every tuning is distribution dependent. As a result, considerations of RMS beam characteristics are no more sufficient: multiparticle simulations with more than 106 macroparticles are mandatory, which are very time consuming. An uncommon procedure has been adopted then: beam dynamics optimisations aim to optimize the extent of the very external beam border, rather than emittance or beta values. We can speak about “halo matching” rather than “envelope matching”. Each of the macroparticle (over 106) at the external border must be scrutinized and kept as far as possible from the pipe wall.
Concretely, the method consists in tuning the focusing elements, solenoids, and bunching cavities, in order to minimize the outermost border of the beam where the transverse beam size is the biggest, that is at transverse focusing locations. For that, a particle swarm optimization (Kennedy & Eberhart, Reference Kennedy and Eberhart1995) method is used, allowing to explore cases in parallel, reducing calculation duration, and to find out a smaller minimum in this typically non-linear problem with many local minimas. Theoretical simulations demonstrate that the matching procedures described above are delicate to apply because on the one hand they need to be done precisely and on the other hand they depend closely on the initial beam distribution. Therefore, frequent in-situ fine tunings should be expected in real situation, with appropriate diagnostics. That is conflicting with the lack of diagnostics imposed by the compactness necessary for reducing space-charge effects.
A clear strategy must be worked out in order to ensure that nice theoretical results can be really obtained on the machine. First of all, we adopted the rule to only carry out beam dynamics optimizations that can be later applied online. For the LEBT, the focusing setting has been established by searching to maximize the RFQ transition, which can be reproduced online by maximizing the beam current at RFQ exit. The online tuning is furthermore crucial at higher energies because the needed precision of 10−6 or even better is hard to ensure when considering calculation precision or machine reproducibility. The “halo matching” mentioned above can be applied in situ only at the condition that enough micro-loss detectors are available along the SRF-Linac cryomodules, close enough to the beam pipe so that the loss distribution can be known with good enough spatial resolution. For that, neutron detectors by chemical vapor deposition diamond are being evaluated in CEA-Saclay (Marroncle et al., Reference Marroncle, Abbon, Egbert and Pomorski2011). It is important to stress that these detectors, as well as the beam current monitor at RFQ exit should be used daily for fine tuning, and should be considered as “essential” as the classical beam position monitors for example.
This leads us to adopt a strategy for beam measurement consisting in clearly distinguishing between “essential” and “characterisation” beam diagnostics. “Essential” measurements should be permanently and quickly available, for every situation including full power operation. They directly impact on the achievement of accelerator specifications. We can list in this category: beam position, phase, current, losses, and micro-losses. “Characterisation” measurements are needed for beam study or understanding. They could be available only during beam commissioning in case of lack of room, or only at low duty cycle in case of problem with power deposition. We can list in this category: transverse profile, emittance, halo, energy spread, mean energy, bunch length. With this definition of the two different assigned roles for IFMIF, all diagnostics have been able to be designed and positioned.
4. Results
Separate beam dynamics optimizations with the TraceWin code (Duperrier et al., Reference Duperrier, Pichoff and Uriot2002) for individual sections following the strategy described above, have allowed to find out a theoretical design that meet the accelerator specifications. For E < 5 MeV, a shortened electrode configuration (Delferrière et al., Reference Delferrière, De Menezes, Gobin, Harrault and Tuske2008) can extract from the source 140 mA of D +, which has been transported through the LEBT without any loss and injected into the RFQ in optimal conditions (Chauvin et al., Reference Chauvin, Comunian, Delferrière, Duperrier, Gobin, Nghiem and Uriot2009a). In the RFQ, losses have been mainly limited to the low-energy part and the transmitted current is 96%, corresponding to 134 mA (Comunian et al., Reference Comunian, Fagotti, Pisent and Posocco2008). Compared to the required 125 mA, a certain margin is available. For E > 5 MeV, apart some losses of particles not well accelerated before (negligible in terms of intensity or power), there is no more losses nor micro-losses in nominal conditions (Chauvin et al., Reference Chauvin, Duperrier, Mosnier, Nghiem and Uriot2009b; Oliver et al., Reference Oliver, Brañas, Chauvin, Ibarra, Mosnier, Podadera-Aliseda and Uriot2008). Simulations with more than 106 macroparticles for each separate section show that the beam very external border is regular, far enough from the pipe wall. An example is given in Fig. 2 showing the beam density along the most critical part, the four cryomodules of the SRF-Linac. But, as it is shown in Mustapha et al. (Reference Mustapha, Xu, Ostroumov and Carneiro2009), in order to characterize more precisely the particles in the halo, simulations with the real number 5 × 10⁹ particles remain to be done. They are planed for the near future.
(Color online) Beam density along the MEBT and the four cryomodules of the SRF-Linac. The upper black line represents the beam pipe wall.

The beam footprint on the lithium target at the end of the IFMIF accelerators is required to be rectangular and uniform. This is classically realized by the use of multipolar magnetic lenses in order to fold the external tail of the beam toward internal parts. Due to the large beam halo in our case, octupole and dodecapole magnets must be employed simultaneously to bend differently two different parts of the beam halo. First order optimizations have been performed with the BETA code (Zimmermann et al., Reference Zimmermann, Basset, Bellodi, Benedetto, Dorda, Giovannozzi, Papaphilippou, Pieloni, Ruggiero, Rumolo, Schmidt, Todesco, Zotter, Payet, Bartolini, Farvacque, Sen, Chin, Ohmi, Oide, Furman, Qiang, Sabbi, Seidt, Vay, Friedman, Grote, Cousineau, Danilov, Holmes, Shishlo, Kim, Cai, Pivi, Kaltchev, Abell, Katsouleas, Boine-Frankenheim, Franchetti, Hofmann, Machida and Wei2006), following by feasibility studies with TraceWin multiparticle optimizations (Duperrier et al., Reference Duperrier, Payet and Uriot2004), which are then confirmed with the beam accelerated by the present SRF-linac. The obtained beam characteristics are illustrated in Fig. 3 showing the beam density in different phase spaces. Halo folding can be seen in (x, x′) and (y, y′) spaces. The final rms energy dispersion is 5 × 10⁻³. Transverse beam uniformity can be judged in (x, y) space with the projected density profiles on x and y. As 10 MW beam power will be concentrated in this 20 × 5 cm footprint, detailed error and jitter studies remain to be done. Further investigations have also to be initiated in order to define strategies of beam measurement and tuning to ensure the achievement of a stable uniform beam footprint.
(Color online) Beam density on the lithium target, in different phase spaces. The density profile projected on every axis is also shown.

5. Start-to-end studies for LIPAc
In waiting for the final decision of IFMIF, the prototype accelerator LIPAc is under fabrication and will be progressively installed in Rokkasho (Japan). Start-to-end simulations of LIPAc with 106 macroparticles have been thoroughly carried out. This section will concentrate on this subject. For the sake of realism, the used input beam results from calculations of the ECR source extraction system with the AXCEL code (Spädtke, Reference Spädtke2008), and most of the elements of the accelerators are represented by their field map calculated by finite element methods. Fig. 4 shows the normalized beam density together with the pipe wall along the accelerator. The beam pipe radius is six times the beam rms size, while the total beam size is close to three beam rms. Results of losses obtained above for separate sections are confirmed. Losses occur in the first part of the RFQ and the first part of the MEBT where scrapers have been installed to collect them. The corresponding power lost is, respectively, some tens of W and 3 W as shown in Fig. 5. Corresponding losses in terms of beam current are shown in the same figure. They all come from particles not correctly bunched and accelerated by the accelerating structures, which are the RFQ and the SRF-Linac. The beam emittance at the source extraction, at the end of the LEBT, after the RFQ and after the SRF linac is respectively: 0.06, 0.17, 0.22, and 0.36 π mm.mrad.
(Color online) Beam density along LIPAc (without error).

(Color online) Power and Intensity lost along LIPAc (without error).

Start-to-end simulations with errors (Chauvin et al., Reference Chauvin, Nghiem, Comunian, Delferrière, Duperrier, Monsier, Oliver and Uriot2011) have been first performed with the static and dynamic tolerances found out when studying separately each subsystem. Let's precise that static errors are “slow” ones that will be corrected online and dynamic errors are “fast” ones like jitters or vibrations that will not be corrected (unless by mean of a feedback procedure). That is why dynamic tolerances should be much severe than static ones. In our case, static tolerances have been defined according to the strategy defined in (Nghiem et al., Reference Nghiem, Chauvin, Comunian, Delferrière, Duperrier, Mosnier, Oliver and Uriot2011b), while dynamic tolerances are set to 1/10 of the static ones, unless important problems are detected. It can be foreseen that: (1) As static tolerances are corrected locally as to they appear, their effects should not be very different between local and start-to-end simulations. Unless important residual effect cumulation, those tolerances may be kept unchanged after start-to-end simulations. (2) As dynamic tolerances are assumed uncorrected, a cumulation effect can appear when transporting the beam from a section to another one. Those tolerances may be revised after start-to-end simulations.
In our case, the accumulation of uncorrected alignment errors is observed to be critical for the final beam position on the beam dump. This leads to a revision of tolerance in vibration errors to 1/100 of static alignment errors. This is in total accordance with what is already observed when studying separately the HEBT (Oliver et al., Reference Oliver, Brañas, Ibarra, Nghiem and Mosnier2010).
This behavior is typical of accelerators where the beam size is much larger in a given location than in the remaining parts. It is the case of LIPAc where the beam size on the beam dump is more than 10 times larger than elsewhere along the accelerator. Indeed, beam optics, i.e., the succession of focusing elements, makes that trajectory displacements, as they are subject to the same focusing elements, will follow the same evolution as beam size. Trajectory displacements will be therefore more than 10 times bigger at the beam dump than elsewhere. That is why, vibrations inducing trajectory displacements of a few mm upstream, which is totally acceptable, will induce a few cm beam center displacement on the beam dump, which is not acceptable.
Finally, the following errors (=tolerances) have been adopted (see Table 1): (1) Static errors (“slow” errors that can be corrected on line) as given in Table 1. The errors are considered as randomly distributed in a uniform distribution within the values given in this table. (2) Dynamics errors (“fast” errors that cannot be corrected, unless by a fast feedback system) including field and gradient errors (jitters) of 1/10 of the static ones, and alignment errors (vibrations) of 1/100 of the static ones, i.e., in the µm range.
Static error ranges applied to beam input and magnetic, electric elements.

One can notice that field and gradient errors of 1% (except for the dipole where it is 0.1%) are introduced to point out the weak sensitivity to these errors. On a tuned machine, this kind of errors will actually be well lower.
Start-to-end simulations have also been carried out by tracking 106 macroparticles along 500 machines with different random sets of errors (Chauvin. et al., Reference Chauvin, Nghiem, Comunian, Delferrière, Duperrier, Monsier, Oliver and Uriot2011). Fig. 6 (Top) gives the particle density along the accelerator cumulated over the 500 machines with errors. The losses obviously exceed those seen in Fig. 4 (case without error). In order to have a more precise idea on the importance of these losses, we can look at Fig. 6 (Bottom) showing the maximum beam radius for different percentages of error cases. We can see that losses occur at many locations in 0.2% of cases (1 over the 500 studied machines), and are worrisome in 1% of cases. In 5% of cases, there are additional losses at the dipole. But Fig. 7 giving the power and intensity lost is rather reassuring. In the worst case, losses in the RFQ are twice more than in the no-error case, and are everywhere else less than 2 watts. Except near the very end, at the location of the fixed scraper destined to protect the beam dump surroundings, where losses go up to 5 W in 1 case over 500. The intensity lost remains to be only noticeable at the RFQ first part, its exit and at the MEBT scraper. At these locations, many particles are lost but they are all low in energy.
(Color online) Top: Beam density along LIPAc cumulated on 500 machines with different errors. Bottom: Statistics of Maximum beam radius.

(Color online) Power and intensity lost along LIPAc for different percentages of error cases (total: 500 cases).

Notice that trajectory deviations is already corrected in all the simulations with errors. It is worth describing now the foreseen trajectory correction system. In the LEBT, steerers are located within the two solenoids, and their setting is obtained by maximizing the RFQ transmission. In the remaining accelerator, trajectory correction is based on a one-to-one correction scheme with steerers and BPMs. For the MEBT and HEBT, the principle is to correct perfectly the trajectory in the long sections between focusing quadrupole groups but not within these groups. For this purpose, two BPMs are located at the two ends of the long straights, and two correctors in the quadrupoles on the two sides of a group. In the SRF-linac, there is one H-V steerer in every solenoid and one BPM in every straight. Due to lack of space all the steerers have to be put inside the focusing elements, quadrupoles and solenoids. The advantage is also a more efficient correction, as the correctors are located exactly at the same position as that of the trajectory error causes. The drawback is the induced sextupole component in the quadrupoles, but we have verified that in our case of very short structure, their effect on the beam is totally negligible.
Fig. 8 gives the rms residual trajectory deviation after correction along LIPAc, maximum and rms values, for the considered 500 machines with errors. In the first accelerator part, due to the correction method consisting in maximizing the RFQ transmission, the central trajectory is perfectly corrected through the RFQ. In the second part, the non-zero residual trajectory is uniquely due to BPM readings, as steerers are exactly located at the error locations themselves. The uncorrected part due to dynamic errors progressively increase in the HEBT line to become much more important at the beam dump entrance while remaining less than 10 mm, in the acceptance of the beam dump.
(Color online) Residual trajectory deviation in x and y (respectively red and blue), in maximum and RMS values (respectively upper and lower curves) for 500 error sets.

6. Emittance vs Halo
The strategy explained above has allowed to find out design solutions for the very challenging specifications of the IFMIF accelerators. It relies mainly on optimizations of particle trajectories themselves instead of rms beam quantities. The emphasis is especially put on the particles in the halo part rather than the in the core part, on micro-losses rather than on emittance. But during these optimizations, it is often observed very strong emittance growths or even emittance blowups, so that some care about emittance behavior has also been allocated. It is therefore important to study in more details the possible causes of emittance growth and see in which extent it can be avoided. Let us focus on the sections just at the RFQ exit, namely the MEBT and the four cryomodules of the SRF-Linac, where most emittance growths occur, and where various tuning possibilities exist. It has been demonstrated in Nghiem et al. (Reference Nghiem, Chauvin, Comunian, Delferrière, Duperrier, Mosnier, Oliver, Simeoni and Uriot2010) that successive horizontal and vertical emittance increases in the MEBT are clearly due to the classical charge redistribution mechanism (Wangler, Reference Wangler2008). Whenever the space charge term is larger than the emittance term in a given plane, the emittance growths in this plane, due to the space charge dominated behavior. Then the beam profile becomes more compact to shield the beam from the external focusing field. An equilibrium state is reached, the beam becomes emittance dominated and the emittance growth is stopped. The characteristic time of such a mechanism is a quarter of the plasma oscillating time. That is why it is known as the fastest emittance growth mechanism. It occurs typically when the beam leaves a strong focusing section to a much less strong focusing one. In our case, it is the case when leaving the RFQ to the MEBT, and when crossing the long drift before entering the focusing sections of the first cryomodule. This demonstrates the needs, for high-intensity accelerators, of compactness in order to minimize lengths without focusing and of long RFQ in order to accelerate the beam to higher energy for reducing space charge effects. As the charge redistribution mechanism is very fast and is inherent in the structure that has been made the most compact possible regarding mechanical considerations, no possible tuning can remedy the emittance growth problem in the MEBT. The reasons of emittance growth remain however to be studied in the SRF-Linac where the above mechanism is not at all observed. Space charge coupling between transverse and longitudinal betatron oscillations should rather be invoked (Simeoni Jr et al., Reference Simeoni, Nghiem, Uriot, Chauvin and Mosnier2011). Indeed, specific eigenmodes with nonlinear space charge coupling forces may grow exponentially in the vicinity of given resonance conditions (Hofmann et al., Reference Hofmann, Franchetti, Boine-Frankenheim, Qiang and Ryne2003). To estimate the importance of this effect, the tune footprint along the four cryomodules of the SRF-Linac has been plotted on the Hofmann chart for the emittance ratio εz/εx = 1.5 (Fig. 9) in the case of a “typical” tuning obtained by the strategy described in Section 3. “Typical” tuning means here the tuning we will adopted as the nominal one. This chart represents the tune depression versus the ratio of vertical to horizontal tune at full current. The characteristic regions of the chart indicate where the collective space charge density oscillations are expected to cause emittance transfer and growth. It is noteworthy that the unstable regions of these modes merge into the single-particle resonance conditions of difference resonances: νz − 2νx ≈ 0 and 2νz − νx ≈ 0 for the third order even and odd modes; 2νz − 2νx ≈ 0 and νz − 3νx ≈ 0, as well as 3νz − νx ≈ 0, for the fourth order even and odd modes. Note that an important peak is associated with the fourth-order coupling resonance 2νz − 2νx ≈ 0. In this chart, the tune footprint of the SRF-Linac spreads over a large range of νz/νx and intercepts the cited resonances. A part of the tune footprint also overlaps with the region where resonances form a continuum (tune depression below 0.3), which Hofmann called the “sea of instability”. This shows once more the very strong space charge regime of the IFMIF beam. All this suggests that coupling modes have been excited, leading to emittance transfer between transverse and longitudinal planes, a space-charge non-linear mechanism that finally induces global emittance growth. To check this, let us look at the variations of emittance and of the ratios νz/νx, εz/εx along the structure (Fig. 10). Each time the first ratio comes close to 1 (resonance 2νz − 2νx ≈ 0), the second ratio increases, indicating there is horizontal emittance transfer to longitudinal one. At the same locations, we can see in the emittance curves that longitudinal emittance increases while horizontal one decreases, with however a global increase of both. The changes in longitudinal emittance are more pronounced than those in transverse ones, since there is one “hot” plane, the longitudinal one, which is fed by the two “cold” transverse planes. To go further in the understanding of this mode coupling mechanism, another tuning is explored where the tune footprint no longer crosses the 2νz − 2νx ≈ 0 resonance (Fig. 11). As a consequence, the ratio νz/νx is now further from 1, and the ratio εz/εx has smaller oscillations, indicating less emittance transfer (Fig. 12). And the global emittance growth in both planes is less important. This clearly demonstrates the important role of the coupling resonance 2νz − 2νx ≈ 0 in the mechanism of emittance exchange and growth. Such a mechanism is well known in long and periodic structures, where it is understandable that enough long term betatron oscillations can excite mode coupling resonances. In our case, the structure is not strictly periodic and is in addition very short. In total, there is roughly one betatron oscillation and a half only through the four cryomodules. A fast effect of this mode coupling remains to be further clarified. The same for the effects of the other resonances that do not seem to be very clear in our case. Another result is that the beam external halo is bigger when compared to the ‘typical’ tuning (Figs. 13 and 14). The most external particles are closer to the beam pipe wall. This “explored” tuning proves that obtaining a smaller emittance is possible, and shows the way how to achieve such a result. But it suffers yet from two faults: some required solenoid and cavity fields are so high that they are not feasible, and the beam external halo is bigger. Although emittance is not a critical parameter in our case, further optimisations are worthwhile to see if a feasible tuning exists with minimum halo and a smaller final emittance.
(Color online) Tune footprint along the four cryomodules superimposed to the Hofmann chart (“typical” tuning).

(Color online) From top to bottom, tune ratio at full current, emittance ratio and emittance along the four cryomodules (“typical” tuning).

(Color online) Tune footprint along the four cryomodules superimposed to the Hoffman chart (“explored” tuning).

(Color online) From top to bottom, tune ratio at full current, emittance ratio and emittance along the four cryomodules (“explored” tuning).

(Color online) Beam density along the four cryomodules of the SRF-Linac (“typical” tuning).

(Color online) Beam density along the four cryomodules of the SRF-Linac (“explored” tuning).

7. Conclusion
In the study of very high-intensity IFMIF accelerators, new concepts have emerged like micro-losses, halo matching, essential diagnostics. Every beam dynamics optimization are carried out so that they can be reproduced online, in order to enhance the chance to obtain real performances as theoretically expected. IFMIF, with its record beam intensity, beam power, space-charge regime, and RFQ length, provides a tremendous opportunity for studying high intensity beam physics in its most extreme limit. Two different emittance growth mechanisms induced by strong space charge have been pointed out: charge redistribution and transverse-longitudinal betatron coupling. The latter exhibits a very fast growth time given that one of its resonances can be seen with our very short semi-periodic structures. Our studies show that there is a conflict between emittance and halo minimisations. A drastic reduction of the total extent of the halo often leads to an emittance blowup while an emittance minimisation by avoiding the coupling resonance leads to an important increase of the external halo. In our case, in order to avoid microlosses, the priority is put on halo minimisation but keeping a reasonable emittance growth.



