Implications
The estimation of genetic parameters is the first and essential step to select for coagulation traits and cheese yield in dairy sheep. The aim of this paper is to fill a gap in comparison with what happens in dairy cattle; indeed heritability estimates for clotting properties are missing for small ruminants. As the sheep milk is almost totally destined for cheese making, the estimation of heritability of coagulation traits may enable future scenarios of selection for such traits, with potential implications on selection schemes and milk payment tables.
Introduction
The Italian dairy sheep stock consists of about 5.5 million ewes. The largest breed is the Sarda with more than three million sheep (Banca Dati Nazionale dell'anagrafe zootecnica - BDN, 2015). The Sarda breed accounts for about 43% of the national total ovine stock and about 4% of EU sheep stock (Eurostat, 2015). The total milk production of the Sarda is about 300 000 tonnes of milk/year (about 4% of total world production, Food and Agriculture Organization of the United Nation Statistics Division, 2014). The breeding programme currently involves a breeding nucleus of 212 941 milk recorded sheep farmed in 1032 flocks and the commercial population (International Committee for Animal Recording, Reference Ikonen, Ahlfors, Kempe, Ojala and Ruottinen2014). Since the beginning of the programme, the total milk yield (MY) per lactation has been the main selective goal of Sarda sheep (Sanna et al., Reference Sanna, Carta and Casu1997; Carta et al., Reference Carta, Casu and Salaris2009). Recording for fat percentage (FP) and protein percentage (PP) on first lambing ewes started in 1998. The milk is totally transformed into cheese with a production of 50 to 60 000 tonnes/year of three Protected Designation of Origin products, mostly destined for export (Furesi et al., Reference Furesi, Madau and Pulina2013). Thus, the milk cheese-making ability could be a breeding goal of great interest for this breed.
Pecorino Romano cheese yield could be predicted from bulk milk composition using suitable equations (Pirisi et al., Reference Pirisi, Piredda and Carta1994). However, predictions on individual milk are less accurate due to the variability of milk solids, thus individual laboratory cheese yield (ILCY) has been proposed as an indicator of potential cheese yield in individual ovine milk samples (Othmane et al., Reference Othmane, De La Fuente, Carriedo and San Primitivo2002). ILCY shows low heritability and a positive genetic correlation with milk composition and negative genetic correlation with MY in Spanish Churra sheep (Othmane et al., Reference Othmane, De La Fuente, Carriedo and San Primitivo2002).
Other indicators of milk cheese-making ability, extensively studied in cattle, are milk coagulation properties (MCPs) (Aleandri et al., Reference Aleandri, Schneider and Buttazzoni1989; Ikonen et al., Reference Ikonen, Morri, Tyriseva, Ruottinen and Ojala1999; De Marchi et al., Reference De Marchi, Bittante, Dal Zotto, Dalvit and Cassandro2008; Bonfatti et al., Reference Bonfatti, Tuzzato, Chiarot and Carnier2014). They are usually defined by three parameters: rennet coagulation time (RCT, min), curd-firming time (k 20, min) and curd firmness (a 30, mm), commonly measured by using either mechanical or optical devices (Bittante et al., Reference Bittante, Penasa and Cecchinato2012). Several studies have reported that an appreciable proportion of the MCPs variation in cow milk is of additive genetic nature. A recent review by Bittante et al. (Reference Bittante, Penasa and Cecchinato2012) reported moderate values of heritability (about 0.26) for RCT and a 30, whereas few study report reliable estimates for k 20. In general, MCPs exhibit moderate to high genetic correlations with pH and somatic cell count (SCC), and very low to null genetic correlations with milk traits, respectively (Bittante et al., Reference Bittante, Penasa and Cecchinato2012).
Few studies have been carried out on MCPs in small ruminants, especially in sheep. In particular, effects of environmental factors, feeding, breed, parity and lactation stage on MCPs, milk composition and ILCY have been investigated (Jaramillo et al., Reference Jaramillo, Zamora, Guamis, Rodriguez and Trujillo2008; Bittante et al., Reference Bittante, Pellattiero, Malchiodi, Cipolat-Gotet, Pazzola, Vacca, Schiavon and Cecchinato2014; Pazzola et al., Reference Pazzola, Dettori, Cipolat-Gotet, Cecchinato, Bittante and Vacca2014). In some research, novel milk coagulation and synaeresis parameters, estimated by a non-linear modelling of the entire curd-firming process, were used (Vacca et al., Reference Vacca, Pazzola, Dettori, Pira, Malchiodi, Cipolat-Gotet, Cecchinato and Bittante2015). Finally, relationships between MCPs and sanitary status of the mammary gland were also investigated in sheep (Rovai et al., Reference Rovai, Natalia, Gerardo, Jordi and Gabriel2015). Analysis of environmental factors affecting MCPs and ILCY and the estimation of their genetic parameters are essential steps for planning their improvement by means of selection. The aim of this study was to estimate heritability of MCPs, ILCY, and their phenotypic and genetic correlations with MY and composition in Sarda dairy ewes.
Material and methods
Animals, milk sample collection and laboratory analysis
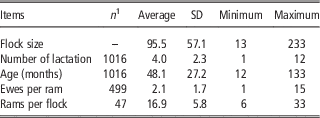
The study involved 1018 Sarda ewes from 47 flocks located in the four historical provinces of Sardinia. Pedigree and milk recording information were supplied by the National Association of Small Ruminant Breeders (Rome, Italy). The pedigree file included more than 1.8 million animal records. Dairy ewes were offspring of 499 rams; other details about the structure of the population are given in Table 1. Individual milk samples (100 ml) were collected in the mid–late lactation (from 45 to 249 days in milk (DIM), average=156±37.4 days) from April to July 2014 by the Provincial Association of Breeders (APA). Preservatives (bronopol, 62.5 μl/100 ml) were added to the milk samples. Analyses were carried out within the 24 h after sampling and the milk samples were kept refrigerated during transportation from the farms to the laboratory.
Descriptive statistics for animal and flock structure of Sarda population involved in this study

1 For the number of lactation and age, n is the number of records; for the last two items, n is the number of rams and flocks, respectively.
The milk samples were split into two subsamples of 50 ml each and analysed in order to determine composition and cheese-making attitude of milk, respectively. Standard milk analyses were performed at the milk lab of the Regional Association of Animal Breeds of Sardinia (Oristano, Italy). Milk composition was spectroscopically determined by MilkoScanTM (Foss Electric, Hillerød, Denmark). SCC was also determined using the FossomaticTM (Foss Electric). MCPs were measured by using a Formagraph instrument (Foss Electric A/S, Hillerød, Denmark). In brief, 10 ml of each individual sample were heated to 35°C before the addition of 200 µl of rennet solution (Hansen Naturen 215, with 80%±5% and chymosin 20%±5% pepsin; Pacovis Amrein AG, Bern, Switzerland) diluted to 0.8% in distilled water. This analysis ended within 30 min after rennet addition and produced a lactodinamographic path as reported by Bittante et al. (Reference Bittante, Penasa and Cecchinato2012). RCT is the time between rennet addition and the start of the milk coagulation, k 20 the time at which the typical oscillation graph reaches the width of 20 mm and a 30 the width of the graph at 30 min after rennet addition. ILCY was determined according to a modified method of Othmane et al. (Reference Othmane, De La Fuente, Carriedo and San Primitivo2002), further details of the methodology used are provided in Manca et al. (Reference Martini, Mele, Scolozzi and Salari2016). The predicted Pecorino cheese yield (PPCY) was also calculated using the equation proposed by Pirisi et al. (Reference Pirisi, Piredda and Carta1994): PPCY=1.747×protein%+1.272×fat%.
Statistical analysis
In all, 13 traits were analysed: RCT, k 20, a 30, ILCY, PPCY, MY, FP, PP, casein percentage (CSN), CLA percentage, pH, NaCl and somatic cell score (SCS). Non-coagulating samples were eliminated, as well as the missing records for the other traits. As the k 20 parameter presented a skewed distribution, a log-transformation was also applied on this trait. (Co)variance components were estimated by using restricted maximum likelihood methodology implemented in VCE v. 6.0 software (Groeneveld et al., Reference Groeneveld, Kovac and Mielenz2010). Both a single- (ST) and multiple-trait (MT) animal models were fitted. The raw data included 1018 animals with phenotypes. Ancestors were extracted from the pedigree file considering up to the fourth previous generation. A total of 5234 animals were included in the numerator relationship matrix (A). ST and MT analysis were carried out on MCPs using the following linear mixed model:
 $$\eqalignno{ y_{{ijklmno}} \,{\equals}\,\mu &{\plus}PAR_{j} {\plus}LM_{k} {\plus}DIM_{l} {\plus}RP_{m} \cr&{\plus}ftd_{n} {\plus}a_{o} {\plus}e_{{ijklmno}} $$
In the ST model, for each trait y
ijklmno
is a single measure for the ith individual; μ the overall mean; PAR the fixed effect of jth parity with six levels (j=1 to 5 and PAR⩾6); LM the fixed effect of kth lambing month with six levels (k=October to March); DIM the fixed effect lth class of days in milk with six levels (l=1: 45 to 80 days, l=2: 81 to 120 days, l=3: 121 to 150 days, l=4: 151 to 180 days, l=5: 181 to 210 days, l=6: >210 days); RP the fixed effect of the mth position of the milk samples in the rack of Formagraph (m=1 to 10); ftd the cross-classified random effect of the nth combination flock-test date (n=1 to 70 levels) with
 $ftd_{n} \,\sim\!\!N(0,{\bf I}\sigma _{{{\rm ftd}}}^{2} )$
, where I and
 $\sigma _{{{\rm ftd}}}^{2} $
are the identity matrix and the variance associated with flock-test date, respectively; a
o
the random genetic effect for the oth animal (o=1 to 5234 levels) with
 $a_{o} \,\sim\!\!N(0,{\bf A}\sigma _{a}^{2} )$
and e
ijklmno
the random residual term with
 $e_{{ijklmno}} \,\sim\!\!N(0,{\bf I}\sigma _{e}^{2} )$
, where
 $\sigma _{a}^{2} $
and
 $\sigma _{e}^{2} $
are the additive genetic and residual variance, respectively. Genetic parameters of ILCY, MY and composition traits were estimated with a mixed linear model that had the same structure of equation (1), but that did not include the effect of the rack position.
In the MT animal model y
i
represented the vector of dependent variables for the ith individual, whereas the fixed and random effects were the same as equation (1). Two different MT analyses were carried out: (i) a five-trait animal model, including three MCPs, ILCY and PPCY, that was aimed at estimating genetic correlations among coagulation properties and cheese yields; (ii) a series of bivariate analyses for ILCY and each of the MCPs with all the remaining variables was performed to evaluate the genetic correlations among above-mentioned properties and MY and composition. For both MT animal models the (co)variances for random effects were assumed to follow a multivariate normal distribution and they were modelled as follows:
 $$[\matrix{ {{\bf a}_{1} } \,\ldots\, {{\bf a}_{n} } ]'\,\sim\!N(0,{\bf A}\,\otimes\,{\bf G})$$
,
 $\left[ {\matrix{ {{\bf ftd}_{{\rm 1}} } \,\ldots\, {{\bf ftd}_{n} } } } \right]^{\prime} \sim\!N(0,{\bf I}\,\otimes\,{\bf F})$
and
 $\left[ {\matrix{ {{\bf e}_{1} } \,\ldots\, {{\bf e}_{n} } \cr } } \right]^{\prime} N(0,{\bf I}\,\otimes\,{\bf R})$
, where A and I have previously been defined; n was the number of traits analysed; G, F and R the n×n genetic additive, flock-test date and residual covariance matrices, respectively (the element
 $$\sigma _{{i,j(i\,{\equals}\,j)}}^{2} $$
in the diagonal are the variance and the off-diagonal σ
i,j(i≠j) covariance between trait i and trait j). For each trait, both for ST and MT analyses, heritability was computed as
 $h^{2} {\equals}{{\sigma _{a}^{2} } \over {\sigma _{a}^{2} {\plus}\sigma _{{{\rm ftd}}}^{2} {\plus}\sigma _{e}^{2} }}$
. Moreover, phenotypic and genetic correlations among MCPs and all the other traits have been computed.
Results
Descriptive statistics
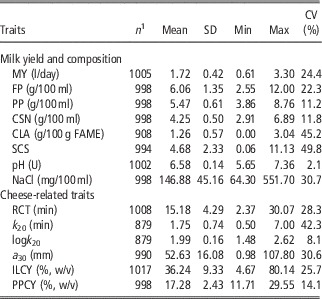
FP, PP and CSN (Table 2) were similar to those observed in individual data either in Sarda (Pazzola et al., Reference Pazzola, Dettori, Cipolat-Gotet, Cecchinato, Bittante and Vacca2014; Manca et al., Reference Martini, Mele, Scolozzi and Salari2016) or in other Italian breeds such as Valle del Belice (Cappio-Borlino et al., Reference CappioBorlino, Portolano, Todaro, Macciotta, Giaccone and Pulina1997), Massese (Martini et al., Reference Manca, Serdino, Gaspa, Urgeghe, Ibba, Contu, Fresi and Macciotta2008) and Alpine breeds (Bittante et al., Reference Bittante, Pellattiero, Malchiodi, Cipolat-Gotet, Pazzola, Vacca, Schiavon and Cecchinato2014). Milk solids were lower than those reported for Spanish breeds (Othmane et al., Reference Othmane, De La Fuente, Carriedo and San Primitivo2002; Jaramillo et al., Reference Jaramillo, Zamora, Guamis, Rodriguez and Trujillo2008). The average values of the test-day records for CLA (1.26±0.57) was lower than values reported for Sarda and Massese breeds (Nudda et al., Reference Nudda, McGuire, Battacone and Pulina2005; Martini et al., Reference Manca, Serdino, Gaspa, Urgeghe, Ibba, Contu, Fresi and Macciotta2008). The pH exhibited the smallest variability, whereas SCC varied according to the breed average (Pazzola et al., Reference Pazzola, Dettori, Cipolat-Gotet, Cecchinato, Bittante and Vacca2014).
Number of records, overall mean, SD, minimum (min), maximum (max) and CV for sheep milk yield and composition, milk coagulation properties and individual laboratory cheese yield

MY=test day milk yield; FP=fat percentage; PP=protein percentage; CSN=casein percentage; FAME=fatty acid methyl esters; SCS=somatic cell score, log2[(SCC μl−1/100)+3]; SCC=somatic cell count; U=pH unit; RCT=rennet coagulation time; k 20=curd-firming time; logk 20=log10 of curd-firming time (s); a 30=curd firmness; ILCY=individual laboratory cheese yield; PPCY=predicted Pecorino cheese yield.
1 Number of samples used to compute descriptive statistics.
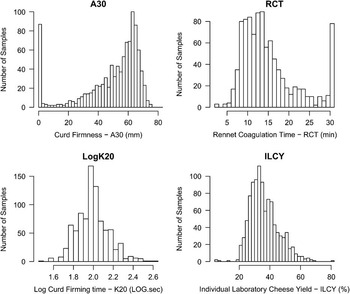
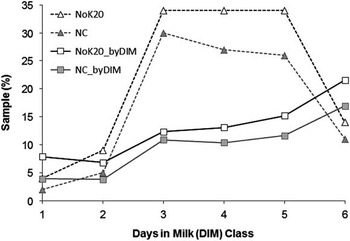
About 6% (n=64) of the samples did not coagulate within 30 min (NC samples hereafter), and at the same time they did not present any values for a 30 and k 20. The samples with RCT>29 min and a 30<1 mm, about 9% (n=90) and 10% (n=101), respectively, were discarded. In addition, 129 samples (about 13%) that did not reach a curd firmness of 20 mm were excluded from the analysis (Figure 1). The percentage of NC samples within each DIM class tended to increase along the lactation. However, when the NC samples are referred to the total number of samples, largest values were observed in the central DIM classes. The same trend is observed for the percentage of missing k 20 records (Figure 2).
Frequency distribution of the three milk coagulation properties and the individual laboratory cheese yield (ILCY) in Sarda sheep for the raw data (before data editing). The very first bar (curd firmness, a 30) and the last two bars (rennet coagulation time, RCT) represent those samples that have been discarded from the analysis.

Percentage of not coagulating (NC) or missing k 20 samples (NoK20), percentage of NC samples (NC_byDIM) and missing k 20 (NoK20_byDIM) within each class of days in milk (DIM).

The a 30 and k 20 parameters presented more skewed distributions compared with RCT and ILCY (Figure 1). The average values for RCT were lower than those reported by Pazzola et al. (Reference Pazzola, Dettori, Cipolat-Gotet, Cecchinato, Bittante and Vacca2014) and Vacca et al. (Reference Vacca, Pazzola, Dettori, Pira, Malchiodi, Cipolat-Gotet, Cecchinato and Bittante2015), whereas k 20 and a 30 varied accordingly to the values reported in the literature for dairy sheep (Table 2). Average ILCY measured in the present study was 36.2%±9.3%, whereas predicted cheese yield using the equation was equal to 17.3%±2.4% (Table 2).
A not negligible fraction of the phenotypic variance can be ascribed to the differences between flocks. The flock-test-date effect explained a quota of phenotypic variation ranging from 13% to 33% for the three milk coagulation parameters and cheese yield (Table 3). The largest percentage of variance explained by flock-test date was recorded for MY (55%), followed by FP (47%), pH (30%), PP and CSN (20%). Moreover, for the last two traits the flock variance matched those of MCPs.
Estimates of genetic
 $\left( {\sigma _{a}^{2} } \right)$
and environmental variance
 $\left( {\sigma _{{{\rm ftd}}}^{2} ,\,\sigma _{e}^{2} } \right)$
, heritability (h
2) and percentage of variance explained by flock-test date (
 $r_{{{\rm ftd}}}^{2} $
) and SE for sheep milk coagulation properties, individual cheese yield, milk production and composition traits

RCT=rennet coagulation time; logk 20=log10 of curd-firming time (k 20); a 30=curd firmness; ILCY=individual laboratory cheese yield; PPCY=predicted Pecorino cheese yield; MY=test day milk yield; FP=fat percentage; PP=protein percentage; CSN=casein percentage; FAME=fatty acid methyl esters; SCS=somatic cell score log2[(SCC μl−1/100)+3]; SCC=somatic cell count; U=pH unit.
1 Number of samples used to estimate variance components.
Heritability, phenotypic and genetic correlations of coagulation traits
Heritability estimates (Table 3) were moderate for RCT (h 2=0.23) and lower for a 30 and k 20 (h 2=0.15). The estimate for ILCY (h 2=0.16) was as twice as the values obtained by Othmane et al. (Reference Othmane, De La Fuente, Carriedo and San Primitivo2002). The heritability of PPCY was of the same magnitude of ILCY. Values for the other milk traits ranged from 0.03 (SCS) to 0.28 (NaCl content). Intermediate values were observed for MY percentage (0.08), FP (0.10), PP (0.13) and CSN (0.15) (Table 3).
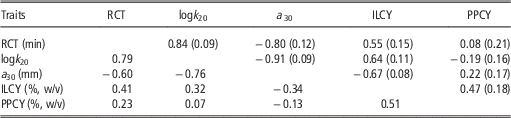
Moderate to high phenotypic correlations were observed among coagulation traits (Table 4). The curd firmness at 30 min showed a negative correlation with RCT and k 20. Conversely, k 20 was positively associated with RCT (r P=0.84). ILCY and PPCY presented moderate to low positive correlations with RCT-k 20 and negative with a 30, respectively. Genetic correlations between MCPs were large and negative, those involving a 30 positive (between RCT and k 20), respectively. The largest value was for the correlation between k 20 and a 30 (r A=−0.91). Genetic correlations for a 30 and RCT are in the range of variability of MCPs, as recently reviewed by Bittante et al. (Reference Bittante, Penasa and Cecchinato2012). Unexpected results were the negative genetic correlation between ILCY and a 30 as well as the positive correlations between ILCY, RCT (r A=0.55) and k 20 (r A=0.64). Conversely, PPCY was positively associated with a 30 (r A=0.22) and negatively with k 20 (r A=−0.19), even if the magnitude of these estimates were lower than those involving ILCY and with larger standard errors. PPCY and ILCY were moderately associated (r A=0.47). Heritabilities of MCPs and ILCY estimated by the MT animal model were very close to those obtained with the ST model, with lower standard errors though (data not shown).
Phenotypic correlations (below the diagonal) and genetic correlations (above the diagonal) between sheep milk traits and milk coagulation properties estimated with a five-trait animal model

RCT=rennet coagulation time; Logk 20=log10 of curd-firming time (k 20); a 30=curd firmness; ILCY=individual laboratory cheese yield; PPCY=predicted Pecorino cheese yield.
SE in brackets.
Phenotypic and genetic correlations between milk coagulation and milk quality traits
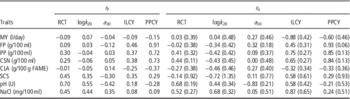
Phenotypic correlations among the three MCPs and milk traits were negligible apart from those involving SCS, pH and NaCl (Table 5). In particular, pH was negatively and moderately correlated with a 30 (r P=−0.42) and positively and strongly with RCT, respectively. NaCl and SCS were moderately correlated with three MCPs. Moreover, RCT only was weakly associated with PP and CSN. Phenotypic correlation of ILCY (PPCY) with FP and PP were r P=0.46 (r P=0.91) and r P=0.37 (r P=0.72), respectively.
Phenotypic (r P) and genetic correlations (r G) among coagulation traits analysed with bivariate animal model in combination with sheep milk yield and composition

RCT=rennet coagulation time; Logk 20=log10 of curd-firming time (k 20); a 30=curd firmness; ILCY=individual laboratory cheese yield; PPCY=predicted Pecorino cheese yield; MY=test day milk yield; FP=test-day fat percentage; PP=test-day protein percentage; CSN=test-day casein percentage; FAME=fatty acid methyl esters; SCS=somatic cell score log2[(SCC μl−1/100)+3]; SCC=somatic cell count; U=pH unit.
The majority of the genetic correlations among MCPs and milk production and composition variables were close to 0 (MY, FP with RCT) or presented very large standard errors (FP, PP, CSN, SCS with a 30). Of interest are those between pH and RCT (r A=0.68) and pH and a 30 (r A=−0.83). RCT was also moderately correlated with casein (r A=0.44), but unexpectedly close to zero genetic association (with large standard errors though) were found among protein and casein and a 30. Moreover, both RCT and k 20 showed a positive genetic association with NaCl, whereas no reliable associations were found with functional compound like CLA. As expected, ILCY was positively correlated with milk composition (FP, PP and CSN) and negatively correlated with MY. High trivial genetic correlation were observed among fat, protein and casein and PPCY, and although of reduced magnitude when compared with ILCY, a negative correlation between PPCY and MY was observed.
Discussion
In general, studies on milk rheological properties are characterised by a relevant variability of results. Moreover, several variables affecting clotting properties have been identified so far (Bittante et al., Reference Bittante, Penasa and Cecchinato2012). In the present study, some milk samples did not coagulate within the reference time of 30 min. The percentage of NC milks was larger than in previous studies on Sarda and Alpine breeds (Bittante et al., Reference Bittante, Pellattiero, Malchiodi, Cipolat-Gotet, Pazzola, Vacca, Schiavon and Cecchinato2014; Pazzola et al., Reference Pazzola, Dettori, Cipolat-Gotet, Cecchinato, Bittante and Vacca2014), but smaller than the value (24%) observed on Sarda bulk milk (Giangolini et al., Reference Giangolini, Amatiste, Battisti, Boselli, Filipetti, Rosati and Fagiolo2004). The result of the present study is similar to those observed in dairy cattle where the proportion of samples that did not coagulate and those with missing k 20 are on average 19% and 33% across studies, respectively (Bittante et al., Reference Bittante, Penasa and Cecchinato2012).
According to some authors, the milk coagulation process should be faster in ovine than bovine milk (Bittante et al., Reference Bittante, Penasa and Cecchinato2012; Pazzola et al., Reference Pazzola, Dettori, Cipolat-Gotet, Cecchinato, Bittante and Vacca2014). The average RCT found in the present study does not confirm this hypothesis. The values measured in Sarda and Alpine were twofold (Bittante et al., Reference Bittante, Pellattiero, Malchiodi, Cipolat-Gotet, Pazzola, Vacca, Schiavon and Cecchinato2014; Pazzola et al., Reference Pazzola, Dettori, Cipolat-Gotet, Cecchinato, Bittante and Vacca2014). On the other hand, it is in agreement with results obtained in other studies on Sarda (Pirisi et al., Reference Pirisi, Piredda, Corona, Pes, Pintus and Ledda2000; Mele et al., Reference Mele, Buccioni, Petacchi, Serra, Banni, Antongiovanni and Secchiari2006), Massese (Pugliese et al., Reference Pirisi, Murgia and Scintu2000; Martini et al., Reference Manca, Serdino, Gaspa, Urgeghe, Ibba, Contu, Fresi and Macciotta2008) and Spanish (Jaramillo et al., Reference Jaramillo, Zamora, Guamis, Rodriguez and Trujillo2008; Rovai et al., Reference Rovai, Natalia, Gerardo, Jordi and Gabriel2015) sheep breeds. Average values and distributions of k 20 and a 30 are in agreement with a previous report on Sarda ewes (Pazzola et al., Reference Pazzola, Dettori, Cipolat-Gotet, Cecchinato, Bittante and Vacca2014).
Average ILCY measured in the present study was similar to those estimated by Jaramillo et al. (Reference Jaramillo, Zamora, Guamis, Rodriguez and Trujillo2008) but 10% higher than previous finding on Churra sheep (Othmane et al., Reference Othmane, De La Fuente, Carriedo and San Primitivo2002). Anyhow, the actual cheese yield is clearly overestimated by the use of ILCY, whereas the PPCY were in accordance with the average Pecorino Romano cheese yield (Pirisi et al., Reference Pugliese, Acciaioli, Rapaccini, Parisi and Franci2002) and it was moderately correlated with ILCY. The overestimation of cheese yield could be ascribed to the method of micromanufacturing used (Othmane et al., Reference Othmane, De La Fuente, Carriedo and San Primitivo2002; Bonfatti et al., Reference Bonfatti, Tuzzato, Chiarot and Carnier2014) (explained later in the discussion).
Differently from what is observed in dairy cattle, the flock environment exerted a significant role. Compared with previous works on Sarda (Pazzola et al., Reference Pazzola, Dettori, Cipolat-Gotet, Cecchinato, Bittante and Vacca2014; Vacca et al., Reference Vacca, Pazzola, Dettori, Pira, Malchiodi, Cipolat-Gotet, Cecchinato and Bittante2015) the proportion of variance explained by flock-test day was similar for k 20, but slightly lower for RCT and a 30. The fraction of variance explained by flock for MCPs was dramatically higher in comparison with studies on cattle (Ikonen et al., 2004; Tyriseva et al., Reference Tyriseva, Vahlsten, Ruottinen and Ojala2004; Vallas et al., Reference Vallas, Bovenhuis, Kaart, Paerna, Kiiman and Paerna2010), probably due to the peculiarities of sheep farming.
Heritability of milk coagulation, composition and cheese yield traits
For some traits a significant quota of phenotypic variance was additive genetic, in other cases the majority of the variation was of environmental nature. Estimates of heritability for RCT were moderate and just in few cases presented small standard errors. The comparison can be made only with dairy cattle data due to the lack of information for sheep in the literature. Values obtained in the present study confirmed reports for dairy cattle (Ikonen et al., Reference Ikonen, Morri, Tyriseva, Ruottinen and Ojala1999; Tyriseva et al., Reference Tyriseva, Vahlsten, Ruottinen and Ojala2004; Cassandro et al., Reference Cassandro, Comin, Ojala, Dal Zotto, De Marchi, Gallo, Carnier and Bittante2008). However, RCT heritability was below the findings of Ikonen et al. (2004) and Vallas et al. (Reference Vallas, Bovenhuis, Kaart, Paerna, Kiiman and Paerna2010). In case of a 30, the heritability was of the same extent as other studies (Cassandro et al., Reference Cassandro, Comin, Ojala, Dal Zotto, De Marchi, Gallo, Carnier and Bittante2008; Cecchinato et al., Reference Cecchinato, Penasa, De Marchi, Gallo, Bittante and Carnier2011) but sensibly lower than values obtained by Ikonen et al. (Reference Ikonen, Morri, Tyriseva, Ruottinen and Ojala1999 and 2004) and Tyriseva et al. (Reference Tyriseva, Vahlsten, Ruottinen and Ojala2004). The k 20 parameter had a similar heritability of a 30 but few reports have been found on heritability of k 20 in the literature (Bittante et al., Reference Bittante, Penasa and Cecchinato2012).
The heritability estimate of ILCY was double in magnitude compared with values reported by Othmane et al. (Reference Othmane, De La Fuente, Carriedo and San Primitivo2002), whose estimates derived from a sample of similar size, even if with ~7500 test-day records of sheep milk over two generations. The cheese yield predicted on the basis of FP and PP had a heritability of the same magnitude of ILCY. Heritabilities for milk composition traits were from low to intermediate. Values for fat and protein were markedly lower than those reported for Sarda sheep (Sanna et al., Reference Sanna, Carta and Casu1997). The use of 1 test day/animal and the reduced sample size in comparison with other works may at least partially justify these differences. However, values observed in the present study were close to those reported by Othmane et al. (Reference Othmane, De La Fuente, Carriedo and San Primitivo2002) and they were in the range of variability observed for dairy sheep (Oravcová et al., Reference Oravcová, Groeneveld, Kovac, Peškovicová and Margetin2005).
Phenotypic and genetic correlations between milk coagulation traits and cheese yield
The knowledge of genetic associations among coagulation, MY and quality traits is essential when exploring the possibility to select in favour of one of the MCP traits. The overall phenotypic correlation pattern of MCPs confirmed what was observed in Sarda and Churra breeds (Nudda et al., Reference Nudda, Feligni, Battacone, Murgia and Pulina2001; Jaramillo et al., Reference Jaramillo, Zamora, Guamis, Rodriguez and Trujillo2008), whereas partially disagree with the results of Pazzola et al. (Reference Pazzola, Dettori, Cipolat-Gotet, Cecchinato, Bittante and Vacca2014). The latter authors found a low negative correlation between RCT and a 30 (−0.15), indicating a substantial phenotypic independency between these two traits. In the present paper, moderate phenotypic and high negative genetic correlations were obtained between these two traits, respectively. This result is similar to previous reports on dairy cattle (Ikonen et al., 2004; Cassandro et al., Reference Cassandro, Comin, Ojala, Dal Zotto, De Marchi, Gallo, Carnier and Bittante2008; Bittante et al., Reference Bittante, Penasa and Cecchinato2012). Indeed, if milk takes less time to coagulate, then more time is available for the process of curd firming. As the repeatability of RCT is quite higher (Bittante et al., Reference Bittante, Penasa and Cecchinato2012), this means that even in sheep one measure of RCT is enough to predict both traits. Furthermore, the strong negative phenotypic correlation between k 20 and curd firmness at 30 min was expected, due to the positive association of k 20 with RCT. Similar relationships were previously found in Sarda sheep (Pazzola et al., Reference Pazzola, Dettori, Cipolat-Gotet, Cecchinato, Bittante and Vacca2014). Additive genetic variance that is common between these two traits (k 20, a 30) have been scarcely investigated in dairy cattle, due to the higher percentage of missing values for k 20 parameter.
Negative correlation between ILCY and a 30 (either phenotypic or genetic) and positive correlations between ILCY and RCT-k 20 were unexpected. Conversely, PPCY presented a weak positive genetic association with a 30 and negative with k 20. The possible explanation for this correlation pattern can be formulated considering two conflicting aspects. The first is the interaction between predicted cheese yield and a 30 as a function of the FP (Aleandri et al., Reference Aleandri, Schneider and Buttazzoni1989). These authors found that the predicted cheese yield was positively associated with a 30 with low-fat milk and negatively associated with a 30 with high-fat milk. Hence, the high-fat level of ovine milk, compared with cow milk, could partially explain our results. A second issue is represented to the method used for measuring cheese yield. Indeed, micro-cheese factoring can produce biased estimation of actual cheese yield due to the small amount of milk used. This fact is also confirmed by the overestimation of cheese yield, found also in other works (Othmane et al., Reference Othmane, De La Fuente, Carriedo and San Primitivo2002; Jaramillo et al., Reference Jaramillo, Zamora, Guamis, Rodriguez and Trujillo2008). Moreover, Bonfatti et al. (Reference Bonfatti, Tuzzato, Chiarot and Carnier2014) found that cow milk with short RCT and high a 30 did not exhibit higher cheese yield in model cheeses, being the cheese yield variation in their experiment more likely associated with variation in milk FP and PP. The modest genetic correlation between the cheese yield predicted by regression (PPCY) and a 30 seem to suggest this second hypothesis, even if further investigations are needed to clarify the relationship between ILCY and MCPs in sheep milk.
Phenotypic and genetic correlations among milk coagulation, milk yield and composition
The study of the genetic associations between MCPs and MY and chemical composition is crucial to evaluate proper selection strategies. The phenotypic correlations between RCT and protein and CSN found in the present study were in agreement with results on sheep (Nudda et al., Reference Nudda, Feligni, Battacone, Murgia and Pulina2001; Jaramillo et al., Reference Jaramillo, Zamora, Guamis, Rodriguez and Trujillo2008) and in cattle (Bittante et al., Reference Bittante, Penasa and Cecchinato2012). The worsening of the coagulation properties of sheep milk (>RCT and <a 30) with increased SCC is documented in the literature (Pirisi et al., Reference Pirisi, Piredda, Corona, Pes, Pintus and Ledda2000; Nudda et al., Reference Nudda, Feligni, Battacone, Murgia and Pulina2001; Raynal-Ljutovac et al., Reference Raynal-Ljutovac, Pirisi, de Crémoux and Gonzalo2007). An increased SCC can also be the result of intramammary inflammatory process (Rovai et al., Reference Rovai, Natalia, Gerardo, Jordi and Gabriel2015). However, in sheep, high SCC in milk can be often unrelated with pathological conditions, differently from cow. Several factors (breed, parity, stage of lactation, type of birth, oestrus, diurnal) affect SCC variation in sheep milk (Raynal-Ljutovac et al., Reference Raynal-Ljutovac, Pirisi, de Crémoux and Gonzalo2007). Increased RCT and k 20 and reduced a 30 with increasing pH were previously reported in sheep milk (Pirisi et al., Reference Pirisi, Piredda, Corona, Pes, Pintus and Ledda2000; Bencini et al., Reference Bencini2002). Finally, low to moderate phenotypic correlation was observed among individual cheese yield and milk traits. The highest association was between ILCY and FP, and it was half of the correlation found by Jaramillo et al. (Reference Jaramillo, Zamora, Guamis, Rodriguez and Trujillo2008) but agreed with the results of Othmane et al. (Reference Othmane, De La Fuente, Carriedo and San Primitivo2002).
Interesting genetic correlations have been estimated between pH, casein, NaCl and RCT-a 30. For the pH, similar values have been reported for dairy cattle (Ikonen et al., 2004; Cassandro et al., Reference Cassandro, Comin, Ojala, Dal Zotto, De Marchi, Gallo, Carnier and Bittante2008; Vallas et al., Reference Vallas, Bovenhuis, Kaart, Paerna, Kiiman and Paerna2010; Cecchinato et al., Reference Cecchinato, Penasa, De Marchi, Gallo, Bittante and Carnier2011). Moderate correlations between RCT and CSN and no association among protein, CSN and a 30 were reported by Ikonen et al. (2004). On the other hand, results of the present study were opposite to what was found by some other authors (Cassandro et al., Reference Cassandro, Comin, Ojala, Dal Zotto, De Marchi, Gallo, Carnier and Bittante2008; Cecchinato et al., Reference Cecchinato, Penasa, De Marchi, Gallo, Bittante and Carnier2011). A suggestive negative association between CLA with rennet properties might confirm what was found by Bittante et al. (Reference Bittante, Pellattiero, Malchiodi, Cipolat-Gotet, Pazzola, Vacca, Schiavon and Cecchinato2014) in milk of sheep supplemented with rumen-protected conjugated fatty acid source.
Moderate to high positive genetic correlation was found between NaCl and a 30-k 20. Conversely, unreliable negative genetic correlation was found between SCS and RCT, differently from what was observed by other authors in cow milk (Ikonen et al., 2004; Cassandro et al., Reference Cassandro, Comin, Ojala, Dal Zotto, De Marchi, Gallo, Carnier and Bittante2008; Cecchinato et al., Reference Cecchinato, Penasa, De Marchi, Gallo, Bittante and Carnier2011). A very high genetic correlation among NaCl and SCS (0.98±0.31) was found in the present study. This is an interesting result and it suggests the possibility to use indirect indicators of udder status different from SCS. As far as cheese yield is concerned, there is a positive genetic correlation between milk composition and ILCY and negative with MY, which confirm what was found by Othmane et al. (Reference Othmane, De La Fuente, Carriedo and San Primitivo2002).
Conclusions
This study provided estimates of genetic parameters for MCPs of sheep milk of Sarda breed. From the selective point of view, a not negligible proportion of phenotypic variance was additive genetic, and the heritability estimated for MCPs were in agreement with those found in cow milk for MCPs. Genetic correlations found in the present study suggest the chance to use only one of the rennet parameter, as they are highly genetic correlated; however, negative correlation between ILCY and favourable rennet properties suggests to be careful in the use of these methods to predict cheese yield from small milk samples.
Acknowledgements
This research was supported by the RAS, Regional Law No. 7, August 2007, grant no. CRP 61608 ‘Il latte ovino della Sardegna’. The authors wish to thank the APA of Cagliari, Nuoro, Sassari and Oristano for their support in sample collection; the Laboratory of Associazione Regionale allevatori della Sardegna (Oristano, Italy) for performing milk composition analysis; the Italian Association of Animal Breeders (AIA) and of Sheep Breeders (ASSONAPA) for providing pedigree information.