There is a worldwide demographic transition characterized by a significant ageing of the population. This stems from, among other factors, increases in life expectancy and decreases in birth rates (Organization for Economic Cooperation and Development [OECD], 2020). Global demographic information shows that the population over 65 in the OECD region reached 17.2% in 2018 with even larger percentages in the European Union (18.9%) and other European countries such as Spain (19.3%), and Italy (22.7%) (OECD, 2020). The same demographic transitions and growing trend of aging has been observed in Latin America countries. When taken with a weakened pension system, the situation has forced the older population to work beyond the legal age of retirement. Labor force participation in people aged 65 years has increased, particularly in Latin American countries. In Colombia a 28.4% of the working age population has 65 year or more, and in Chile this rate has risen from 17.2% in 2000 to 25.3% in 2019 (International Labor Organization [ILO], 2020) and these figures are estimated to continue growing (ILO, 2018).
Such unprecedented demographic changes entail great challenges for people, organizations, and society as a whole. Particularly, the demand and interest for extended work lives imposes new challenges for older people, particularly in developing their skills and employability. But it also strains regulatory frameworks of states, organizations, employers, personnel policies, and human resources practices. In this regard, various employment impediments for older people have been described (MacDermott, Reference MacDermott2014), some refer to state regulations on retirement, or on internal organizational rules regarding jobs and worker age (Oude Mulders et al., Reference Oude Mulders, Henkens and Schippers2016). For the latter, there is extensive evidence of beliefs and stereotypes associated with age that can result in discriminatory behaviors and biased management practices towards older people, which can negatively affect the full participation of this group in the labor market (Dordoni & Argentero, Reference Dordoni and Argentero2015; Ng & Feldman, Reference Ng and Feldman2012; Solem, Reference Solem2016).
In the late 1960’s, the concept of ageism was first used to represent prejudices of a certain age group against another through attitudes, manners, policies and institutional practices directed against these individuals. As recognized in the workplace, age stereotypes are understood as biases towards other workers based on age, taking precedence over attributes such as knowledge, skills, or attitudes (Posthuma & Campion, Reference Posthuma and Campion2009; Posthuma et al., Reference Posthuma, Wagstaff, Campion, Borman and Hedge2012). From these essentially negative stereotypes, age discrimination in the workplace may manifest in workplace and employment decisions that affect older people adversely (Posthuma et al., Reference Posthuma, Wagstaff, Campion, Borman and Hedge2012).
To provide a measurement tool that can quantify the phenomenon of ageism in Spanish-speaking countries the main goal of this study is to validate and adapt the Nordic Age Discrimination Scale (NADS) (Furunes & Mykletun, Reference Furunes and Mykletun2010), which has been proven to measure perceptions of job discrimination elsewhere (Carral & Alcover, Reference Carral and Alcover2019), in a sample of Chilean, Colombian, and Spanish workers. To this end, this study conducts confirmatory factorial and reliability analyses to demonstrate structural and internal consistencies for this instrument, as well as its validity. And second, the study analyzes the correlations between age discrimination perceptions and several outcome variables in order to test construct validity.
Age Stereotypes and Labor Discrimination against Older People
Stereotypes linked to age fall into schema, or cognitive categories people use to organize environmental information. In the case of this study, they are formed based on the age group one belongs to (Cuddy & Fiske, Reference Cuddy, Fiske and Nelson2002). Such stereotypes concern both young and old people and their stereotypical beliefs, positive or negative, which tend to coexist together (Bal et al., Reference Bal, Reiss, Rudolph and Baltes2011; Dordoni & Argentero, Reference Dordoni and Argentero2015; Figueroa & Nazar, Reference Figueroa and Nazar2015; Fiske et al., Reference Fiske, Cuddy, Glick and Xu2002). For example, older people are normally seen as reliable, loyal, inflexible, and having better soft skills than young people (Krings et al., Reference Krings, Sczesny and Kluge2011), while the latter are usually outlined as creative or flexible (Loretto & White, Reference Loretto and White2006). In addition, older workers group is assumed less amenable to flexibility and adaptation (Loretto & White, Reference Loretto and White2006) and with lesser abilities to learn and greater resistance to change (Posthuma & Campion, Reference Posthuma and Campion2009). In the literature revision carried out by Harris et al. (Reference Harris, Krygsman, Waschenko and Rudman2017), older people are described as less receptive to the use of technology and training, along with lesser physical and psychological skills. Different studies show that they are slower in terms of information processing skills, less able to keep their job positions, have reduced mobility (Loretto & White, Reference Loretto and White2006), and are less creative compared to their younger peers (Gaillard & Desmette, Reference Gaillard and Desmette2010).
A meta-analysis by Ng and Feldman (Reference Ng and Feldman2012) evaluated the empirical evidence on the more dominant stereotypes of older workers, such as worse performance, less motivation, less interest to participate in professional training and career development, higher resistance to change, worse health, and greater vulnerability to work/family time constraints. Contrary to expectations, the authors conclude that the only stereotype with significant evidence was having less interest in professional training. Other authors (e.g., Posthuma & Campion, Reference Posthuma and Campion2009) also agree that most of these notions are vague and exaggerated.
If the concepts surrounding older workers allude to their having less efficiency in technological skills, less able to learn new tasks, and incapable of incorporating new procedures, a less valued perception of them and a resulting exclusion from society is to be expected (Krings et al., Reference Krings, Sczesny and Kluge2011). Perceptions of negative age stereotypes are associated with low organizational identification, poor psychological engagement, and low interest in development opportunities (Chiesa et al., Reference Chiesa, Zaniboni, Guglielmi and Vignoli2019). Because of this, it would not be unlikely that they be targets of discriminatory work practices, find it more difficult to obtain employment, or to retire early from the labor market (Solem, Reference Solem2016; Thorsen et al., Reference Thorsen, Rugulies, Løngaard, Borg, Thielen and Bjorner2012).
These ways of characterizing older workers is just one of many antecedents of discrimination in the workplace (Harris et al., Reference Harris, Krygsman, Waschenko and Rudman2017), that manifests as, for example, difficulties finding employment and in management practices and policies (Dordoni & Argentero, Reference Dordoni and Argentero2015; Loretto & White, Reference Loretto and White2006). There is evidence that indicates lower recruitment rates for older people who are equally qualified as younger candidates (Krings et al., Reference Krings, Sczesny and Kluge2011). It has also been observed that hiring results are not related to job skills alone, but are rather biased against older people (Richardson et al., Reference Richardson, Webb, Webber and Smith2013).
Results from another meta-analysis (Bal et al., Reference Bal, Reiss, Rudolph and Baltes2011) concluded that evaluations for salary raises, selection, and general performance assessments are negatively affected by the age of the applicant. Results also hold that although there are positive stereotypes about older people, such as being reliable, still, less favorable decisions are handed down to them from organizations as compared to their younger co-workers. While younger workers may also be subject to negative age stereotyping, a recent study (Petery et al., Reference Petery, Wee, Dunlop and Parker2020) confirms the findings of Bal et al. (Reference Bal, Reiss, Rudolph and Baltes2011) on stereotypes towards older workers and discriminatory decisions towards them (e.g., unfavorable hiring decisions, or lower performance evaluation).
There are series of implications stemming from ageism on physical health, wellbeing, behavior, and attitudes at work (Triana et al., Reference Triana, Trzebiatowski, Byun, Colella and King2018). A recent study (Chang et al., Reference Chang, Kannoth, Levy, Wang, Lee and Levy2020) including over 7 million participants in 45 countries found ageism effects in 11 health domains and through 25 years studied, and this evidence of ageism was found across the age, sex, and race/ethnicity of the perpetrators of ageism. A connection among perception of discrimination, stress, and less wellbeing at the workplace has also been found thereon (Vogt Yuan, Reference Vogt Yuan2007). Longitudinal studies indicate that older people with a better self-perception regarding their age often show healthier behavior (Levy & Myers, Reference Levy and Myers2004) and higher overall wellbeing in general (Levy et al., Reference Levy, Slade and Kasl2002) than do people with a negative mindset, which may lead to work absenteeism.
Furthermore, discriminatory perceptions are associated with personnel experience in organizations. It has been shown that age negatively impacts work satisfaction, commitment, and engagement (Hassell & Perrewé, Reference Hassell and Perrewé1993; Macdonald & Levy, Reference Macdonald and Levy2016; Snape & Redman, Reference Snape and Redman2003), as well as self-efficacy (Kooij et al., Reference Kooij, de Lange, Jansen and Dikkers2008). Ageism is also positively correlated with retirement intentions (Kooij et al., Reference Kooij, de Lange, Jansen and Dikkers2008), especially for men (Thorsen et al., Reference Thorsen, Rugulies, Løngaard, Borg, Thielen and Bjorner2012).
Work Ageism Measurement Instruments
Although the experience of discrimination is closely related to sociocultural, economic, organizational, and personal (including age) factors, effects can also be present from aspects of gender or ethnicity (Chou & Choi, Reference Chou and Choi2011); or other macro-social variables, like the economic sector or employment sector –private or public– (Loretto & White, Reference Loretto and White2006; Solem, Reference Solem2016), labor market characteristics, and mainstream national values. This suggests that the indications of prevalence of ageism at the workplace will be difficult to disentangle from among distinct contexts. As such, any attempt to quantify this phenomenon necessarily requires local studies.
At the same time, detecting the prevalence of ageism requires valid and reliable measurements for the variables of interest. In work settings, these measurements include direct queries about e.g., being ignored by supervisors or being overlooked for promotions (Chou & Choi, Reference Chou and Choi2011). Some instruments, like The Workplace Intergenerational Climate Scale (WICS; King & Bryant, Reference King and Bryant2017), evaluate attitudes and perceptions of workers from different age groups and intergenerational dynamics; while others, like the Nordic Ageism Discrimination Scale (NADS; Furunes & Mykletun, Reference Furunes and Mykletun2010), are used to assess the perception of age discrimination at the workplace.
A preliminary adaptation and validation of the NADS to Spanish was carried out by Carral & Alcover (Reference Carral and Alcover2019) using a sample of Spanish older workers. However, the differences in labor and social cultures between Spanish-speaking countries in Europe and America, suggested the need for an adaptation and transcultural validation of the instrument for testing rigorously its psychometric properties. Therefore, in addition to Spain, Chile, a country in southern Latin America, and Colombia, a country in the northern and Caribbean region of Latin America, were chosen to represent different Spanish-speaking labor cultures. Thus, this transcultural study aims to, first, validate the one-dimensional structure of the scale used; second, to evaluate its reliability and internal consistency; third, to test criteria validity; and fourth, analyze the construct validity of the NADS with a sample of Chilean, Colombian, and Spanish workers over the age of 45.
Method
Participants
Data was gathered through a self-report instrument protocol in three independent studies, applied to a multi-professional sample of 307 workers employed in Chile, 150 in Colombia, and 209 in Spain. The total sample consists of 666 respondents, sample size good enough to evaluate the psychometric properties of the NADS. The average age of participants was 56.82 years (SD = 5.24), with 31.9% between 45 and 54, 61.6% between 55 and 64, 5.9% between 66 and 74, and 0.6% over 75. Of the whole sample, 59 % were women (N = 393) and 41% were men (N = 273). In terms of education, 51.1% (N = 340) had university degree, 38.3% had technical schooling (N = 255), and 10.1% (N = 67) had completed secondary education.
Regarding the participant employment status, 97.4% (N = 656) were employed, and 2.6% (N = 10) declared themselves as inactive. For those working in formal organizations, 39.7 % (N = 264) worked in private organizations, 58.3% (N = 388) in public institutions, and 0.6% (N = 4) worked in NGOs. The average participants’ organizational tenure was 17.52 years (SD = 12.53).
In terms of marital status, most participants, specifically 65.6% (N = 437), were married, 15.3% (N = 102) were divorced, 2.7% (N = 18) had non-married partners, 12% (N = 80) were single, and 3.6% (N = 24) were widowers.
Measures
Nordic Age Discrimination Scale (NADS)
The scale is composed of six items, related to perceptions about promotion, training, development, development appraisals, wage increase, and change processes (Furunes & Mykletun, Reference Furunes and Mykletun2010; Pahkin et al., Reference Pahkin, Björklund, Mykletun, Furunes, Gard and Lindström2008). Participants responded to a Likert scale where (1) = completely disagree, and (5) = completely agree. In the original NADS validation study, internal consistency as measured by Cronbach’s Alpha fluctuated between .82 and .87 (Furunes & Mykletun, Reference Furunes and Mykletun2010).
In order to prepare the Spanish version of the instrument, an initial translation was first made along with the help of experts with fluency in both languages. The same sense was kept for each question, with only necessary idiomatic adaptations made. A native speaker from the research group with bilingual skills in Spanish then performed a back translation to verify the equivalence of the six elements in both languages. The Spanish items were compiled into a general assay (see the Appendix).
Measures for Criteria Validation
Following the same guidelines established from the original publication of the instrument (Furunes & Mykletun, Reference Furunes and Mykletun2010), two measures were included in the questionnaire assay to validate criteria. First, the perception of age-based inequality at the workplace was measured (“have you noticed any inequality in how older or younger people are treated at the workplace?”) with the following answer scale: (1) Very seldom or never, (2) rather seldom, (3) sometimes, (4) rather often, and (5) very often or always (Pahkin et al., Reference Pahkin, Björklund, Mykletun, Furunes, Gard and Lindström2008). Second, the perception of workplace harassment was measured (“have you been subject to harassment or threats at workplace over the last 6 months?”), for which the same possible answers were given (Dallner et al., Reference Dallner, Elo, Gamberale, Hottinen, Knardahl, Lindström, Skogstad and Örhede2000). This represents a change from the original scale, which had two response alternatives: (1) No, and (2) yes (Furunes & Mykletun, Reference Furunes and Mykletun2010). This item was modified in order to maintain the same Likert-type scale across all items. For the Spanish adaptation, the same translation and back translation procedures as with NADS were used. The criteria validity for these items was expected to positively correlate with the perception of age-based discrimination at the workplace.
Measures for Construct Validity
Following the same procedure used in the original validation of the instrument (Furunes & Mykletun, Reference Furunes and Mykletun2010), different variables related to NADS were measured to test construct validity. The Spanish adaptation for these items utilized the same translation and back translation procedures as for the NADS.
Perception of stress was measured with one item (“Stress refers to a situation where a person feels pressured, uneasy, nervous, anxious, or is unable to sleep at night because their mind is worried about work-related things all the time. Do you currently feel this type of work-related stress?”), with the following scale of answers: (1) Not at all; (2) only a little; (3) to some extent; (4) rather much (5) very much (Dallner et al., Reference Dallner, Elo, Gamberale, Hottinen, Knardahl, Lindström, Skogstad and Örhede2000). Retirement intentions was measured through a six-item subscale ranging from (1) strongly disagree to (5) strongly agree. This variable was measured through a scale adapted to Spanish from Zaniboni et al. (Reference Zaniboni, Sarchielli and Fraccaroli2010) and Topa and Alcover (Reference Topa and Alcover2015), which was also previously used for a Spanish sample in a study by Alcover and Topa (Reference Alcover and Topa2018); examples of items are: Full retirement (“As soon as I can retire, I will definitely stop working”); or bridge employment (“Even when I can retire, I will keep on working but changing job type”). Next, sick leave was measured by one item (“How many days have you missed work because of an illness during the last 12 months?”) with the following options as a response: (1) 0 days, (2) 1 to 7 days, (3) 8 to 24 days, (4) 25 to 99 days, and (5) 100 days or more (Furunes & Mykletun, Reference Furunes and Mykletun2010). These three variables, that is, stress perception, retirement intentions, and sick leave, were expected to positively correlate with workplace age discrimination.
Another variable incorporated was self-efficacy, measured on a four items scale (α = .80; Dallner et al., Reference Dallner, Elo, Gamberale, Hottinen, Knardahl, Lindström, Skogstad and Örhede2000; Pahkin et al., Reference Pahkin, Björklund, Mykletun, Furunes, Gard and Lindström2008) each with the following range of options: (1) Totally disagree, (2) somewhat disagree, (3) indifferent, (4) somewhat agree, and (5) totally agree. Work ability was measured with one item (“Compare your current work ability with the highest you have ever had. Assume this implies that the highest work ability you have had in your life has a value of 10 points. How many points would you give your current work ability?”), with options ranging from (1) completely unable to work to (10) greatest lifetime work ability (Tuomi et al., Reference Tuomi, Huuhtanen, Nykyri and Ilmarinen2001). Life and work satisfaction was measured with two items (α = .68; Pahkin et al., Reference Pahkin, Björklund, Mykletun, Furunes, Gard and Lindström2008) with answers ranging from (1) very dissatisfied to (5) very satisfied. Item examples are: “How satisfied are you with your current job?” and “How satisfied are you with your current life?” These three variables (self-efficacy, work ability, and work and life satisfaction) were expected to negatively correlate with the perception of age-based workplace discrimination.
Lastly, social factors were considered as well. Perceived co-worker support was measured through three items, an example of item is “If necessary, are your co-worker willing to listen to your work-related problems?” (α = .82 in Björklund, Reference Björklund, Lindström, Björklund, Mykletun, Furunes, Gaard and Pahkin2008; and .84 in Pahkin et al., Reference Pahkin, Björklund, Mykletun, Furunes, Gard and Lindström2008). At the same time, perceived supervisor support was also measured with three items (α = .85, in Björklund, Reference Björklund, Lindström, Björklund, Mykletun, Furunes, Gaard and Pahkin2008; .91, Pahkin et al., Reference Pahkin, Björklund, Mykletun, Furunes, Gard and Lindström2008); an example of items is “If necessary, can you get support and help for your work from your closest superior?” For both instruments the range of answers were: (1) Very seldom or never, (2) rather seldom, (3) sometimes, (4) rather often, and (5) very often or always. Both variables were expected to correlate negatively with ageism. All variables used in the construct validity are represented in Figure 1 with the positive (+) or negative (-) expected association.
Positive (+) or Negative (-) Expected Association between Experienced Age Discrimination at Work with All Variables used in the Study for Construct Validity

Procedures
First of all, a pilot test of the instruments was made from a cognitive interview of ten participants with characteristics similar to those of the final participants of the survey. Thus, the ease of understanding the instructions and the protocol items were proven. Second, final versions of the protocol on paper, and online, through Google Forms, were prepared. Once these two steps were completed, data gathering proceeded.
Volunteers for this study were solicited, with preference for those working in public, private, or other types of formal organizations, aged 45 or older. Participation was either on-site, or online through Google Forms. In either case, written information about this study was given to both types of participants, along with a consent form. After reading the information and agreeing to participate (by signing the consent form, or accepting the online version), participants received a survey and an envelope (or responded to the digital online assay). After finishing the questionnaire, participants gave the sealed survey directly to the researchers to ensure privacy. In the case of the online survey, anonymous answers were sent directly to the email addresses of the researchers. Data was compiled between the months of March and June 2018 for valid questionnaires. To this end, all were answered completely, and so no survey was omitted due to missing information.
Statistical Analyses
The unifactorial structure of the instrument was tested by country using confirmatory factor analysis (CFA). WLSMV estimation was used, since the items are ordinal and of five categories (Sass et al., Reference Sass, Schmitt and Marsh2014). The following indices were used for goodness of fit: χ2/df, RMSEA, SRMR, CFI, and TLI. For these, values less than or equal to 3 for the χ2/df ratio indicated acceptable fit, even though very affected by sample size (Hair et al., Reference Hair, Black, Babin and Anderson2010); RMSEA values below .03 were an excellent fit, and less than .05 indicated a very good fit, and lower than .08, a decent fit (Williams et al., Reference Williams, Ford, Nguyen and Rogelberg2004); SRMR values below .08 showed a good fit, though following Hu and Bentler (Reference Hu and Bentler1999), values equal to or less than .09 are also acceptable when the RMSEA or CFI conditions are also good; CFI values equal to .95 indicated a good model fit (Hair et al., Reference Hair, Black, Babin and Anderson2010; Hu & Bentler, Reference Hu and Bentler1999), though some authors affirm that values of .90 or even .80 are acceptable as well (Hair et al., Reference Hair, Black, Babin and Anderson2010); and finally, for TLI, values nearest to 1 indicate better fit (Arbuckle, Reference Arbuckle2013). Considering that the instrument in its original form only have adequate indices of fit in Spain, a specification search was performed to detect the source of lack of fit using modification indices to detect problematic covariances between residuals. Adequate fit was obtained on all countries removing Item 1. This action constitutes a redefinition of the construct, so invariance results should be interpreted with this concern in mind (Putnick & Bornstein, Reference Putnick and Bornstein2016). More conceptual implications of this technical decision can be found in the discussion section.
To test the measurement invariance of the instrument between the different countries, the configurational, metric, scalar invariance measurement errors were checked (Steenkamp & Baumgartner, Reference Steenkamp and Baumgartner1998). Considering the use of categorical indicator variables, the scalar invariance was calculated by adjusting the thresholds of the categories by item, with theta parameterization (Millsap & Yun-Tein, Reference Millsap and Yun-Tein2004). As an invariance criterion, a change of < –.10 in CFI, and a change of RMSEA > .015 or a change of SRMR > .30 were indicators of non-invariance at metric level; for scalar level or residual invariance, a change of < –0.10 in CFI, and a change of RMSEA > .015 or a change of SRMR > .10 were indicators of non-invariance (Chen, Reference Chen2007). As invariance was only achieved at the metric level, a partial invariance analysis was considered to determine which are the relevant differences between countries in the models at the scalar level (Byrne et al., Reference Byrne, Shavelson and Muthén1989).
To analyze convergent validity, the study made use of methodology as proposed by Shipp et al. (Reference Shipp, Burns and Desmul2010), who suggest that item-factor saturations should be higher than .70, with consideration given to how many saturations are significant.
Along with previous analyses, the Harman test was applied to estimate possible common-method variance effects for all items in the study (Podsakoff et al., Reference Podsakoff, MacKenzie, Lee and Podsakoff2003). Once all the above was performed, the bivariate Pearson correlation was used to test criteria and construct validities.
Finally, Cronbach’s alpha and McDonald’s omega were used to determine the reliability of the scales. All analyses were performed with IBM SPSS version 24, and JASP 0.11.1.0.
Results
Descriptive Statistics
Table 1 shows means, SD, skewness and kurtosis of the NADS items by country and in total. In all the items there are significant differences in their mean. Specifically, Colombia presents higher scores on Item 1, F(2, 662) = 14.50, p < .01 (Chile mean = 2.95 SD = 1.47, Colombia mean 3.28 SD = 1.42, Spain mean = 2.45 SD = 1.41); Item 2, F(2, 663) = 40.85, p < .01 (Chile mean = 2.98 SD = 1.49, Colombia mean 3.21 SD = 1.52, Spain mean = 1.99 SD = 1.29); Item 3, F(2, 661) = 7.12, p < .01 (Chile mean =3.42 SD = 1.44, Colombia mean 3.55 SD = 1.37, Spain mean = 3.02 SD = 1.51); Item 4, F(2, 662) = 4.54, p < .05 (Chile mean =2.75 SD = 1.44, Colombia mean 3.03 SD = 1.39, Spain mean = 2.58 SD = 1.28); and Item 6, F(2, 659) = 10.38, p < .01 (Chile mean =2.94 SD = 1.45, Colombia mean 2.96 SD = 1.36, Spain mean = 2.42 SD = 1.31), followed by Chile and Spain. In Item 5, Chile has the highest score, followed by Colombia and Spain, in last place, F(2, 661) = 45.52, p < .01 (Chile mean =2.84 SD = 1.55, Colombia mean 2.67 SD = 1.50, Spain mean = 1.66 SD = 1.14). All items have near skewness near 0 and negative kurtosis, except for Items 2 and 5 in Spain, with skewness > 1 for both and kurtosis = 1.49 for the latter.
Means, SD, Skewness and Kurtosis of the NADS Items by Country and in Total

Note. Total sample N = 666; Colombian sample N = 150; Chilean sample N = 307; Spanish sample N = 209.
** p < .01. * p < .05.
Confirmatory Factor Analysis
Before testing configurational invariance is required to the test in each country the single factor model proposed by the authors of the instrument. As seen in Table 2, in the case of Spain, the adjustment indices were good, χ2(9) = 18.18, p = .046, CFI = .99, TLI = .99, SRMR = .032, RMSEA = .068, but that was not the case for Colombia χ2(9) = 37.35, p < .001, CFI = .97, TLI = .95, SRMR = .051, RMSEA = .145, nor Chile, χ2(9)=61.21, p < .001, CFI = .98, TLI =.97, SRMR = .036, RMSEA = .138, both with RMSEA higher than expected.
Confirmatory Factor Analysis for the Spanish Adaptation of the Nordic Age Discrimination Scale (NADS), All Sample Population, 6 and 5 Items

Note. Colombian sample N = 150; Chilean sample N = 307; Spanish sample N = 209; SRMR = Standardized Root Mean Residual; RMSEA = Root Mean Square Error of Approximation; CFI = Comparative Fit Index; TLI = Tucker-Lewis Index.
So, modification indices were calculated for both countries to detect the source of the lack of fit. In the case of Colombia, a residual correlation between Items 5 and 6 (Modification Index [MI] = 7.013) was tested, improving the RMSEA fit (RMSEA=.108, p = .037), although it was still high. Thus, a second residual correlation between Items 1 and 6 was tested (MI = 3.859), which was the second index of modification in the original model and the highest in the second model, with the RMSEA (RMSEA = .071, p = .257) adjustment being adequate. As for Chile, an important modification index was observed corresponding to the residual between 1 and 2 (MI = 20.58). Consequently, the correlation between them was implemented, improving the goodness of fit indices, in particular RMSEA (RMSEA = .059, p = .309). Observing that both in Colombia and Chile the Item 1 was problematic, this item was eliminated on all countries. This model, with 5 items, shows good adjustments indexes for all countries (see Table 2), with CFI > .95, SRMR < .05 and non-significant RMSEA, all below .80. It should be noted that for Colombia, χ2(5) = 5.56, p = .352, and Spain, χ2(5) = 9.85, p = .080, the chi-square test is non-significant, showing that the model fits the data. Additionally, the correlation matrix of the items for the total sample and by countries has been included in the Appendix.
Measurement Invariance Analysis
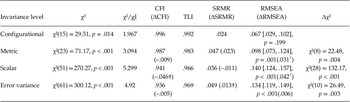
Table 3 shows the result of the measurement invariance analysis between the 3 countries. It is observed that the metric invariance of the instrument can be sustained in practical terms, since the difference in CFI is less than .01 between the configurational and metric invariance model. At scalar invariance, the difference in CFI, ΔCFI= –.046 and RMSEA, ΔRMSEA = .042 are indicators of non-invariance at this level.
Results of the Measurement Invariance Analysis for the Spanish Adaptation of the Nordic Age Discrimination Scale (NADS)

Note. SRMR = Standardized Root Mean Residual; RMSEA = Root Mean Square Error of Approximation; CFI = Comparative Fit Index; TLI = Tucker-Lewis Index.
† Indicator of non-invariance.
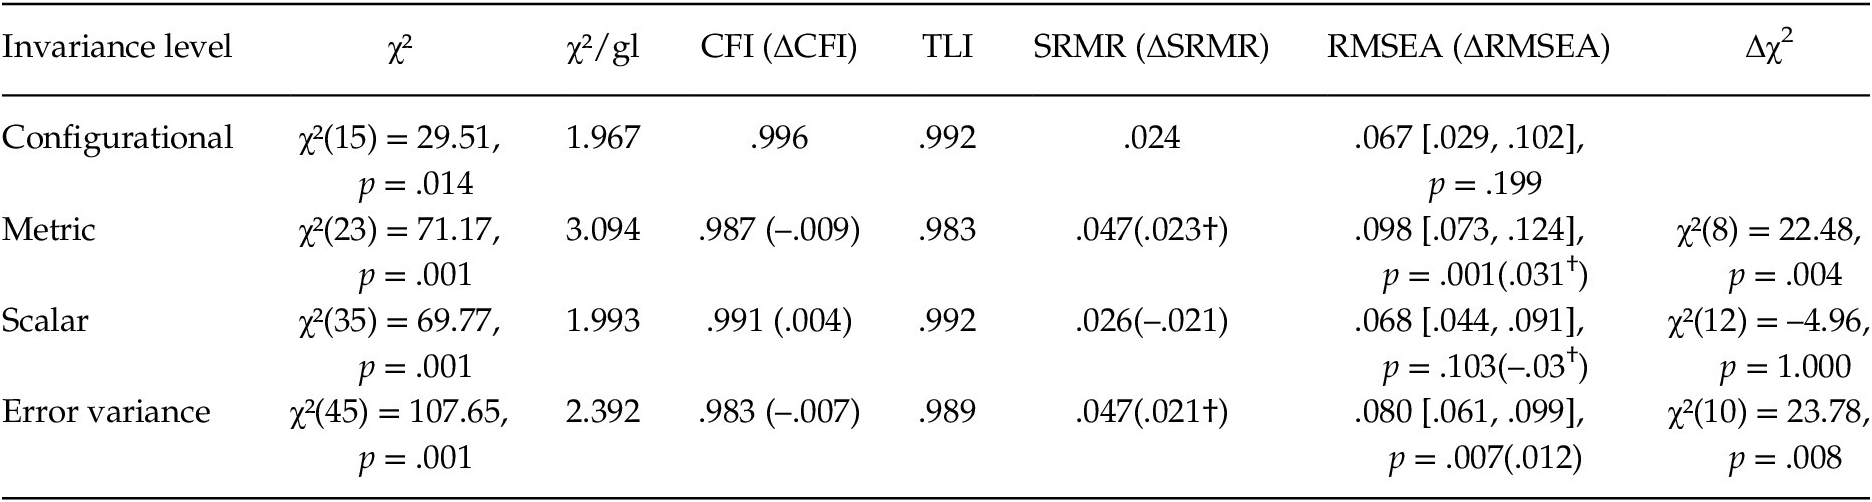
To determine which indicator generates the differences between countries, a partial invariance analysis was carried out from the scalar level. Relevant modification indices were observed for the thresholds of Items 2 and 5. Releasing these thresholds by country, the CFI invariance is obtained in all levels. The residual invariance model, with these adjustments, also presents good fit indicators (see Table 4).
Results of the Partial Invariance Model for the Spanish Adaptation of the Nordic Age Discrimination Scale (NADS)

Note. Thresholds for Items 2 and 5 have been considered released by country. SRMR = Standardized Root Mean Residual; RMSEA = Root Mean Square Error of Approximation; CFI = Comparative Fit Index; TLI = Tucker-Lewis Index.
† Indicator of non-invariance.
Evidence of Convergent Validity
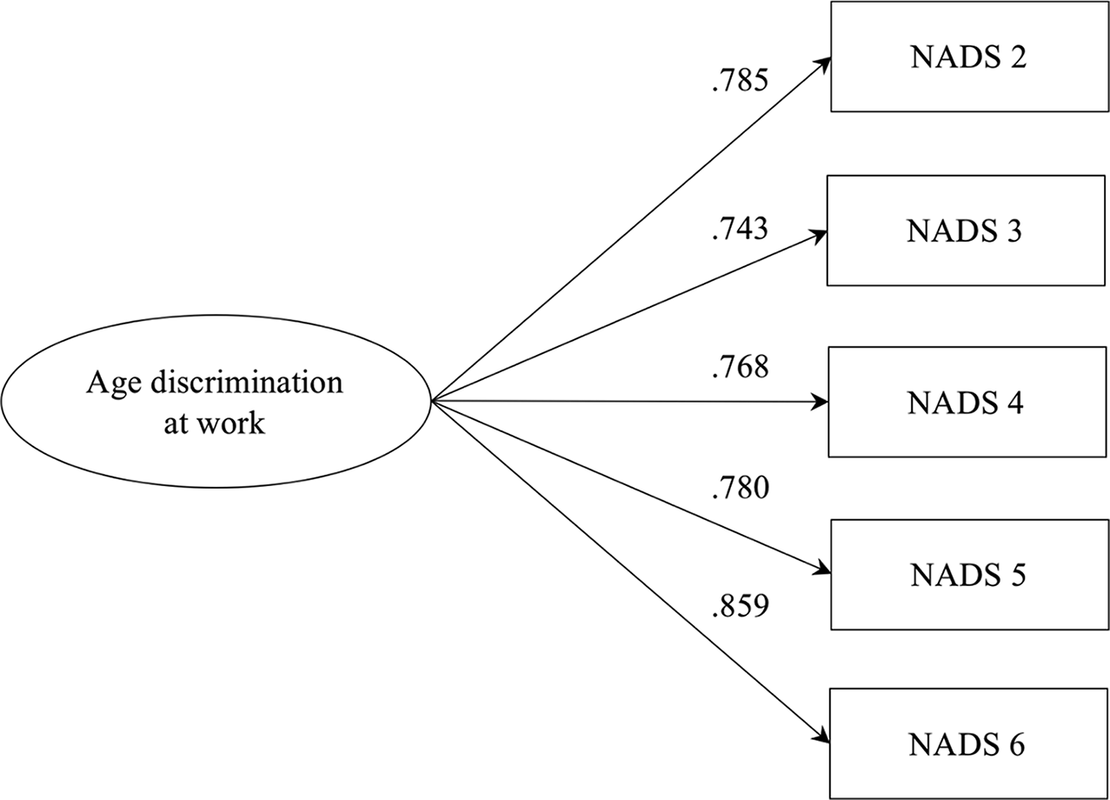
For convergent validity analysis, as seen in Figure 2 (Total sample N = 666), all item saturations from corresponding factors were significant (p < .001), ranging between .741 and .835, fulfilling requirements for convergent validity.
Single Factor Model of Age-Based Discrimination at the Workplace by NADS (Total Sample N = 666)

Descriptive Statistics and Reliability
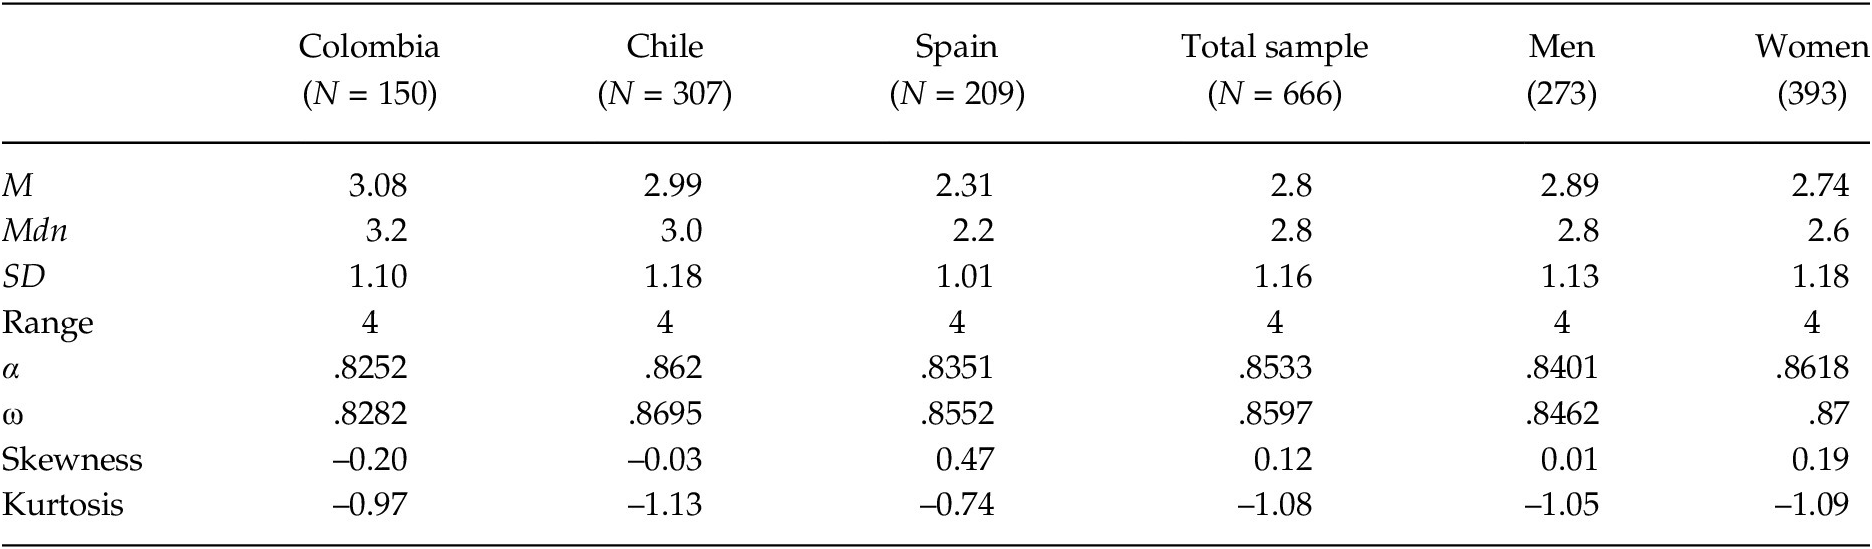
Table 5 shows the descriptive statistics for the measure of age discrimination at work (NADS), as well as the respective Cronbach’s alpha and McDonald’s omega.
Mean, Median, SD, Range, Cronbach’s Alpha and McDonald’s Omega for Subsamples and Total Sample (NADS)

Note. Total sample N = 666; Colombian sample N = 150; Chilean sample N = 307; Spanish sample N = 209. Differences between countries are significant. Spain sample had lower scores in NADS than Colombia (t = 6.851, p < .001), and Chile (t = 6.505, p < .001). There is no difference between Chilean and Colombian sample (t = 1.121, p < .261).
Cronbach’s alpha for NADS internal consistency was .85 for the entire sample, similar to the McDonald’s omega of .86. In order to obtain more evidence about the stability of this measure, the internal consistency was also measured for the sample divided by country and sex. That exercise confirmed that the internal consistency of the Spanish version of NADS was adequate, in the range .82–.87.
After that, the Harman test was subsequently applied. The results showed this factor explains 18.69% of the variance, considerably less than the 50% from common variance; the latter, thus, does not seem to affect significantly correlations among the studied variables.
Evidence of Criterion and Construct Validity
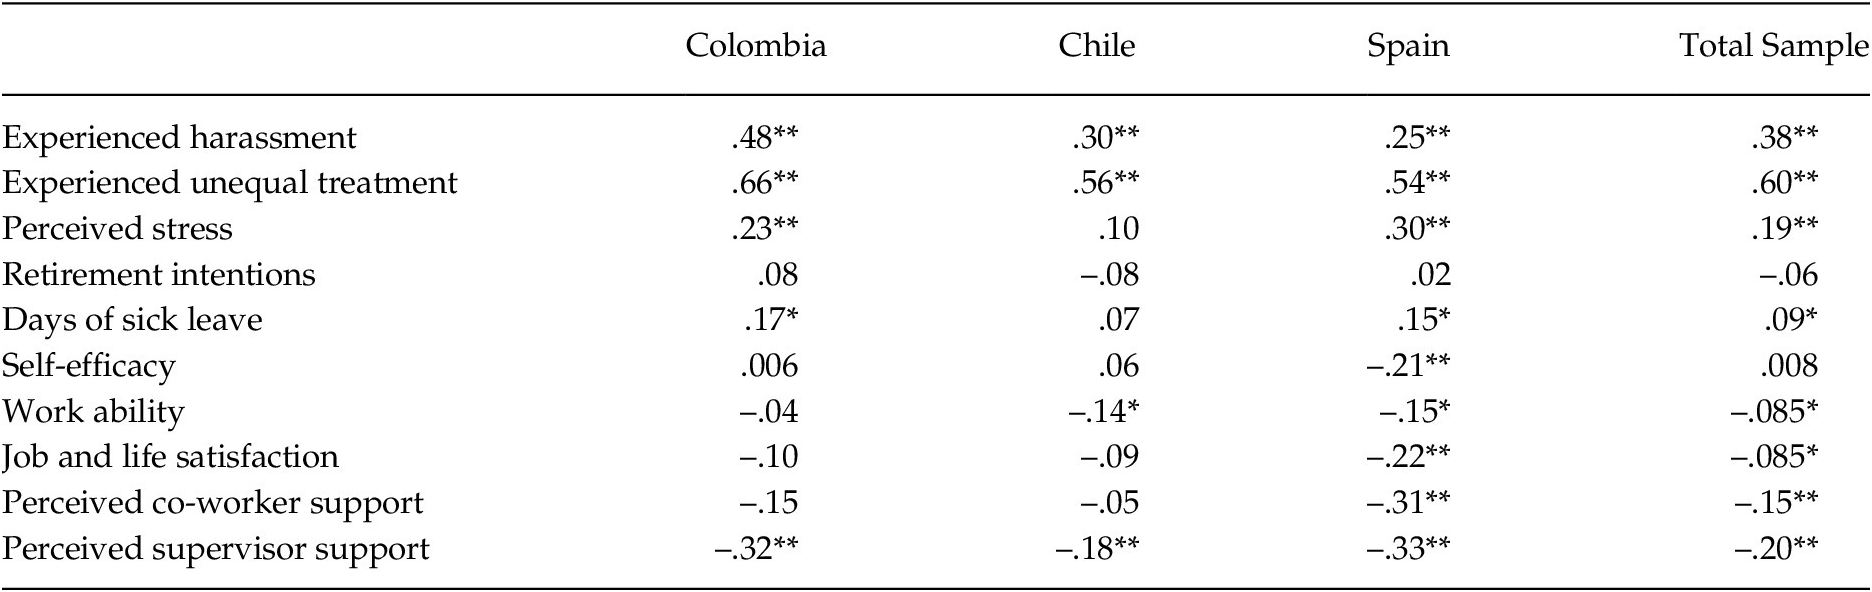
In order to test criterion validity two items measured the level of experienced age inequalities in the workplace: a) Experienced harassment and bullying, and b) experienced age-related treatment differences. As expected, perception of age discrimination had strong positive correlation with both experienced harassment (r = .38, p < .01) and experienced unequal treatment at work (r = .60, p < .01) (see Table 6).
Correlations among NADS and Criteria and Construct Variables

Note. Total sample N = 666; Colombian sample N = 150; Chilean sample N = 307; Spanish sample
N = 209.
* p < .05. ** p < .01.
To assess construct validity, several correlations analyses were conducted among the NADS and work-related psychological states, i.e., perceived stress, intent to retire, self-efficacy, work ability, and job and life satisfaction. NADS was correlated with social work environment indicators, co-worker support, and supervisor support; and with health impairments, like days of sick leave. As shown in Table 6, perception of age discrimination had a negative relationship with work ability, job and life satisfaction, and perceived supervisor and co-workers support. Perceived stress and days of sick leave were positive and significate related to perception of age discrimination. However, the data showed no correlations for retirement intention and self-efficacy. Therefore, there was a strong evidence for criteria validity, and moderate results for construct validity.
Discussion
Current socio-demographic general tendencies have pushed the debate about age in the workplace to the foreground of the academic-scientific field, organizational management, and the agenda of public authorities. The roles that age stereotyping, prejudice, and age discrimination at work have played has taken on special relevance (Chou & Choi, Reference Chou and Choi2011; Harris et al., Reference Harris, Krygsman, Waschenko and Rudman2017; Posthuma et al., Reference Posthuma, Wagstaff, Campion, Borman and Hedge2012; Solem, Reference Solem2016). Most of the focus in this investigation about age discrimination has been descriptive, focusing especially on delineating the factors that cause age stereotyping and how they can affect the decision to either continue work or retire (Truxillo et al., Reference Truxillo, Finkelstein, Pytlovany, Jenkins, Colella and King2018). Nonetheless, two of the priority objectives for this research field may be, first, provide validated instruments to measure the real magnitude of this phenomenon on an organizational scale (Chou & Choi, Reference Chou and Choi2011; Furunes & Mykletun, Reference Furunes and Mykletun2010); and second, to provide organizations with best age-friendly management practices for preventing or reducing discrimination against older workers (Solem, Reference Solem2016), such as improved HR age-supportive policies and practices, and increased positive intergenerational contact at work (Truxillo et al., Reference Truxillo, Finkelstein, Pytlovany, Jenkins, Colella and King2018). This study answers the first set of needs by having transcultural validation of NADS in Spanish and Latin America contexts based on previous work that had already demonstrated its psychometric properties for European populations (Carral & Alcover, Reference Carral and Alcover2019; Furunes & Mykletun, Reference Furunes and Mykletun2010).
The results obtained in this study confirm the one factor structure of the Spanish version of NADS as well as an adequate level of internal consistency, indexed with a reliability on Cronbach’s alpha and McDonald’s omega indicators higher that .80. These results were observed both in the total sample and in the samples from three different countries. It should be noted than the original version of the scale, with 6 items, was confirmed as is in Spain, but not in Latin American. The 5-item version proposed in this paper shows adequate fit indices in Spain, Colombia and Chile, and invariance could be asserted completely for configurational and metric levels, and partially for scalar level and error variance.
Regarding the lower adjustment of Item 1 in the Latin American samples (item that refers to the discrimination of older people in cases of promotion or internal recruitment), this can be associated, for example in the case of Chile, with the general absence of policies and structured management systems for older workers and retirement, which means that workers perceive that practices follow the “case by case” rule (Herrera et al., Reference Herrera, Kornfeld and Belloni2018). Therefore, when asked about "Older workers are passed over/left out in cases of promotion or internal recruitment", the answers can be very dispersed, in the sense that they reflect personal experiences or seen in the context of each company, and that they respond to “discretionary practices”, so there are no clear perceptions of age discrimination or the absence of it. Something similar can happen in the case of Colombia, in which the situation for the management of older workers is very similar (Martínez-Restrepo et al., Reference Martínez-Restrepo, Enríquez, Pertuz and Alzate-Mesa2015).
As already mentioned, one of the effects of the lower use of structured HRM policies and practices in Latin America is reflected in the relatively unpredictable nature of career development and the lack of organizational career management practices. Promotions or internal-vertical career mobility are to a greater extent the result of discretionary decisions, or on a case-by-case basis, and consequently, employees do not internalize a predictable job development scheme. This effect might be amplified as age increases. For example, there is evidence that workers who have been previously promoted, are more likely to promote again (Machado & Portela, Reference Machado and Portela2013), which generate a decrease in orientation or motivation towards promotion (Bowen & Staudinger, Reference Bowen and Staudinger2013; Harris et al., Reference Harris, Krygsman, Waschenko and Rudman2017). So, it is expected that if a worker does not have the experience of promotion in his or her career, when becoming older the probability of promoting decreases dramatically, or it is considered only as a product of chance. The data indicate that when faced with these perceptions, workers tend to adopt a role of "staying on the sidelines", that is, they remain committed to their work but passively accept age discrimination to reduce or regulate negative emotions that a more vigilant attitude would provoke (Harris et al., Reference Harris, Krygsman, Waschenko and Rudman2017). These perceptions may explain why Chilean and Colombian workers when faced with the question of whether older workers are excluded from internal promotion/recruitment processes, showed answers that are not consistent nor clearly oriented in a positive or negative sense. These perceptions do not coincide with those of Spanish workers (and those of the northern European countries where the NADS was initially validated), hence the differences detected in Item 1 in the data of our cross-cultural validation.
Indirect proof of these perceptions of unpredictable careers as one ages can be found in the volume of older workers in Latin America who leave formal employment and go on to work in the so-called informal sectors (Cockell, Reference Cockell2014; Londoño Moreno, Reference Londoño Moreno2021). Given that in many cases they are unable to retire due to weakened pensions and the need to extend their working lives, the option against job insecurity is informal employment. In this regard, in Chile the working conditions of older workers differ substantially from those of younger workers. People over 65 years of age work mostly as independent workers, receive lower incomes than other age groups, and have fewer hours of effective training than their younger counterparts (OECD, 2013; Centro UC Políticas Públicas, 2017) which accounts for the job vulnerability of this group. Future studies should analyze, for example using qualitative techniques or mixed methods, whether the measurement of perceptions of age discrimination in these countries should include items related to informal employment and the intentions or pressures to enter it as age increases from the workers.
Regarding criteria validity, NADS significantly correlates with both experienced harassment and experienced unequal treatment. Results show that there is a close relationship between negative experiences and perceived age discrimination at work, and seems to indicate a countless list of factors that simultaneously challenge older worker wellbeing (Garstka et al., Reference Garstka, Schmitt, Branscombe and Hummert2004). Similarly, perceived age discrimination at work was shown to relate to different variables, especially those proposed as outcome of ageism. First, there are negative relationships among perceived age discrimination and some job-relevant attitudinal variables, like job satisfaction and perceived job stress, which supports results from other studies demonstrating similar relationships with several job-relevant attitudes (McMullin & Marshall, Reference McMullin and Marshall2001), like affective organizational commitment (Snape & Redman, Reference Snape and Redman2003), or work engagement (Bayl-Smith & Griffin, Reference Bayl-Smith and Griffin2014). Second, perceived age discrimination at work correlated significantly with lower perceptions of workability; previous studies had also found perceived age discrimination to be associated with lower self-esteem and lower perceived personal control (Hassell & Perrewé, Reference Hassell and Perrewé1993), and to directly affect training and career development opportunities that, in turn, make the maintenance and improvement of work-related knowledge, skills, abilities, and work ability (as a whole) more difficult (Maurer & Rafuse, Reference Maurer and Rafuse2001; Zacher & Steinvik, Reference Zacher, Steinvik and Whitbourne2015). And third, perceived age discrimination at work was shown to be related to low perceived supervisor and co-worker support; that said, previous literature (Brownell, Reference Brownell2014) had also found an inverse relation between age discrimination and supportive environments for older workers. However, there is no significant relationship with retirement intentions that could be associated to the fact that the reasons for retiring are more complex, there are factors that drive them to leave and others that retain older workers in the labor market (Andersen et al., Reference Andersen, Jensen and Sundstrup2019) and would realize how stressful it can be for older workers to continue working in the presence of age discrimination.
Based on the above relationships and although some variables were not found to be statistically significant, the study may still definitively conclude that the Spanish adaptation of NADS on Colombian, Chilean, and Spanish workers has satisfactory construct validity, similar to that of the original scale (Furunes & Mykletun, Reference Furunes and Mykletun2010).
As previously mentioned, having validated instruments to measure the age discrimination at work is useful to expose the ‘hidden’ nature of age discrimination in working life (Wood et al., Reference Wood, Wilkinson and Harcourt2008). Studies have now shown adequate psychometric properties of NADS, not only in its original validation for Norwegian, Swedish, and Finnish (Furunes & Mykletun, Reference Furunes and Mykletun2010) but also for Spanish and Latin American workers. The first practical implication is having provided an adequate instrument to evaluate the prevalence of age discrimination at work in those contexts (Colombia, Chile, and Spain); this may also have potential applications to other Latin American, Spanish-speaking countries, since no instrument has yet been made available for these contexts. Accordingly, this study followed recommendations given by previous authors who pointed out that “in order to extend the use of the scale, validations in other languages are needed” (Furunes & Mykletun, Reference Furunes and Mykletun2010, p. 28). Even though the perception and experience of age discrimination at work can (and must) be explored by means of data triangulation, other sources, and methodologies, a first quantitative approximation is quite useful for bringing the issue to light.
Second, the practical implications of the divergent results found regarding the promotion or internal recruitment of older workers in Latin-American and European countries (Cebola et al., Reference Cebola, dos Santos and Dionísio2021; Lagacé et al., Reference Lagacé, Firzly, Zhang and Łuszczyńska2020), are evident. It is necessary for public and private organizations to increase the implementation and use of structured HRM policies and practices, with objective criteria for performance evaluation and career development, which include the entire work life cycle, with an age-sensible management perspective. In this way, in addition to helping to reduce age discrimination, workers over the age of 50 will be able to foresee how their middle and late career will develop and indirectly, these policies and practices can help to reduce the increase in the number of older adults in the informal economy, which in turn will lead to an improvement in their well-being, health and quality of life.
Third, having a reliable measurement instrument allows for the collection of prevalent data regarding ageism, which increases visibility thereof for organizations and society. Being collectively aware of this issue will ease policy implementation and human resource actions to prevent or reduce age discrimination at work (Solem, Reference Solem2016; Truxillo et al., Reference Truxillo, Finkelstein, Pytlovany, Jenkins, Colella and King2018). Additionally, objective analyses more easily mobilize social agents, politicians, and union representatives in demanding that laws and regulations are enacted to avoid or even sanction age-based discrimination at work.
Fourth, NADS also allows more studies and transcultural analyses to be made with worker cohorts from different countries and socio-occupational and cultural contexts. Although there are international initiatives that try to measure and integrate data on ageism, such as AGEDISCRIMINATION.INFOFootnote 1, the lack of instruments is still a barrier when trying to calibrate the real magnitude of this phenomenon. An instrument like NADS is useful in achieving this important objective.
Lastly, measurements of age discrimination at work can be used to analyze relationships among perceptions of work ability, as has already been done in this study. It will have special impact on identifying the role of ageism on decisions for either early or on-time retirement (Topa et al., Reference Topa, Depolo and Alcover2018), on extending work life in the same occupation, or on bridge employment options (Alcover & Topa, Reference Alcover and Topa2018). At the same time, detailed studies aid in identifying interaction effects between labor discrimination and older worker experiences, such as the necessity of continuing to work for economic reasons and not by chance or choice, and consequences on the wellbeing and health of older people.
First, the original 6-items version could only be confirmed for Spain, because the fit indices where not adequate for Latin America. The 5-items version proposed in this paper, that shows good psychometric properties for all the countries studied, constitutes a redefinition of the construct, so it should be considered an exploratory model, to be confirmed and replicated in new samples.
Second, given the transversal nature of the design, it is not possible to establish cause-effect relationships. Future studies should use longitudinal design with at least three measurements at different times to evaluate not only possible changes in ageism over time, but also the relationships and potential impacts among resulting variables. Any such study would also allow NADS to be analyzed for test-retest reliability.
Third, the samples used are not representative of the whole Spanish and Latin American population. Further studies with larger samples will be needed to identify possible differences among labor and socio-occupational sectors, and organizational characteristics (e.g., organization size, public or private, etc.). Although our research did not find any difference between men and women, it is possible that certain professions may foment gendered ageism (Duncan & Loretto, Reference Duncan and Loretto2004), or, on the contrary, shows that this is a transversal phenomenon (Walker et al., Reference Walker, Grant, Meadows and Cook2007).
This study also did not identify potential differences in perceived age discrimination according to ethnic or cultural groups. However, it may be possible to find relationships among age and ethnic characteristics in work and organization environments with high diversity. Similarly, perceptions of discrimination may be multiple and intersectional, which should be explored by analyzing relationships among age, gender, and the racial-ethnic characteristics of minorities (Harnois, Reference Harnois2014). This analysis would be especially relevant in the context of most Latin-American countries, where cultural and ethnic diversity is high.
Lastly, volunteer sampling was used, and the data collected were self-reported. This may produce self-selection effects and common-method variance bias in the sample. Further studies should use random samples and data triangulation as mentioned before.
Despite these limitations, this study has shown important results in relation to age groups, with social, economic, and political relevance for agendas around much of the world. It also has the added value of providing a reliable and valid instrument for measuring age discrimination at work to the scientific and professional community of Latin-American countries, previously only validated and used for European countries.
Appendix
NADS Items and their Spanish-Language Versions

Correlations Matrix of the NADS Items in the Total Sample

Note. N = 666.
* p < .05. ** p < .01.
Correlations Matrix of the NADS Items in the Colombian Sample

Note. N = 150.
* p < .05. ** p < .01.
Correlations Matrix of the NADS Items in the Chilean Sample

Note. N = 307.
* p < .05. ** p < .01.
Correlations Matrix of the NADS Items in the Spanish Sample

Note. N = 209.