


Introduction
Glacier mass-balance changes are important for global sea-level changes (e.g. Reference Arendt, Echelmeyer, Harrison, Lingle and ValentineArendt and others, 2002), as well as being significant on a local and regional scale for many aspects of water resource management including flood protection, water supply and the operation of hydroelectric facilities (Reference Hock, Jansson, Braun, Huber, Bugmann and ReasonerHock and others, 2004). To more thoroughly understand the consequences of global climate change, it is necessary to predict the response of glaciers to such changes. A common procedure is to calibrate a mass-balance model using historic climate and mass-balance data, and then to run the model with a perturbated climate using either hypothetical (e.g. Reference Braithwaite and ZhangBraithwaite and Zhang, 1999) or model-predicted climate changes (e.g. Reference Schneeberger, Blatter, Abe-Ouchi and WildSchneeberger and others, 2003).
The purpose of our study is to use the long-term mass-balance measurements available at Engabreen, a maritime glacier in northern Norway that is exploited for hydropower, to calibrate a distributed temperature-index-based mass-balance model and to use the model to assess the static mass-balance sensitivity to hypothetical temperature and precipitation changes.
Study Site
Engabreen (66˚40’ N, 13˚45’ E) is an outlet glacier from the western Svartisen ice cap in a maritime climate in northern Norway (Fig. 1). Its elevation ranges from 1590 m to just a few m a.s.l. and it covers an area of 38 km2, of which 86% is located on a plateau above 1100ma.s.l. From there, the ice flow is channelled into a narrow valley. On this steep descent, the ice ruptures and the glacier tongue is heavily crevassed. Front position changes have been monitored annually by the Norwegian Water Resources and Energy Directorate (NVE) since 1970, but measurements exist back to 1903. Before 1930, the glacier terminus covered the present proglacial lake, and after a rapid retreat of almost 2 km during the 1940s the tongue position became approximately stable. During the 1990s the terminus of Engabreen advanced by roughly 200m, but it has recently started retreating again (e.g. Reference KjøllmoenKjøllmoen, 2003).
Location maps of Engabreen and Svartisen ice cap in northern Norway (left). The star indicates the location of the meteorological station Glomfjord (GF). Dots in the map on the right mark the approximate position of mass-balance stakes, and the star denotes the location of the automatic weather station Skjæret. Grid zone is UTM 33 and units are kilometres.

Input Data
Meteorological data
The nearest long-term meteorological data series is recorded at Glomfjord (39m a.s.l.) roughly 20 km north of Engabreen. The station has been operated by the Norwegian Meteorological Institute since 1912, and a continuous time series of diurnal air temperature and precipitation data is available from 1974. The mean annual air temperature (1974–2002) at this site is 5.3˚C, with mean monthly winter temperatures just below 0˚C (Fig. 2). The daily temperature record shows periods of positive air temperature throughout the winter, indicating the occurrence of melting events on the lower part of Engabreen. Mean annual precipitation amounts to 2045 mm, with higher precipitation during the autumn/winter.
Mean values of monthly precipitation sums (a) and average air temperature (b) as recorded at the meteorological station Glomfjord, 1974–2002.

An additional automatic weather station has operated at Skjæret (1364 ma.s.l.), a nunatak in the accumulation area, since 1995, although with some data gaps. Comparison of the air-temperature record (1999–2002) from this station with the corresponding data from Glomfjord yields an average temperature lapse rate of –0.0074 Km–1.
Mass-balance data
In association with hydropower production from the Svartisen area, NVE started a glacier monitoring programme at Engabreen in 1970. Since then, summer, winter and net glacier mass balance have been measured annually using the glaciological method and can be found in periodically published NVE reports (e.g. Reference KjøllmoenKjøllmoen, 2003). Typically, the specific mass balance is calculated from repeated measurements at five to ten ablation stakes at different elevations, at least 100 snow thickness soundings and two to three snow density measurements. The point mass-balance data are then extrapolated to the entire glacier as a linear function of elevation.
Data on elevation profiles of mass balance and mean mass balances are available for both the summer and winter and the entire budget year. These values as published by NVE are usually based on the stratigraphic method where mass balance is measured relative to the preceding summer surface. Hence, these values describe the mass balance over a budget period of unknown length. In contrast, using the floating-date method, mass balance expresses the loss or gain of mass between two field visits and thus precisely known dates. For the years 1994–96, both methods were used to determine the mass balance, and a comparison revealed that differences between mean net mass-balance values were small (∼0.1mw.e.). However, some uncertainty remains since the mean net mass balance is not a very sensitive measure. Differences may be large for individual readings that refer to a shorter period, but smooth out over an entire year. In addition, the effect of mass-balance inaccuracies in the ablation area on the mean net balance is very small due to the small proportion of the glacier tongue (<15% of Engabreen). Nevertheless, such inaccuracies may be significant while calibrating model parameters.
Based on raw data from NVE’s field measurements, we compiled a dataset of individual stake measurements referring to the floating-date method for comparison of model results at individual points. The database comprises a total of 248 readings at 20 individual stakes for the period 1993–2002. For this database, only those stakes for which there have been three consecutive readings were selected. To keep the dataset simple, sporadic readings were omitted and only measurements from major field visits were included.
Digital terrain models
Modelling was based on a digital elevation model (DEM) at 25 m resolution of a region sufficiently large to include all surrounding topography potentially shading the glacier surface. The spatial resolution of the DEM determines the resolution of the subsequently derived digital terrain models (DTMs) of slope and aspect. A rectangular subset encompassing Engabreen was cut out from the DEM to form the actual model domain. The glacier surface was clipped out from this DEM using the glacier boundaries determined from aerial photographs from 1968.
The model application requires further DTMs denoting the initial snow-cover water equivalent and extent of the firn area. The existence of the icefall on the glacier tongue complicates the determination of the exact position of the firn line, but the available mass-balance information and field observations (e.g. Reference KjøllmoenKjøllmoen, 2003) suggest an approximate elevation of the firn line at 1000 ma.s.l. over the entire observation period (1971–present). We generated one firn-cover DTM (firn line at 1000 m a.s.l.) and used it for all years.
Since model calculations were performed starting at different dates, appropriate DTMs of initial snow cover had to be defined for the start of the modelling period (1974) and for each year of the calibration period. For calibration, model runs were typically started at the beginning of a new budget year (autumn) and the corresponding snow cover was obtained from NVE field reports (e.g. Reference KjøllmoenKjøllmoen, 2003).
Model Description
Lacking data for an energy-balance approach, we applied a grid-based temperature-index mass-balance model based on air temperature, precipitation and potential direct solar radiation (Reference HockHock, 1999). Including the latter takes into consideration the effects of topography on melting. The model has successfully been applied in a variety of studies requiring spatially distributed melt models, but in which only limited meteorological data were available (e.g. Reference Hock, Johansson, Jansson and BärringHock and others, 2002; Reference Schuler, Fischer, Sterr, Hock and GudmundssonSchuler and others, 2002; Reference Schneeberger, Blatter, Abe-Ouchi and WildSchneeberger and others, 2003). Glacier melt rate M is computed by

where MF is a melt factor (mm d–1 K–1), a is a radiation coefficient for snow or ice (mm w.e. d–1 W–1 m2 ˚C–1), I is potential direct solar radiation (W m–2) and T is air temperature (˚C). The melt factor and the radiation coefficients are empirical coefficients which are assumed to be constant in space and time. Different radiation factors are used for snow/firn and ice to account for the difference in albedo. The transient snowline and surface type are internally modelled since both accumulation and melt are calculated. I is approximated by standard algorithms on insolation geometry and topography. Air temperature was extrapolated to each gridcell employing a constant lapse rate that was derived from meteorological data at Glomfjord and Skjæret.
Accumulation is computed from precipitation by first enhancing the measured value by a precipitation correction factor and then assuming a linear increase with increasing elevation up to a maximum elevation. Whether precipitation falls as rain or snow is determined by a threshold temperature. A mixture of rain and snow is assumed for the range 1 K above and 1 K below the threshold temperature with linear interpolation of the percentages of rain and snow in between.
Parameter Calibration
The three melt parameters (melt factor, radiation coefficients for snow and ice) and three precipitation parameters (precipitation correction factor, precipitation gradient, maximum elevation for increase in precipitation) were determined by calibration, whereby values were adjusted such that model results were in optimal agreement with observations (Table 1). The available dataset covering the 28 year period 1974/75–2001/02 was divided into two parts. The 9 year period 1993/94–2001/02 was used to calibrate the model parameters, and the remaining 19 year data series (1974/75–1992/93) served as an independent dataset to evaluate the performance of the model.
Adjusted model parameters and their optimized values

A careful parameter optimization is required to avoid erroneous assignment of parameter values which may result from compensating effects. For example, a wrong assignment to precipitation parameters may cause an overestimation of snow accumulation which in turn may be compensated for by enhanced snow ablation, thereby also causing incorrect ablation parameters. To account for this problem, we applied a stepwise optimization procedure, attempting to incorporate as much information as possible to constrain the parameter values. The model calibration was started by simulating exclusively the winter period of each mass-balance year between 1993/94 and 2001/02, and precipitation parameters were adjusted to best reproduce the measured winter mass balance. Once a satisfying parameter combination had been found, the model was run for the entire calibration period, and ablation parameters were fitted to the data.
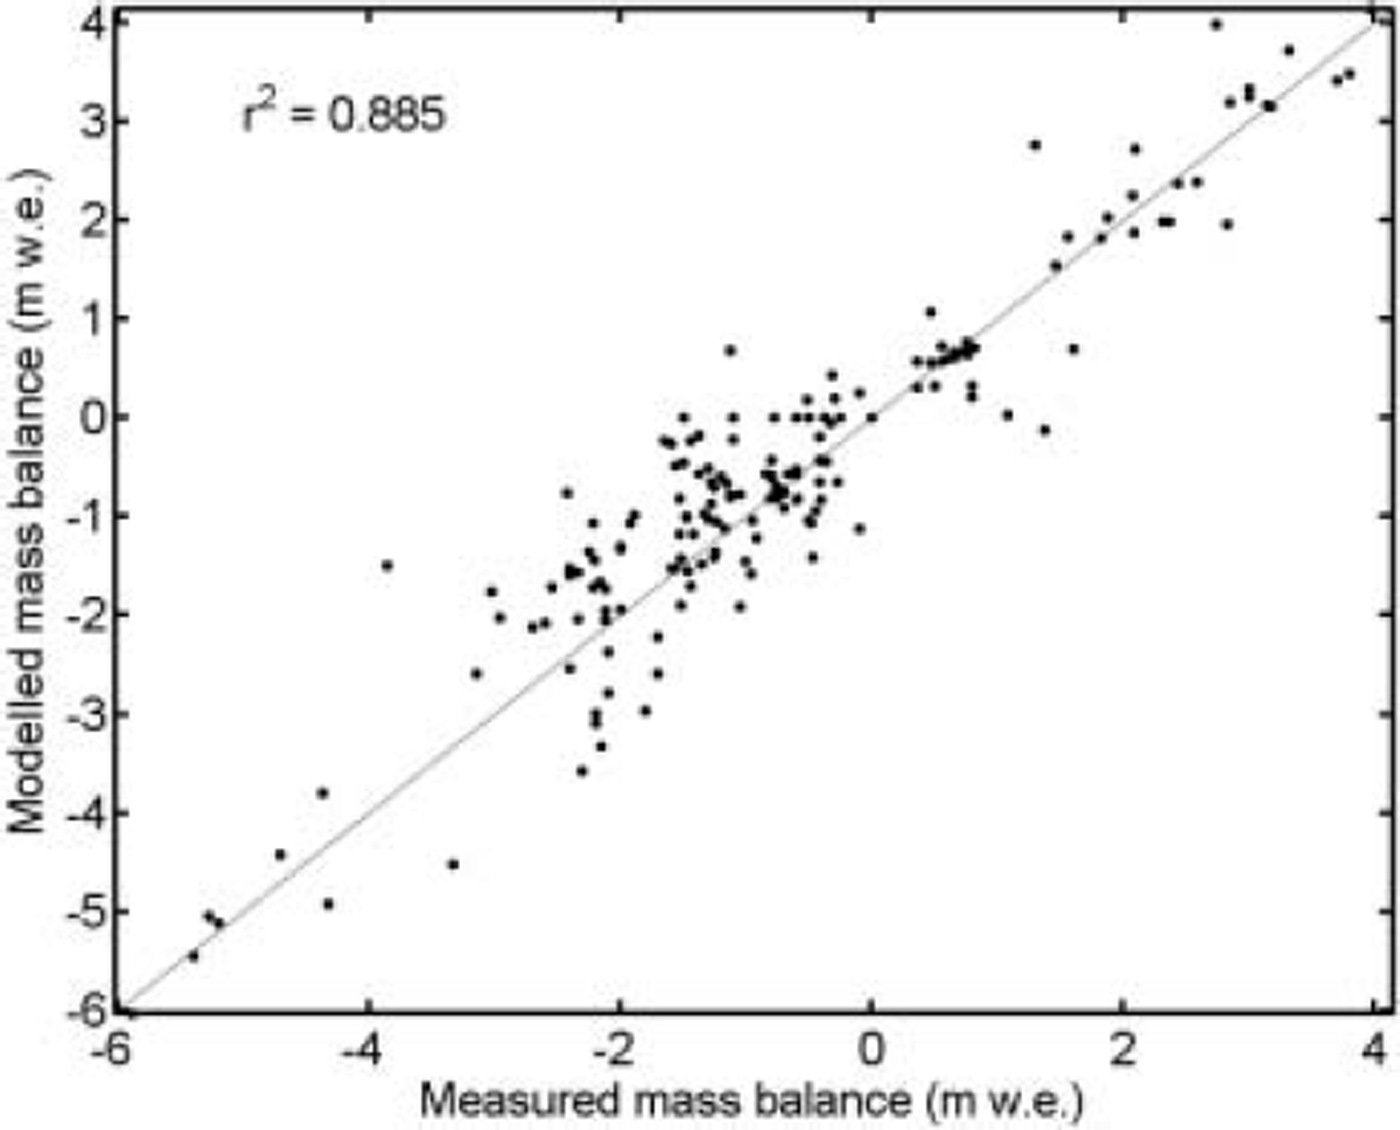
Parameters were optimized by systematically varying their values within reasonable limits aiming at the set of parameters that maximizes the agreement between model output and observations. Our database consists of a range of different observations and enabled us to define several criteria for tuning the model parameters: maximum agreement between corresponding model output and (1) the measured mass balance at individual stakes (Fig. 3), (2) measured mass-balance profiles (Fig. 4) and (3) observed specific winter, summer and annual mass balances (Fig. 5). Model output is typically produced at specified time-steps chosen to coincide with the measurement dates; hence, computed values intrinsically correspond to mass-balance data obtained by the floating-date method. The dataset of stake measurements is the only one of this type available (Fig. 3). Since reported specific mass balances and the mass-balance profiles based on stratigraphic data correspond to a period of unknown length, they were less comparable to computed values. Nevertheless, mass-balance profiles were used to constrain model parameters determining the distribution of mass balance with elevation (Fig. 4). Furthermore, time series of mean mass balance served to control whether the overall behaviour and the temporal evolution of the mass balance of Engabreen are reproduced correctly (Fig. 5). Model parameters and their optimized values are presented in Table 1. It is emphasized that thus obtained model parameters represent one possible set of values that optimizes the agreement between model results and observations. Different sets may be possible, and optimized parameter values may be erroneous. This is the nature of parameter optimization of empirical models and further implies that parameters cannot easily be transferred to other regions, but require site-specific calibration.
Scatter plot of measured vs calculated mass balance at individual stakes. The number of samples is 174.
Examples of mass-balance profiles (a) for a good (1997) and (b) for a less satisfying (1982) agreement between simulations (grey lines) and measurements (black lines). Profiles are shown of winter mass balance (b w), summer balance (b s) and net mass balance (b n).

The temporal evolution of mass balance of Engabreen. Values of winter (b w), summer (b s) and net (b n) mass balances are shown separately. The shaded area indicates the calibration period.

Results
Model performance
For the calibration period 1993/94–2001/02, a total of 174 mass-balance values were derived from the database of individual stake measurements. The direct comparison of measured and calculated values in Figure 3 shows a strong correlation (r 2 = 0.885), with a standard deviation of 0.63 m. The slope of a line determined by linear regression of calculated to measured values is close to 1, indicating that model predictions do not systematically over- or underestimate the measurements, neither in the ablation nor in the accumulation part of the dataset.
Most of the available mass-balance profiles (Fig. 4) consist of values that have been constructed by interpolation of field measurements (and extrapolation below 300 ma.s.l.) and hence are the result of interpretation. In addition, most of the data are based on the stratigraphic method, and therefore, as discussed above, a direct comparison with model results is restricted. For these reasons, we abandoned a numerical evaluation comparing observed and modelled mass-balance profiles. Nevertheless, visual inspection proved to be valuable for constraining the parameters determining the distribution of mass balance with elevation. In general, simulated mass-balance profiles correspond fairly well with the measured profiles (Fig. 4a). However, the regularly observed reverse gradient of the winter balance profile at highest elevations was not reproduced by the model. This decrease in accumulation in highest elevation is presumably related to the redistribution of snow by wind, a process that introduces complexity in the spatial accumulation pattern and which is not accounted for by our simple model. In some years there is considerable disagreement between the measured and modelled mass-balance profiles (Fig. 4b). We relate these deviations mainly to uncertainties in the field data for certain years. Much of the ablation area is occupied by a heavily crevassed icefall, and sparse and uncertain measurements on the glacier tongue have been justified by the small influence of erroneous values on the total mass balance, since this area occupies <14% of Engabreen.
A detailed comparison of mean mass-balance time series (Fig. 5) reveals that the calculated values are in good agreement with the observations (r 2 = 0.74). If the calibration period 1994–2002 is examined separately, we find that the model in general explains the mean net mass balances very well (r 2 = 0.90), but also that calculated and measured values of mean summer mass balance (r 2 = 0.91) and mean winter mass balances (r 2 = 0.95) are in excellent agreement.
The generally good performance indicates that the model formulation captures the controlling mechanisms of accumulation and ablation. To test this conclusion, we applied the model to the remaining dataset (1975–93). As expected, the deviation of calculated from measured values is slightly larger in this validation period than in the calibration period, but the overall model performance is satisfying (r 2 = 0.676), with the tendency that winter mass balances are more closely correlated (r 2 = 0.842) than summer mass balances (r 2 = 0.546). The weaker summer balance modelling is mainly due to two outliers. The model clearly under-predicts the summer balance in 1979 and 1995 (Fig. 5), probably due to unusually dry summers. Precipitation during these melt seasons was considerably reduced compared with the longer-term mean. We assume that enhanced shortwave radiation input accelerated summer melting and at least partially contributed to the observed high melting, although summer temperatures were not significantly higher than in other years. Hence, our temperature-driven melt model including a radiation index based on average conditions fails to capture this radiation-driven melt excess.
In summary, the model succeeds in explaining the mass-balance history of Engabreen over the last ∼30 years. For the first 14year period, 1975–88, we note that the mean net mass balance varied around zero, with a slight tendency towards positive values. The following decade was marked by a series of continuously positive mass balances, and the terminus of Engabreen advanced ∼200m during that period. Since 2000, Engabreen has experienced negative net mass balances and its front is currently retreating again. Both winter and summer mass balances are approximately equally correlated to net balances, indicating that the variation of net balance is about equally well explained by each of the components (r 2 values of 0.54 and 0.46, respectively). Negative net balances occur when a relatively low winter balance (∼2 m) coincides with an at least moderately negative summer balance (<–2 m).
Sensitivity to climate input
To test the sensitivity of Engabreen’s mass balance to changes in climate forcing, the model was used to perform a range of perturbation experiments. In doing so, we have applied uniform temperature or precipitation changes to the input data and run the model over the entire period 1974/ 75–2001/02. In detail, we adopted two approaches. First we followed the procedure of Reference Oerlemans and ReichertOerlemans and Reichert (2000) and calculated the seasonal sensitivity characteristic derived from temperature and precipitation perturbations employed individually for each month while leaving the data for the remaining months unchanged. In total, 12 temperature scenarios were simulated. For each one, the temperature data for the individual month were increased by +1 K while precipitation was kept unchanged. In the same way, 12 precipitation scenarios were simulated by increasing the monthly precipitation by +10% while temperature was kept constant (Fig. 6). The general pattern coincides with that found for Nigardsbreen, Norway (Reference Oerlemans and ReichertOerlemans and Reichert, 2000), although the temperature sensitivity during the ablation season (May–October) is more pronounced at Engabreen. The latter finding presumably reflects the more maritime climate setting of Engabreen compared with Nigardsbreen.
Seasonal sensitivity characteristic of Engabreen. Values represent the sensitivity of the annual mass balance to monthly perturbations in temperature (dark grey) and precipitation (light grey).

Second, we applied various temperature and precipitation perturbations modifying the input data uniformly over the entire period. We calculated six temperature scenarios, perturbating the temperature data in 0.5˚C steps from a –1˚C cooling to a +2˚C warming while precipitation was kept unchanged. In the same way, five precipitation scenarios were simulated by changing the precipitation in 10% steps from a –20% decrease to a +30% increase while temperature was kept constant. Figure 7 displays the average deviation from the undisturbed reference scenario for each of the scenarios. For both temperature and precipitation perturbations, the dependence of net mass balance on changes in climate forcing is close to linear, yielding estimates of static mass-balance sensitivities of –1.06ma–1 K–1 and +0.35ma–1 (10%)–1. The same values are obtained when summing up the monthly values of the seasonal sensitivity characteristic (Fig. 6). These values are in excellent agreement with those found for Engabreen based on a simple regression model by Reference De Woul and Hockde Woul and Hock (2005) (–0.99ma–1 K–1 and +0.35 ma–1 (10%)–1, respectively) and those reported by Reference Rasmussen and ConwayRasmussen and Conway (2005) (–0.91 m a–1 K–1 and +0.35 m a–1 (10%)–1, respectively). These values suggest that a precipitation increase by 30% is required to compensate the effects that a 1K warming would have on the mass balance of Engabreen. The relatively high sensitivity to changes in temperature is also in line with those reported previously for other maritime glaciers (e.g. Reference Oerlemans and FortuinOerlemans and Fortuin, 1992; Reference Schneeberger, Blatter, Abe-Ouchi and WildSchneeberger and others, 2003). Reference Oerlemans and FortuinOerlemans and Fortuin (1992) argued that glaciers in a wetter climate are more sensitive, since such glaciers have a larger mass turnover and extend to low elevations where air temperature is higher.
Sensitivity of the mass balance of Engabreen to changes in (a) temperature and (b) precipitation. Filled symbols connected by black lines are associated net mass balance; effects on winter (dashed line) and summer (dotted line) mass balances are shown in grey.

Separating the mass-balance sensitivities into their summer and winter components, we find that the net balance sensitivity to precipitation changes is almost entirely (by roughly 85%) dominated by the sensitivity of the winter balance, as expected. The effect of precipitation changes on the summer mass balance is small. In contrast, the temperature sensitivity of the summer balance accounts for about two-thirds of the total temperature sensitivity of the net mass balance, the remainder being contributed by the sensitivity of the winter balance. Clearly, the winter balance is affected by warmer air temperatures as more precipitation falls as rain, and by more frequent and intense melting in winter.
Conclusion
Despite its simplicity, the distributed temperature-index mass-balance model performed well in reproducing the spatial and temporal distribution of mass balance of Engabreen during the 28 year period 1974/75–2001/02. The model yielded –1.06ma–1 K–1 and +0.35ma–1 (10%)–1 for the sensitivities of the mass balance to an increase in temperature of 1 K and an increase in precipitation of 10%, respectively. Such high sensitivities are in agreement with previous studies on maritime glaciers. Mass-balance sensitivity due to precipitation changes is almost entirely due to the sensitivity of the winter balance, while two-thirds of the sensitivity due to temperature changes is caused by changes in the summer balance and one-third by changes in the winter balance.
We recognize that our sensitivity values represent an indication of the mass-balance sensitivity to a climate change, rather than a prognostic tool to predict the future evolution of Engabreen. Our sensitivity experiments are simplistic, assuming uniform changes in either temperature or precipitation throughout the year, although climate models indicate that temperature and precipitation changes are likely to occur simultaneously and display pronounced seasonal variations (Reference HoughtonHoughton and others, 2001). Furthermore, feedback mechanisms which might result from changes in the firn cover (albedo feedback) and the glacier geometry (elevation feedback) were ignored while assuming constant firn-cover extent and constant glacier geometry. In order to assess the response of Engabreen to future climate change in terms of the effect on water resources and glacier geometry, future work will need to focus on using the output of circulation models and coupling the mass balance as an upper boundary condition to a glacier flow model. With the establishment of a distributed mass-balance model as presented here, the tool to link climate predictions to glacier dynamics is made available. Further model improvement should address a more sophisticated accumulation scheme incorporating redistribution of snow by wind and topographic effects other than elevation.
We further conclude that use of mass-balance data in model calibration and validation is hampered by data only being reported based on the stratigraphic method, since exact dates of the beginning and end of both the summer and winter balance year are not known and thus have to be estimated for modelling. This introduces uncertainties in the direct comparison of measured and modelled values. Since the additional efforts to register a floating-date mass balance in addition to a stratigraphic one are minimal, we encourage mass-balance observers to record both values separately.
Acknowledgements
This project is part of the Global Monitoring for Environment and Security (GMES)–Northern View project financed by the European Space Agency and the Climate and Energy Project (CE) funded by Nordic Energy Research (NEFP). We appreciate the comments made by S. Marshall and the scientific editor J. Oerlemans which helped improve the manuscript.



