I. INTRODUCTION
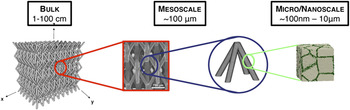
Metallic cellular materials have long been shown to possess unique combinations of low weight, high stiffness and strength, and substantial energy absorption at relatively low crushing stress.Reference Evans, Hutchinson, Fleck, Ashby and Wadley1,Reference Evans, He and Deshpande2 Additionally, when designed with interconnected porosity, the open volume in the architecture can be exploited for active cooling or energy storage, providing unique opportunities for multifunctionality.Reference Lu, Valdevit and Evans3–Reference Valdevit, Jacobsen, Greer and Carter7 At a given relative density (defined as the mass density of the cellular medium divided by the mass density of the solid constituent), topologically architected cellular structures (e.g., periodic architectures) are vastly superior to stochastic foams, by virtue of a more efficient stress transfer mechanism between the macroscale and the unit-cell level: when appropriately designed, each unit-cell element (whether a truss or a shell feature) will largely experience tension or compression under the applied external loads, with minimal bending.Reference Evans, Hutchinson, Fleck, Ashby and Wadley1,Reference Deshpande, Fleck and Ashby8 This guarantees full exploitation of the mechanical properties of the base material, providing the cellular material exceptional mechanical efficiency (in terms of specific stiffness and strength). Over the past decade, a number of cellular topologies have been investigated and characterized, ranging from truss-like conceptsReference Deshpande, Fleck and Ashby8–Reference Zok, Waltner, Wei, Rathbun, McMeeking and Evans10 to prismatic (honeycomb-type) designs.Reference Valdevit, Hutchinson and Evans11,Reference Zok, Rathbun, He, Ferri, Mercer, McMeeking and Evans12 From a manufacturing perspective, nearly all these materials have been built with ingenious assembly techniques combined with high-temperature brazing.Reference Wadley13,Reference Wadley, Fleck and Evans14 As a result, the smallest dimensional feature is often of the order of a millimeter. Recent advances in multiscale manufacturing enable fabrication of hollow-truss-based lattices with dimensional control spanning seven orders of magnitude in length scale (from ∼50 nm to 10 cm).Reference Valdevit, Jacobsen, Greer and Carter7,Reference Schaedler, Jacobsen, Torrents, Sorensen, Lian, Greer, Valdevit and Carter15,Reference Torrents, Schaedler, Jacobsen, Carter and Valdevit16 Figure 1 illustrates the architecture for hollow nickel microlattices, fabricated with a novel process combining a self-propagating polymer waveguide (SPPW) polymerization technique and electroless nickel deposition.Reference Schaedler, Jacobsen, Torrents, Sorensen, Lian, Greer, Valdevit and Carter15,Reference Torrents, Schaedler, Jacobsen, Carter and Valdevit16 These microarchitected cellular materials (which can be polymeric, metallic, ceramic, or hybrid) offer tremendous potential for mechanical efficiency, achievable through a synergistic combination of architectural optimization and base material selection (the ability to deposit the base material in the form of films with thickness lower than a micron allows exploitation of well-established mechanical size effects at the nanoscaleReference Greer and De Hosson17). To exploit the full potential of these novel microarchitected materials, it is essential to explore the entire design space and identify optimal topologies. Architectural optimization naturally requires the integration of a modeling platform (whether analytical or numerical) with optimization tools. Unfortunately, the hollow nature of these lattices and their complex surfaces complicate the mechanical analysis because the complex nodal geometry (e.g., fillet radii, thickness variations) and the potential stubbiness of the members limit the applicability of beam theory-based analytical models. A novel, highly parallelized computational platform [henceforth referred to as predictive materials architecture tool (PMAT)] has been recently developed to handle these difficultiesReference Godfrey, Scherson and Valdevit18 and has been applied to the design of optimally stiff pyramidal hollow microlattices.Reference Godfrey and Valdevit19,Reference Godfrey, Schaedler, Jacobsen, Carter and Valdevit20 In this work, the same platform is utilized to model the compressive strength of hollow metallic microlattices and extract optimal design maps. The article is organized as follows: Sec. II reports the experimental results. Section III presents the analytical and numerical modeling of compressive strength. In Sec. IV, PMAT is used to automatically and efficiently sample the entire accessible design space and collect thousands of strength calculations into optimal design maps. The results provide a clear understanding of trends and isolate the effect of all design variables. Finally, Sec. V discusses the dramatic effect of the nodes on the mechanical response of hollow microlattices and illustrates the capability of the PMAT platform in quickly exploring possible mitigation strategies. Conclusions follow.
Schematic of a microarchitected material based on a hollow-truss pyramidal lattice.

II. EXPERIMENTAL CHARACTERIZATION
A. Sample fabrication
The nickel microlattices were fabricated with a three-step process (Fig. 2): (i) fabrication of a sacrificial polymeric template by SPPW prototyping; (ii) coating of the template with electroless Ni deposition, and (iii) removal of the sacrificial template. Electroless nickel plating results in conformal coatings with a uniform thickness that can be controlled by the plating time (e.g., a wall thickness t of 500 nm was achieved by electroless nickel plating of approximately 3 min). The process has been described in detail elsewhere.Reference Schaedler, Jacobsen, Torrents, Sorensen, Lian, Greer, Valdevit and Carter15,Reference Torrents, Schaedler, Jacobsen, Carter and Valdevit16 A number of samples were produced with this technique, spanning three orders of magnitude in relative density (from 0.01 to 14%). The dimensions of a selection of representative samples are provided in Table I. The angle, strut length, and strut diameter are nominal values, known with an accuracy of ±2°, ±3%, and ±15%, respectively. The larger uncertainty on the diameter is due to the fact that struts are typically narrower at the center than at the nodes, whereby D represents an average value. The strut thickness is generally measured by electron microscopy; although the technique allows a resolution of the order of nanometers, a typical variation of ±10% within a sample is generally observed, for a given deposition time. Standard error analysis indicates an uncertainty of 18% on t/D. The density is measured by measuring the weight and the dimensions of a prismatic sample, resulting in an accuracy of ∼10%.
Schematic of the fabrication process for nickel hollow microlattices.

Dimensions and properties of selected nickel hollow microlattices.

B. Mechanical response under compressive loads
The strength of nickel microlattices with different wall thicknesses and unit cell sizes was investigated by quasi-static uniaxial compression experiments. The load, P, was measured using load cells with ranges of 250 N and 250 lbs, depending on the sample tested; the displacement, δ, was measured by the internal LVDT embedded in the frame actuator. Engineering stress and strain were used throughout, defined as σ = P/A 0 and ε = δ/L 0, with A 0 and L 0 being the initial cross-sectional area and length of the sample, respectively. The samples were not attached to face sheets or compression platens on either the top or the bottom. The compressive strength was defined as the collapse strength of the lattice. Representative stress–strain curves are depicted in Fig. 3. Note the wide variety in mechanical response as the relative density is sampled from 0.013 to 8.5%. At ultra-low relative densities, hollow microlattices exhibit elastic recovery from compressive strains in an excess of 50%. This unusual phenomenon has been recently explored and discussed in detail.Reference Torrents, Schaedler, Jacobsen, Carter and Valdevit16,Reference Maloney, Roper, Jacobsen, Valdevit, Carter and Schaedler21
Compressive response of nickel microlattices at progressively increasing wall thickness: (a) t = 150 nm (Sample O in Table I), (b) t = 500 nm (Sample H), (c) t = 3 μm (Sample D), and (d) t = 26 μm (Electroless + electro-deposited nickel sample, not in Table I). Note the transition at  ${{\bar \rho }}\sim 0.2 - 0.5\%$ from a buckling-dominated collapse mode, enabling near full recovery from 25% to 50% strain, to an irreversible plastic collapse mode. The arrows indicate model predictions for buckling strength, initial yield strength, and strength at which 5% of the nodes have yielded.

III. STRENGTH MODELING OF HOLLOW LATTICES
A. Analytical formulation of yielding and buckling strength
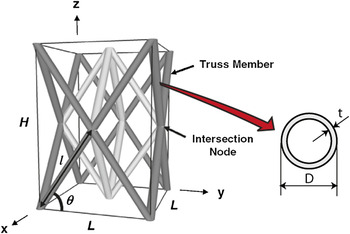
The structure of interest is a hollow lattice with the unit cell topology depicted in Fig. 4. The geometric parameters required to fully define the lattice are the lattice angle, θ, the cell size, L (related to the truss member length,  $\ell$, by
 $L = 2\ell \cos {\rm{\theta }}$), the truss member diameter, D, and the film thickness, t. In nondimensional form, the geometric parameters are
 $[L/D,t/D,{\rm{\theta }}]$. The design space is bounded by the technological limitations of the fabrication process described in Sec. II. AReference Jacobsen, Kolodziejska, Doty, Fink, Zhou, Roper and Carter22:
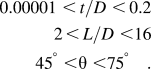 $$\eqalign{ 0.00001\,\, \lt \,t/D \,\,\lt \,0.2 \cr 2\, \lt \,L/D \,\,\lt 16 \cr 45^ \circ\,\, \lt {\rm{\theta }} \,\,\lt 75^ \circ \quad . \cr}$$
Geometry for the hollow-truss pyramidal lattice and variables definition.

Simple geometric considerations provide an analytical value for the relative densityReference Valdevit, Jacobsen, Greer and Carter7:
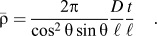 $${{\bar \rho }} = {{{\rm{2\pi }}} \over {\cos ^2 {\rm{\theta }}\sin {\rm{\theta }}}}{D \over \ell }{t \over \ell }\quad .$$
This equation is only accurate to first order in  $D/\ell$ and
 $t/D$ and neglects any mass clipping at the nodes. For relatively stubby members (
 $\ell /D \,\lt\, 10$, this equation can significantly overestimate the relative density, even for extremely lightweight lattices.Reference Godfrey and Valdevit19
The compressive strength along the z direction for an infinite lattice with the topology depicted in Fig. 4 (whether solid or hollow) can be estimated by beam theory considerations. It is essential to note that the lattice in Fig. 4 is not statically determinate; i.e., if the nodes are modeled as pin joints, the structure is a mechanism and would be incapable of supporting any load. The implication is that truss modeling is inadequate to calculate the strength (and/or the stiffness) and, at a minimum, beam modeling should be used instead.
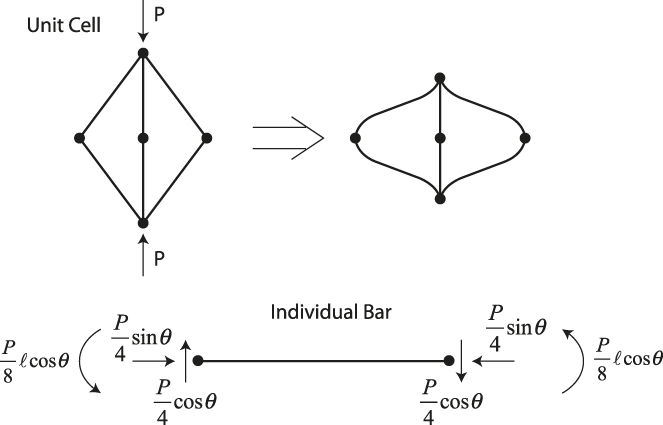
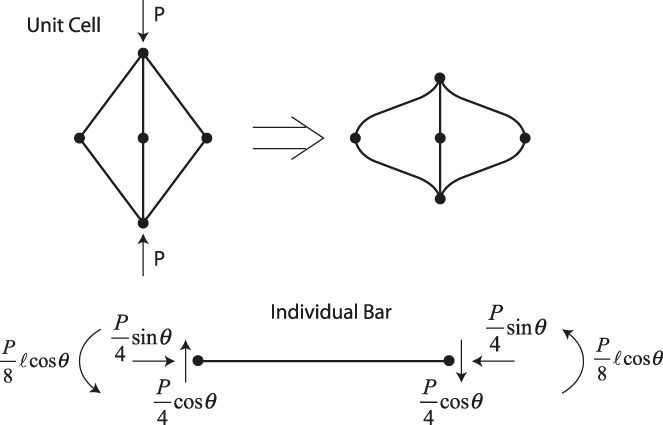
When compressed, a unit cell deforms as schematically indicated in Fig. 5. Each bar is subjected to a uniform compression force and a linearly varying bending moment (maximum at the nodes). From the free body diagram in Fig. 5, the maximum stress in the bar (which occurs at the nodes) is:
 $${\rm{\sigma }}_{\max } = {{M_{\max } } \over I}{D \over 2} + {{P\sin {\rm{\theta }}} \over {4A}} = {{P\ell \cos {\rm{\theta }}} \over {2{\rm{\pi }}D^2 t}} + {{P\sin {\rm{\theta }}} \over {4{\rm{\pi }}Dt}}\quad ,$$
where A and I are the area and the moment of inertia of a bar member, respectively. By equating the maximum stress in the bar to the yield strength of the constituent material,  ${\rm{\sigma }}_{\rm{y}}^{\rm{0}}$, and noticing that the load P acts on a unit cell of area
 $2\ell ^2 \cos ^2 {\rm{\theta }}$ (Fig. 4), the effective yield strength of the lattice can be expressed as:
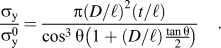 $${{{\rm{\sigma }}_{\rm{y}} } \over {{\rm{\sigma }}_{\rm{y}}^{\rm{0}} }} = {{{\rm{\pi }}\left( {D/\ell } \right)^2 \left( {t/\ell } \right)} \over {\cos ^3 {\rm{\theta }}\left( {1 + \left( {D/\ell } \right){{\tan {\rm{\theta }}} \over 2}} \right)}}\quad .$$
Schematic of deformation of a unit cell under compression and free-body diagram of a single bar.
Collapse by elastic buckling can occur either in global mode (Euler buckling of the whole bar), or locally (shell buckling of the bar walls). Assuming that local buckling occurs when the maximum compressive stress in the bar equates the local buckling stress for a uniformly compressed cylindrical shell,Reference Timoshenko and Gere23 the effective local buckling strength of the lattice can be expressed as:
 $${{{\rm{\sigma }}_{{\rm{lb}}} } \over {{\rm{\sigma }}_{\rm{y}}^{\rm{0}} }} = {{2{\rm{\pi }}\left( {E/{\rm{\sigma }}_{\rm{y}}^{\rm{0}} } \right)\left( {D/\ell } \right)\left( {t/\ell } \right)^2 } \over {\sqrt {3\left( {1 - {\rm{\nu }}^2 } \right)} \cos ^3 {\rm{\theta }}\left( {1 + \left( {D/\ell } \right){{\tan {\rm{\theta }}} \over 2}} \right)}}\quad ,$$
where E, ν, and  ${\rm{\sigma }}_{\rm{y}}^{\rm{0}}$ are the Young’s modulus, the Poisson’s ratio, and the yield strength of the constituent material, respectively. The effective global buckling strength can be estimated by equating the normal force in each bar [the term
 $P\sin {\rm{\theta }}/4$ in Eq. (3)] to the Euler buckling load for a simply supported column, leading to:
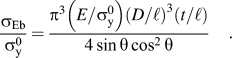 $${{{\rm{\sigma }}_{{\rm{Eb}}} } \over {{\rm{\sigma }}_{\rm{y}}^{\rm{0}} }} = {{{\rm{\pi }}^3 \left( {E/{\rm{\sigma }}_{\rm{y}}^0 } \right)\left( {D/\ell } \right)^3 \left( {t/\ell } \right)} \over {4\sin {\rm{\theta }}\cos ^2 {\rm{\theta }}}}\quad .$$
The actual effective buckling strength is the minimum of the Euler (global) and local buckling strength. For the range of angles and member aspect ratios under consideration (θ = 45–75°,  $\ell /D = 2 - 16$), the ratio of the buckling strengths is
 ${\rm{\sigma }}_{{\rm{lb}}} /{\rm{\sigma }}_{{\rm{Eb}}} = {\rm{\alpha }}(t/D)/(D/\ell )$, with
 ${\rm{\alpha }}\sim1$. Hence local buckling prevails when
 $t/D \,\lt\, D/\ell$. Comparing the effective yield strength [Eq. (4)] with the effective local buckling strength of the lattice [Eq. (5)], we see that lattices are buckling dominated when
 $t/D \,\lt\, {\rm{\sigma }}_{\rm{y}}^{\rm{0}} /E$. Hence the condition for Euler (global) buckling is
 $D/\ell \lt t/D \,\lt\, {\rm{\sigma }}_{\rm{y}}^{\rm{0}} /E$; for the material and truss member aspect ratios under consideration in this study (
 ${\rm{\sigma }}_{\rm{y}}^{\rm{0}} /E = 0.0125,D/\ell > 0.0625$), this condition is never satisfied and Euler buckling of the truss members is never an active failure mechanism. Hence, the effective compressive strength of the lattice is defined as the minimum of its effective yielding and local buckling strengths.
Although this model captures the global mechanical behavior of the truss members (assuming that they are slender), it ignores the details of the nodal geometry, the mechanical deformation at the nodes and the local wall deformation. To fully capture all these effects, geometrically nonlinear finite element (FE) analyses of very detailed meshes become necessary.
B. Finite-element modeling of yielding and buckling strength
1. Geometry modeling and meshing
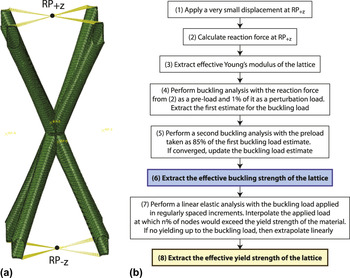
Unit cell meshes are parametrically generated with a geometry modeling and meshing algorithm previously developed.Reference Godfrey and Valdevit19 Some details are provided in the Appendix. To mimic the fabrication process as closely as possible, while still retaining a general geometric description, truss members are connected by fillets with a spatially variable radius, r f (0.1 < r f/D < 0.5). 3D imaging and geometry reconstruction of actual lattices would obviously provide a much more accurate geometric representation, but extracting a parametric description suitable for optimization studies would require an extensive experimental investigation that is beyond the scope of this work. Shell elements were used throughout, given the very low t/D ratio for the lattices of interest. An example of a generated unit cell mesh is depicted in Fig. 6(a).
(a) Example of unit cell mesh with schematic depiction of the boundary conditions imposed in the FE simulations: nodes connected by yellow lines are coupled to their respective reference node (RP±z) in all rotational degrees of freedom. Additionally, nodes connected to RP±z are coupled in the z-displacement degree of freedom. Vertical (z) displacements are specified at reference point RP±z, whereas reference point RP±z is maintained at z = 0. (b) Flowchart for the automatic extraction of buckling and yield strength of lattices.

2. Boundary conditions
Although single unit-cell models are desirable over entire sample models, both for elegance and computational efficiency, the choice of appropriate boundary conditions is critical to ensure results that are applicable to multiple-cell samples and hence facilitate comparison with experimental results. Ultra-light lattices experience local buckling and/or partial fracture at nodes soon after contact with the loading platens is established.Reference Torrents, Schaedler, Jacobsen, Carter and Valdevit16 The implication is that the constraining effect of neighboring cells on each given unit cell (both against translation and rotation) is potentially greatly reduced. To simulate this behavior and reduce the rotational constraints at the nodes, all nodes on the ±x and ±y faces on the unit cell are left free, leaving only the following constraints: (i) the nodes on the −z face were constrained from moving in z but allowed to move along x and y; (ii) the nodes on the +z face were subject to a downward displacement or force; (iii) all rotations were prevented at all nodes on the ±z faces [Fig 6(a)]. This boundary condition represents the mechanical response of a single isolated unit cell forced to maintain planar and nonrotating top and bottom faces, but otherwise unconstrained on its sides. Although the resulting deformation field is not rigorously compatible with a periodic structure, the excellent agreement with experimental results over the entire density range will justify its use.
For all simulations, isotropic linear elastic properties were used (with E s = 210 GPa, ν = 0.3) and geometrically nonlinear (large deformation) analyses were performed to capture local wall deformations and rotations.
3. Analysis flowchart
Extraction of effective yielding and buckling strength of the lattice were performed with the fully automatic process described in the flowchart in Fig. 6(b). A small displacement δz is applied to the face +z (corresponding to a lattice-level strain,  ${\rm{\bar \varepsilon }}_z = - 0.001\%$) and the corresponding reaction force F R is extracted from the simulations. The minute magnitude of the applied strain is necessary to ensure convergence for all lattices in the design space and remove the effect of geometric nonlinearities. After calculating the effective Young’s modulus of the lattice in the z direction as:
 $E = (F_{\rm{R}} /L^2 )/({\rm{\delta }}_z /H)$, with L and H the dimensions of the unit cell, a new simulation is started with the force F R applied to the +z face. A small fraction (1%) of F R is applied as a perturbation load, and a linear perturbation analysis is executed to extract the first eigenvalue. From this, a first estimate of the effective buckling strength of the lattice is obtained. A second perturbation analysis is run with a higher preload (85% of the first buckling estimate) to embed potential geometric nonlinearities in the base state. If the second simulation converges, its results are used to extract the effective buckling strength of the lattice; otherwise, the first estimate is used. To extract the yield strength, a fourth quasi-static elastic simulation is performed with the previously calculated buckling load applied to the structure in a fixed number of increments. The results are automatically analyzed and interpolated to determine the applied load resulting in n% of nodes exceeding the prescribed material yield strength (
 ${\rm{\sigma }}_{\rm{y}}^{\rm{0}}$ = 2.5 GPa). In the following results, n = 0% (first node yielding) and n = 5% are used. If buckling precedes yielding, the effective yield strength is linearly extrapolated from the largest applied load. Finally, the effective lattice strength is extracted as the minimum of the effective buckling and yielding strengths.
Although this approach might seem cumbersome for individual analyses, it does speed up their executions; even more importantly, it is essential to map entire design spaces in a fully automatic fashion (see Sec. IV).
C. Results
The approach detailed in Sec. III. B is demonstrated on a series of eight lattices, with identical truss angle (θ = 60°) and aspect ratio ( $\ell /D = 6$) and relative densities spanning three orders of magnitude (from 0.03 to 8%). Both buckling and yielding strengths were calculated, with the latter defined as first-node yielding and yielding of 5% of the nodes. The results are depicted in Fig. 7. Note that the model predicts power-law relationships between strength and density with exponents of ∼1.5 for yielding and ∼2.5 for buckling. For this choice of lattice angle, member aspect ratio and material properties, the model predicts a buckling-to-yielding transition at a relative density of ∼0.2%. This is consistent with experimental results presented in Fig. 3 (where the sample at 0.19% relative density fully recovers from a 50% compressive strain, whereas the sample at 0.54% shows significant plasticity). The insets in Fig. 7 depict the unit cell buckling modes for the two lightest samples. Note that buckling is localized at the nodes, consistently with the discussion in Sec. III. A. A more accurate validation of the numerical model is illustrated in Fig. 8. The red markers represent a collection of experimental results (including samples from Table I), obtained on lattices with nominally identical truss angle (θ = 60°) and member aspect ratios,
 $\ell /D\sim 6$. The solid curves are reproduced from the power-law fits of the numerical calculations in Fig. 7, for samples of the same nominal geometry (
 $\ell /D = 6$). Note the excellent agreement throughout the entire density range; both the strength values and the buckling-to-yielding transition density are captured with good accuracy. For comparison, the prediction of the analytical model (Sec. III. A) for a constant member aspect ratio (
 $\ell /D = 6$) are reported as dashed lines. The analytical model consistently overpredicts the strength and the transition density, both by as much as an order of magnitude. The explanation for this disagreement is that the beam-theory-based analytical model ignores local deformation at the hollow nodes and overestimates their rigidity, overconstraining the deformation of the truss members. This implies that accurate geometrical modeling of the unit cell (as enabled by the careful meshing described in Sec. III. B. 1 and in the Appendix) is essential to capture the mechanical response of thin-walled hollow lattices. Although the accuracy of the analytical model would increase as the slenderness of the lattice members is increased, optimal design studies (Sec. IV) will reveal that stubby members are mechanically more efficient.
Results of FE calculations automatically executed with the modeling procedure depicted in Fig. 6(b). Eight different unit cells were modeled, all at a constant truss member aspect ratio ( $\ell /D = 6$) and cell angle (θ = 60°). The wall thickness was adjusted to span almost three decades in relative density. For each unit cell, both yielding (at first integration point and at 5% of integration points) and buckling strengths are extracted. For each unit cell, the failure strength is the lowest of the two. The model predicts a buckling-yielding transition at
 ${{\bar \rho }}\sim0.2\%$. The insets depict the dominant local buckling modes for the lowest density samples.

Comparison of analytical [Eqs. (4) and (5)] and numerical (Fig. 7) predictions for the relatively compressive strength of hollow lattices. The markers represent experimental measurements for samples with aspect ratio  $\ell /D\sim6$ and angle θ = 60°. These parameters are assumed constant in both the analytical and numerical models. Note that the analytical models greatly overestimate the strength and the buckling, yielding transition density, whereas these quantities (as well as the strength/density scaling) are very well captured by the numerical model for the entire range of relative densities.

IV. OPTIMAL DESIGN FOR STRENGTH
A previously derived numerical platform (see Appendix) was used to parametrically generate thousands of lattice meshes and automatically interface with the commercial FE code ABAQUS to extract yielding and buckling strengths as indicated in the flow-chart discussed above [Sec. III. B. 3 and Fig. 6(b)]. The entire design space in Eq. (1) was sampled. Results for lattices with θ = 60° are depicted in Fig. 9(a), where the strength of the lattice is plotted against the aspect ratio of the member for a number of different relative densities. A comparison with analytical predictions based on Eqs. (2)–(5) [Fig. 9(b)] allow immediate identification of nontrivial node effects. According to the analytical model, the yield strength decreases with increasing member aspect ratio (at a constant relative density), whereas the buckling strength (governed by local buckling) is insensitive on the member aspect ratio. In the yielding regime, the numerical trends agree with the analytical ones (albeit the actual values differ, as noted above), with the exception of very low aspect ratios, where the beam theory models obviously become inadequate. In the buckling regime, the numerical simulations reveal a more nuanced behavior. The buckling strengths at  $\ell /D = 3$ and
 $\ell /D = 16$ are generally quite similar, but a deep minimum appears in the middle. As the relative density is increased, this minimum shifts to lower
 $\ell /D$. Note that this phenomenon is entirely absent from the analytical predictions, justifying the development of the numerical package described in the Appendix. According to the numerical simulations, the smallest achievable aspect ratio (
 $\ell /D \,\lt\, 4$) is optimal for nearly all relative densities under consideration.
(a) Numerical and (b) analytical prediction of the compressive strength of lattices with angle θ = 60° as a function of the member slenderness ratio,  $\ell /D = 6$ and relative density of the lattice. The compressive strength is defined as the minimum between the yield and buckling strength. All the data for (a)—1000 s of simulations—were generated parametrically in a fully automatic fashion, using the computational tool described in Appendix A. The dots represent buckling-to-yielding transitions on specific density contours.

The same numerical results can be plotted in the design maps of Fig. 10 [high density regime in Fig. 10(a) and lower density regime in Fig. 10(b)]. Each point in the map corresponds to one specific lattice design (the angle is kept constant at 60°), and contours of relative strength and relative density are plotted. As ultra-light lattices are extremely imperfection sensitive, the buckling contours occasionally show unphysical oscillations. These have been removed from the map in Fig. 10(b). The relative strength, defined as  ${\rm{\sigma }}_{\rm{c}} /{\rm{\sigma }}_{\rm{y}}^{\rm{0}} {{\bar \rho }}$, with
 ${\rm{\sigma }}_{\rm{c}} = \min \{ {\rm{\sigma }}_b ,{\rm{\sigma }}_{\rm{y}} \}$, is a measure of the mechanical efficiency of the lattice. As a reference, the theoretical relative strength for a stretching-dominated octet hollow lattice at the same truss angle (ignoring node deformations) is 0.55, independent on the actual design or the relative density.Reference Deshpande, Fleck and Ashby8 The design map clearly shows that hollow lattices are most efficient at relatively high densities and very low member aspect ratios, and rapidly loose efficiency as the density is reduced or the members are made more slender. This is a natural consequence of the bending dominated architecture, which results in a strength/density scaling with exponent larger than 1 (see Fig. 8). Note, though, that a 60° lattice with stubby members (
 $\ell /D = 3$) and a relative density of 10% (resulting in a relative strength of 0.24) is only 50% less efficient than an analogous stretching dominated lattice. In general, the map in Fig. 10 can be used as a design tool: for a given relative density target and a truss angle of 60°, Fig. 10 allows immediate identification of the strongest design.
Design map for nickel hollow lattices subjected to uniaxial compression. (a) High density region and (b) low density region. The numerically generated data are the same as in Fig. 9. The lattice angle is kept at θ = 60° for all lattices, whereby the combination of cross-section aspect ratio (t/D) and member aspect ratio ( $\ell /D$) fully define the lattice geometry. Contours of relative density and relative strength (defined as
 ${\rm{\sigma }}_c /{\rm{\sigma }}_{\rm{y}} {{\bar \rho }}$, with
 ${\rm{\sigma }}_c = \min \{ {\rm{\sigma }}_b ,{\rm{\sigma }}_{\rm{y}} \}$) are reported. Note that the relative strength is not constant in the entire design space, as it would be for stretching dominated architecture. For these hollow lattices, the highest achievable mechanical efficiency is 0.24 (compared to 0.55 for the stretching dominated octet lattice) and occurs at
 $\ell /D\sim3$ and
 $t/D\sim0.08$.

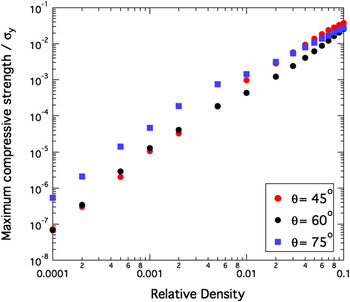
Qualitatively similar maps can be produced for different lattice angles. The effect of the lattice angle on the maximum achievable performance of hollow lattices is displayed in Fig. 11. Each data point on this chart represents the strongest lattice at a given angle and at a given relative density (for the 60° lattice, each data point is the maximum of a curve in Fig. 9). Note that the effect of the angle is not intuitive: steeper lattices are optimal at low relative densities (at a relative density of 0.01%, an optimized 75° lattice is almost an order of magnitude stronger than an optimized 60° lattice), whereas the difference vanishes at higher densities (at 10% density, 45° lattices are minimally more efficient than steeper lattices). By contrast, the effect of the truss angle on strength is monotonic: lattices with steeper angles are always stiffer, at any relative density.Reference Godfrey, Schaedler, Jacobsen, Carter and Valdevit20
Maximum achievable compressive strength as a function of relative density, for various lattice member angles. Note that steeper angles are significantly more efficient at low relative densities, whereas a 45° lattice is stronger (albeit not by much) at relative densities higher than ∼3%.

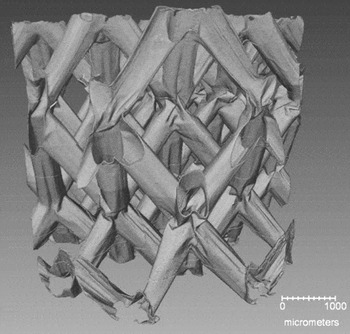
X-ray tomography image of a nickel microlattice (L = 2 mm, D = 550 µm, t = 1 µm) obtained in situ under a compressive strain of ∼10%. Note that the deformation is localized at the nodes, whereas the hollow truss elements display minimal straining. Image courtesy of Brian M. Patterson, Los Alamos National Laboratory.

V. THE ROLE OF THE HOLLOW NODES
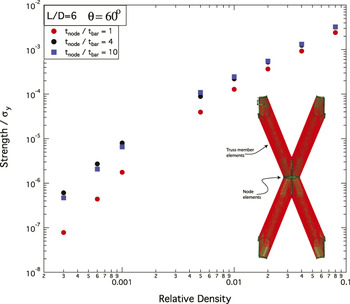
In Sec. III. C, the difference between the analytical and numerical strength predictions (Figs. 8 and 9) was largely attributed to nodal deformation and failure modes (obviously absent in beam-theory-type analyses). The x-ray tomography image of a nickel microlattice (Fig. 12), obtained in situ under a compressive strain of 10%, provides unquestionable experimental evidence for this hypothesis. Note that nearly all the deformation is concentrated at the nodes, with the lattice bars essentially unloaded. This suggests that one efficient approach to increase the strength of hollow lattices involves techniques that strengthen the nodes, hence raising their bending and buckling strengths. This concept is explored numerically in Fig. 13. The elements depicted in green were assigned a thickness,  $t_{{\rm{node}}} = kt_{{\rm{bar}}}$, with k = 1, 4, and 10. For each choice of the parameter k, the strength of the lattice was calculated as a function of its relative density. The choice of the “belt-shaped” thick node region was chosen purely based on algorithmic simplicity. For the sake of illustration, the aspect ratio and the truss angle were kept constant (
 $\ell /D = 6$ and θ = 60°) for all calculations. Note that very low relative densities (i.e., at very low t/D ratios), node-strengthened lattices are almost one order of magnitude stronger than uniform thickness lattices. This effect is not linear in k: a 4-fold increase in the node thickness is almost as effective as a 10-fold increase. Not surprisingly, this effect is reduced drastically as the density is increased (and the failure mode switches from buckling to yielding). Although the reinforcement topology depicted in Fig. 13 is obviously impractical, these preliminary assessments indicate that significant strength improvements can be achieved by ingenious node design. The practical implementation of such designs is currently under investigation.
Structural efficiency of hollow metallic lattices with functionally graded wall thickness. For these simulations, the thickness of the elements around the unit cell nodes (green elements) is larger than elsewhere in the unit cell (red elements). Aspect ratios of the member and lattice angle are kept constant. Note that thickening the nodes has a dramatic effect on strength, particularly at very low densities. This is consistent with the deformation behavior illustrated in Fig. 12.

VI. CONCLUSIONS
A novel scalable manufacturing approach for hollow microlattices has recently been presented.Reference Schaedler, Jacobsen, Torrents, Sorensen, Lian, Greer, Valdevit and Carter15,Reference Torrents, Schaedler, Jacobsen, Carter and Valdevit16 This technique allows control of the relative density of the lattice over a very wide range (from ∼0.01 to ∼20%), enabling the exploitation of ultra-strong nanocrystalline films in a topologically organized cellular material. This article presented an experimentally validated numerical protocol for the modeling and optimal design of hollow microlattices, optimized for maximum compressive strength. Simple analytical expressions based on axial and bending deformation of the members are sufficiently accurate at relatively high densities, but their inherent inability to capture nodal deformation results in dramatic strength over-predictions for ultralight hollow lattices. A recently developed modeling platform consisting of three interconnected tools (a geometric modeling and meshing algorithm, a data management system, and an interface for automatic communication with a commercial FEs package) was used to address this deficiency, resulting in fast and accurate modeling of a very wide design space. Figure 14 presents the envelope of all feasible designs, overlaid with the universe of existing materials. Note that 3 decades of density and 6 decades of strength are achievable with the same manufacturing approach and base material (nano-crystalline nickel).
Compressive strength/density materials property space illustrating the performance of all nickel hollow microlattice designs achievable within the parameter space in Eq. (1). Note that the same manufacturing process enables spanning 3 decades in density and 6 decades in strength, achievable simply by modifying the geometric parameters  $\ell /D$
 $t/D$, and θ.

Optimal design maps were produced, which rapidly identify the most mechanically efficient hollow lattice design for any choice of relative density. Two key results emerged: (i) at relatively high densities (∼10%), hollow lattices with stocky members ( $\ell /D\sim3$) are only 50% less mechanically efficient than optimal stretching-dominated octet trusses; (ii) for ultra-light designs, strengthening the nodes (e.g., by locally increasing the wall thickness) can raise the mechanical efficiency by nearly an order of magnitude over uniform wall designs. The technological feasibility of such topological modifications is currently under investigation. Further improvements can be achieved by adopting different base materials (e.g., diamond). Even without such modifications, the optimally designed hollow nickel microlattices described in this work display superior strength at densities lower than 100 kg/m3.
ACKNOWLEDGMENTS
The authors are indebted to J.W. Hutchinson for a number of fruitful discussions. The authors would like to thank Brian M. Patterson, Los Alamos National Laboratory, for his x-ray tomography analysis of a microlattice. This work was supported by DARPA under the MCMA program managed by Dr. Judah Goldwasser (Contract No. W91CRB-10–0305).
APPENDIX: ARCHITECTURE OF THE COMPUTATIONAL PLATFORM
All the FEs calculations described in this work were generated with the recently developed PMAT.Reference Godfrey and Valdevit19,Reference Godfrey, Schaedler, Jacobsen, Carter and Valdevit20 This modeling platform consists of three interconnected tools: (i) a geometric modeling and meshing algorithm, (ii) a data management system, and (iii) an interface for automatic communication with a FEs package (Abaqus, in the current implementation). The entire platform is almost completely parameterized and automated, with minimal input required from the operator. Input parameters include the cellular lattice topology (e.g., a periodic pyramidal lattice), the space of design parameters (e.g., the allowable ranges of each dimension, possibly interdependent), the objective function, and the constraints. The PMAT code may be designed to sample the entire parameter space (as in its current implementation) or include a family of discrete optimizers; the code identifies the specific designs to be modeled, automatically generates representative geometries and meshes as appropriate, creates input files for FE execution, controls the FE job submissions, extracts results from the FE output files, and handles the results.
Code architecture
The architecture of the entire code is schematically depicted in Fig. A1. Colored boxes represent cohesive system components or modules. Double-boxes represent process boundaries and are effectively single executable programs. Single square boxes denote complicated multiobject systems and rounded boxes represent single objects; stacks represent arrays of either. The Database Manager provides a user interface for interacting with loaded databases and preparing simulations for operation. For systematic exploration of the parameter space (which is the operation described in Sec. IV), the databases are created with a number of constants describing the structure (topology, angle, fillets, defect type, defect magnitude, material) while leaving two dimensionless unknowns to be swept: L/D and t/D. Each of these databases contains an array of Database Part objects, each of which corresponds to a discrete L/D value. Each Database Part object includes a quadratic optimizer that calculates t/D to match a prescribed relative density to a high degree of precision. With each t/D value, a Database Entry is constructed, which is a fully described design corresponding to a particular density within the database. Each Database Entry object has an arbitrary number of Database Boundary Property objects associated with it. Each Boundary Property contains the formal description of a particular class of simulations relating to that design, e.g., boundary conditions, lattice dimension, element type, and property of interest. Simulation results reside here, including stresses, strains, reaction loads, elastic/shear moduli, eigenvalues, predicted buckling loads, etc.
Schematic of the PMAT code architecture.

The Network Interface Management System (STORM) is a highly threaded object that manages inbound clients (e.g., the commercial FE package ABAQUS) and acts as an interface layer between the Data Management System and the simulation application. When being prepared for operation, each Database triggers all its designs (Database Entry objects) to generate a set of related analysis jobs (STORM job objects). Each job corresponds to a discrete simulation and contains information on its identity (session and job number, type) as well as pointers in memory for where to find and where to put relevant information (e.g., the design of interest, boundary conditions, and results). To enable more complex simulations and dependencies, each job may link to other jobs and other resources on disk. The STORM Server communicates with FE analysis packages through TCP/IP protocol. Administrative interaction with the STORM Server is enabled by a STORM Network Controller, which merely acts as a remote user interface. Dedicated modules can be written to optimize the interaction with commercial packages. For the case of the FE package ABAQUS, two modules are implemented: (i) The STORM CAE Client, written in Python and executed within CAE, is responsible for communicating availability to the STORM Server, receiving job data, initiating and monitoring simulations, then analyzing and returning results to the server. (ii) The STORM HYDRA Client is a multirole tool for managing ABAQUS CAE, including an interface for programming the clients behavior, initiating an appropriate number of client processes, and the monitoring and respawning of new clients as necessary. This also allows for rudimentary manual load-balancing and license management of the system when job types of different performance characteristics are available for execution. The STORM Server handles and processes all STORM jobs. Once the STORM Client (e.g., ABAQUS) confirms resource availability (in terms of computational power and licenses), the STORM Server selects one job from the queue and, through the STORM Particle interface, retrieves the database entry associated with it (containing all the geometric information), adds the requested Database Boundary Properties (lattice dimension, boundary conditions, etc…), and invokes the geometry engine (described above) to create a suitable mesh and an a properly formatted input file for ABAQUS analysis. The input file is then sent to the ABAQUS Client via TCP/IP, and the result of the analysis is stored back into the Database Entry after completion. This process is schematically represented by the arrows in Fig. A1.
Geometric modeling and meshing
This component of the modeling platform (contained in the geometry kernel) is responsible for parametric generation of solid and/or shell geometries and their adequate meshing for FE analysis. Conceptually, this operation is carried out in five subsequent steps: (i) definition of lattice points; (ii) definition of nodal connectivity (members locations); (iii) member profiling (the cross-section of each lattice bar has been assumed uniformly circular in this work, but more complex sections are possible); (iv) generation of fillets and smooth member connections (the most mathematically intense section of the code, where complex surfaces simultaneously tangent to all truss members are created); and (v) meshing and assembly of the lattice (Fig. A2). The mathematical details are omitted for the sake of conciseness (see Ref. Reference Godfrey, Scherson and Valdevit18 for details).
Sequence of steps in the geometric modeling platform. (a) Lattice points definition. (b) Truss members definition (nodal connectivity). (c) Truss member profiling. (d) Generation of fillets and smooth member connections. (e) Assembly and meshing.