Introduction
Olivenite, Cu2(AsO4)(OH), is the only mineral among those of the olivenite group (see Gaines et al., Reference Gaines, Skinner, Foord, Mason and Rosenzweig1997 for the new Dana classification) showing a P21/n crystal structure at room temperature, although characterized by a monoclinic angle close to 90° (Toman, Reference Toman1977; Burns and Hawthorne, Reference Burns and Hawthorne1995; Li et al., Reference Li, Yang and Downs2008). All other minerals of the group, which comprises several arsenates and phosphates, such as adamite, libethenite, eveite, zincolivenite, zincolibethenite and auriacusite, crystallize in the orthorhombic Pnnm space group (Huminicki and Hawthorne, Reference Huminicki, Hawthorne, Kohn, Rakovan and Hughes2002; Mills et al., Reference Mills, Kampf, Poirier, Raudsepp and Steele2010 and references therein).
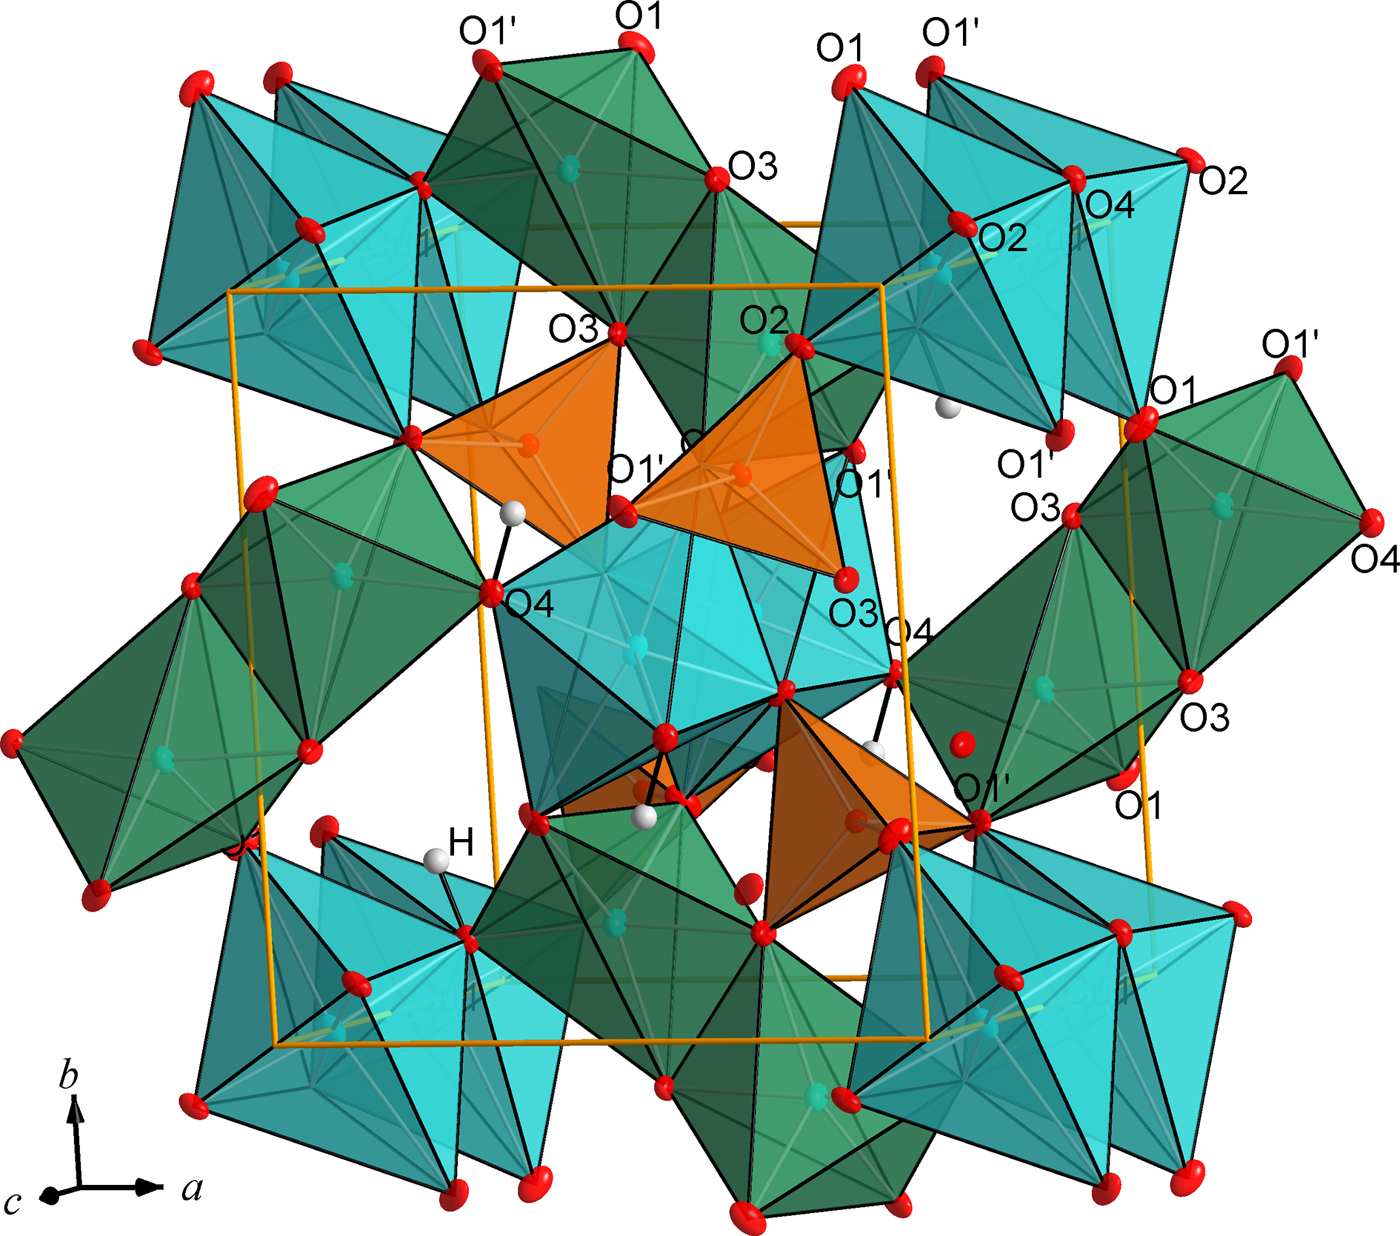
In their crystal structure, two sites, having, respectively, distorted octahedral and trigonal bipyramidal geometries, are typically occupied by divalent cations; auriacusite is the only member in this mineral family showing a cation in the trivalent state, hosted in the site with trigonal bipyramidal geometry and electrostatically balanced by the absence of the hydroxyl group (Mills et al., Reference Mills, Kampf, Poirier, Raudsepp and Steele2010). Octahedra share edges to form straight chains along c. Such chains are cross-linked by isolated PO4 or AsO4 tetrahedra via corner-sharing, thus forming an open network with channels extending in the c direction. Trigonal bipyramids share an edge to form dimers, which lie in these channels. Dimers are connected to octahedra chains and to tetrahedra by corner-sharing. A hydroxyl group is shared by two octahedral and one trigonal bipyramidal coordinated ions. In the monoclinic structure of olivenite (Fig. 1), the pairs of O1 oxygen atoms (in the orthorhombic labelling scheme) taking part in the coordination of all three polyhedra become symmetry-independent and will hereafter be labelled as O1 and O1’.
Perspective view of the crystal structure of olivenite. Thermal ellipsoids are plotted at 50% probability level. Light blue: Cu(1) octahedra forming straight chains along c; green: Cu(2) trigonal bipyramids forming isolated dimers occupying channels running along c; orange: As tetrahedra. Hydrogen atoms are reported in grey.

It has been proposed that the monoclinic symmetry of olivenite is a consequence of the Jahn-Teller effect involving Cu2+ in an octahedral ligand-field, whereby electron-phonon coupling lowers the symmetry of the structure (Toman, Reference Toman1977). On cooling, libethenite, Cu2(PO4)(OH) undergoes a second order structural phase transition to the P21/n symmetry at 160 K, as revealed by Belik et al. (Reference Belik, Naumov, Kim and Tsuda2011) from in situ low-temperature powder synchrotron X-ray diffraction (XRD) data collected on crushed synthetic crystals, single-crystal XRD at different temperatures, specific heat measurements and Raman spectroscopy. The authors suggested that the P21/n-to-Pnnm transition is a general feature of the olivenite-group compounds. However, the Zn octahedron in the adamite structure also shows a (4 + 2) distortion, with four short equatorial anions and two long apical anions. Such a distortion, which is characteristic of octahedrally coordinated Cu2+, cannot be ascribed to an electronic driving mechanism in the case of Zn2+, but rather seems to be an intrinsic property of the adamite arrangement, driven by local bond-valence requirements and connectivity restrictions. This indicates that this basic structural arrangement has an intrinsic tendency to distort in a direction similar to that required for local Jahn-Teller distortion if Cu2+ replaces Zn2+, as already pointed out by Burns and Hawthorne (Reference Burns and Hawthorne1995).
The high-temperature (HT) structural behaviour of minerals of the olivenite group has been characterized by in situ HT single-crystal X-ray diffraction (SC-XRD) for libethenite, Cu2(PO4)(OH) (Zema et al., Reference Zema, Tarantino and Callegari2010) and adamite, Zn2(AsO4)(OH) (Zema et al., Reference Zema, Tarantino, Boiocchi and Callegari2016). Both minerals showed positive and linear expansion up to collapse of the structure due to dehydration starting at ~ 500°C and 400°C for the two minerals, respectively. Anisotropy of axial expansions was found to be stronger in adamite.
In this work, we have studied the structural behaviour of a natural, twinned monoclinic olivenite crystal upon thermal treatment by in situ HT SC-XRD, and characterized the P21/n-to-Pnnm transition, which indeed occurs in olivenite at ~200°C. Crystal structure modifications with temperature have been analysed in terms of symmetry mode decomposition and by the temperature dependences of the spontaneous strains and order parameter associated with the phase transition.
Experimental
SC-XRD study at room temperature
A green, transparent crystal of olivenite from St Day, Cornwall, England sampled from specimen no. 7532 of the Museum of Mineralogy of the University of Pavia, having dimensions 0.41 mm × 0.27 mm × 0.25 mm, was selected for X-ray data collection and structure refinement based on optical and diffraction properties. The selected crystal contained twins [ ${\bar {1}}$00, 0
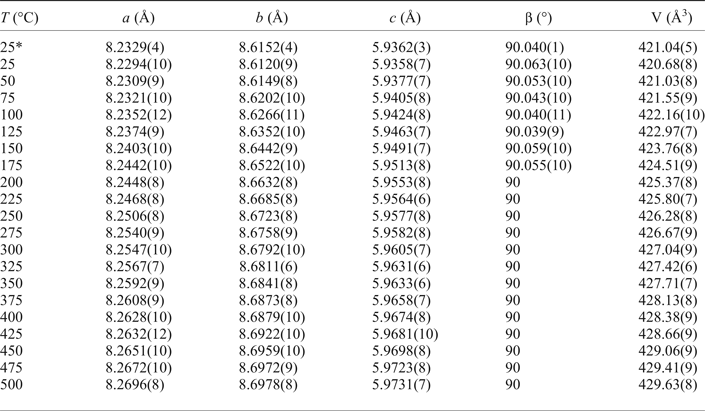
 ${\bar {1}}$0, 001], as is normally the case for olivenite at room temperature (Burns and Hawthorne, Reference Burns and Hawthorne1995). Single-crystal diffraction data were collected at room temperature by means of a Bruker-AXS Smart-Apex charge coupled device (CCD)-based diffractometer, with graphite-monochromatized MoKα radiation (λ = 0.7107 Å) and operating conditions of 50 kV and 30 mA. The Bruker SMART system of programs was used for preliminary crystal lattice determination and X-ray data collection. A total of 2240 ω-rotation frames (scan width: 0.3°ω; exposure time: 10 s/frame; detector-to-sample distance: 40 mm; resolution: 512 × 512 pixels) were collected and processed by the SAINT + software (Bruker AXS). Intensity data were corrected for background, Lorentz and polarization effects. The semi-empirical absorption correction of Blessing (Reference Blessing1995), based on the determination of transmission factors for equivalent reflections, was applied using the Bruker program SADABS (Sheldrick, Reference Sheldrick2003). Final unit-cell parameters were obtained by the Bruker GLOBAL least-squares orientation matrix refinement procedure, based on the positions of 5966 measured reflections with I o > 10σ(I o) and are reported in Table 1. Additional details on RT data collection by the CCD diffractometer are reported in Table 2.
Unit-cell parameters of olivenite at various temperatures.

*CCD data.
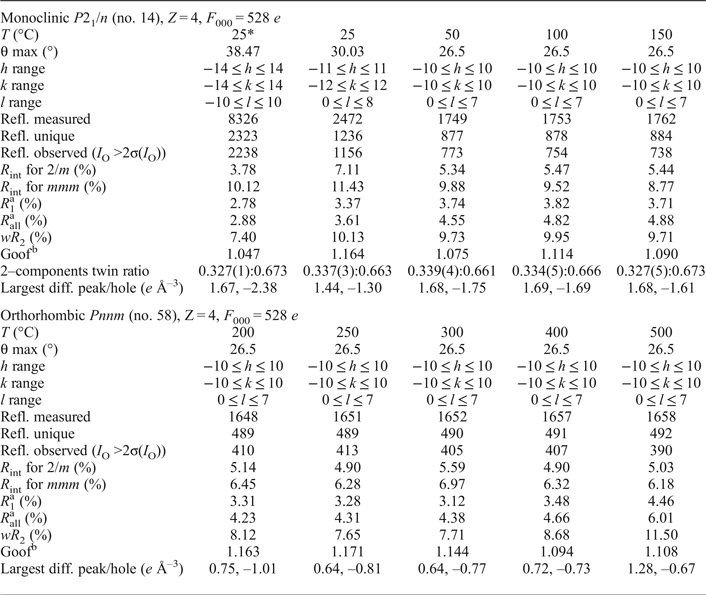
Details of data collection and structure refinements of olivenite at various temperatures.

a R = Σ ||F o| – |F c||/Σ |F o| (R 1 is calculated on reflections with I > 2σI)
b Goof = S = [Σ [w(F o2 – F c2)2]/(n – p)]0.5, where n is the number of reflections and p is the total number of parameters refined.
*CCD data.
SC-XRD at high temperature
In situ HT intensity data were collected on the same crystal used for the RT study using a Philips PW1100 four-circle diffractometer with graphite-monochromatized MoKα radiation, operating at 55 kV and 30 mA. Horizontal and vertical detector apertures were 2.0° and 1.5°, respectively. A home-made U-shaped microfurnace with a K-type thermocouple was used, which has been in use in our lab for over fifteen years on diverse research studies (e.g. Tarantino et al., Reference Tarantino, Zema, Pistorino and Domeneghetti2003; Zema et al., Reference Zema, Tarantino and Montagna2008; Ventruti et al., Reference Ventruti, Zema, Scordari and Pedrazzi2008; Tarantino et al., Reference Tarantino, Giannini, Carpenter and Zema2016). It makes use of a Pt–Pt/Rh resistance, which allows temperatures up to ~1100°C to be achieved, and is equipped with a K-type thermocouple. Temperature calibration (calibration curve R 2 = 0.9994) is undertaken regularly using known melting points of several pure compounds and the transition temperature of quartz (Carpenter et al., Reference Carpenter, Salje, Graeme-Barber, Wruck, Dove and Knight1998a). Reported temperatures are precise to within ±5°C in the whole temperature range. The design of the furnace limits the angular excursion of the ω circle to ~27.5° (sinθ/λ ≈ 0.65 Å–1 with MoKα radiation). As is undertaken routinely for HT measurements using this system, the selected crystal was inserted into a sealed quartz capillary (0.5 mm ϕ) and kept in position by means of quartz wool in order to avoid any mechanical stress.
Unit-cell parameters were measured from RT up to 500°C, in steps of 25°C. At each working temperature, the orientation matrix was updated by centring a selected list of 24 reflections in the range ≈ 7.7–13.8°θ. Accurate lattice parameters (Table 1) were then measured by means of a least-squares routine procedure (Philips LAT) over 43 to 50 d*-spacings, each measured considering all the reflections in the range 3°< θ < 26°.
Complete datasets of diffracted intensities were collected at T = 25, 50, 100, 150, 200, 250, 300, 400 and 500°C using the same operating conditions as reported above. For all datasets, all reflections in the hemisphere of the reciprocal lattice with the l-index positive were measured in the range 2–26.5°θ (2–30°θ for the dataset collected at RT) by the ω/2θ scan mode. Internal discrepancy factors for monoclinic and orthorhombic Laue classes were then checked as one of the indicators of the occurrence of the phase transition (Table 2). During all data collections, three standard reflections were measured every 200 reflections. X-ray diffraction intensities were obtained by measuring step-scan profiles and analysing them by the Lehman and Larsen (Reference Lehman and Larsen1974) σI/I method, as modified by Blessing et al. (Reference Blessing, Coppens and Becker1974). Azimuthal scans were performed in order to correct data for absorption (North et al., Reference North, Phillips and Mathews1968). Some additional details on the HT data collections are reported in Table 2.
Structure refinements
Structure refinements from SC-XRD datasets collected from RT up to 150°C were carried out in space group P121/n1 (no. 14) ITA setting (unique axis b, cell choice 2). The starting model was that of Li et al. (Reference Li, Yang and Downs2008), but the setting was changed (originally refined in P21/n11) in order to preserve a simple relationship with the orthorhombic unit cell after the transition (so that variations in unit-cell parameters show the effect of the phase transition quite clearly), and to be consistent with the structural models of the orthorhombic phases libethenite (Zema et al., Reference Zema, Tarantino and Callegari2010) and adamite (Zema et al., Reference Zema, Tarantino, Boiocchi and Callegari2016). The effects of twinning on the diffracted intensities were taken into consideration; the pseudo-merohedral twinning was considered as a 180° rotation around the c axis and all monoclinic crystal structures were refined as 2-component twins. Datasets collected between 200 and 500°C were refined in space group Pnnm. Indeed, evidence that the monoclinic-to-orthorhombic phase transition has occurred is given by the sharp decrease of the R int values for the mmm Laue class (Table 2) and by the drastic change in the evolution of the unit-cell parameters with temperature (Table 1) starting from 200°C.
All structure refinements were carried out on all reflections by full-matrix least-squares using SHELXL-2014/7 (Sheldrick, Reference Sheldrick2015). Equivalent reflections for the relevant Laue class were averaged, and the resulting internal agreement factors R int are reported in Table 2. The atomic scattering curves for neutral atoms were taken from the International Tables for X-ray Crystallography (Ibers and Hamilton, Reference Ibers and Hamilton1974). For all datasets, all non-hydrogen atoms were refined anisotropically without restraints. The H atom position was located in the difference-Fourier maps, and its coordinates were allowed to ride on the coordinates of its neighbouring O4 atom, whereas its isotropic displacement parameter was fixed at 1.2 times the U eq value of O4 atom. For all structure refinements, structure factors were weighted according to w = 1/[σ2( $F_o^2 $) + (AP)2 + BP], where P = (
 $F_o^2 $ + 2
 $F_c^2 $)/3, and A and B were chosen to produce a flat analysis of variance in terms of
 $F_c^2 $ as suggested by the program. An extinction parameter x was refined to correct the structure factors according to the equation: F o = F c k [1 + 0.001x
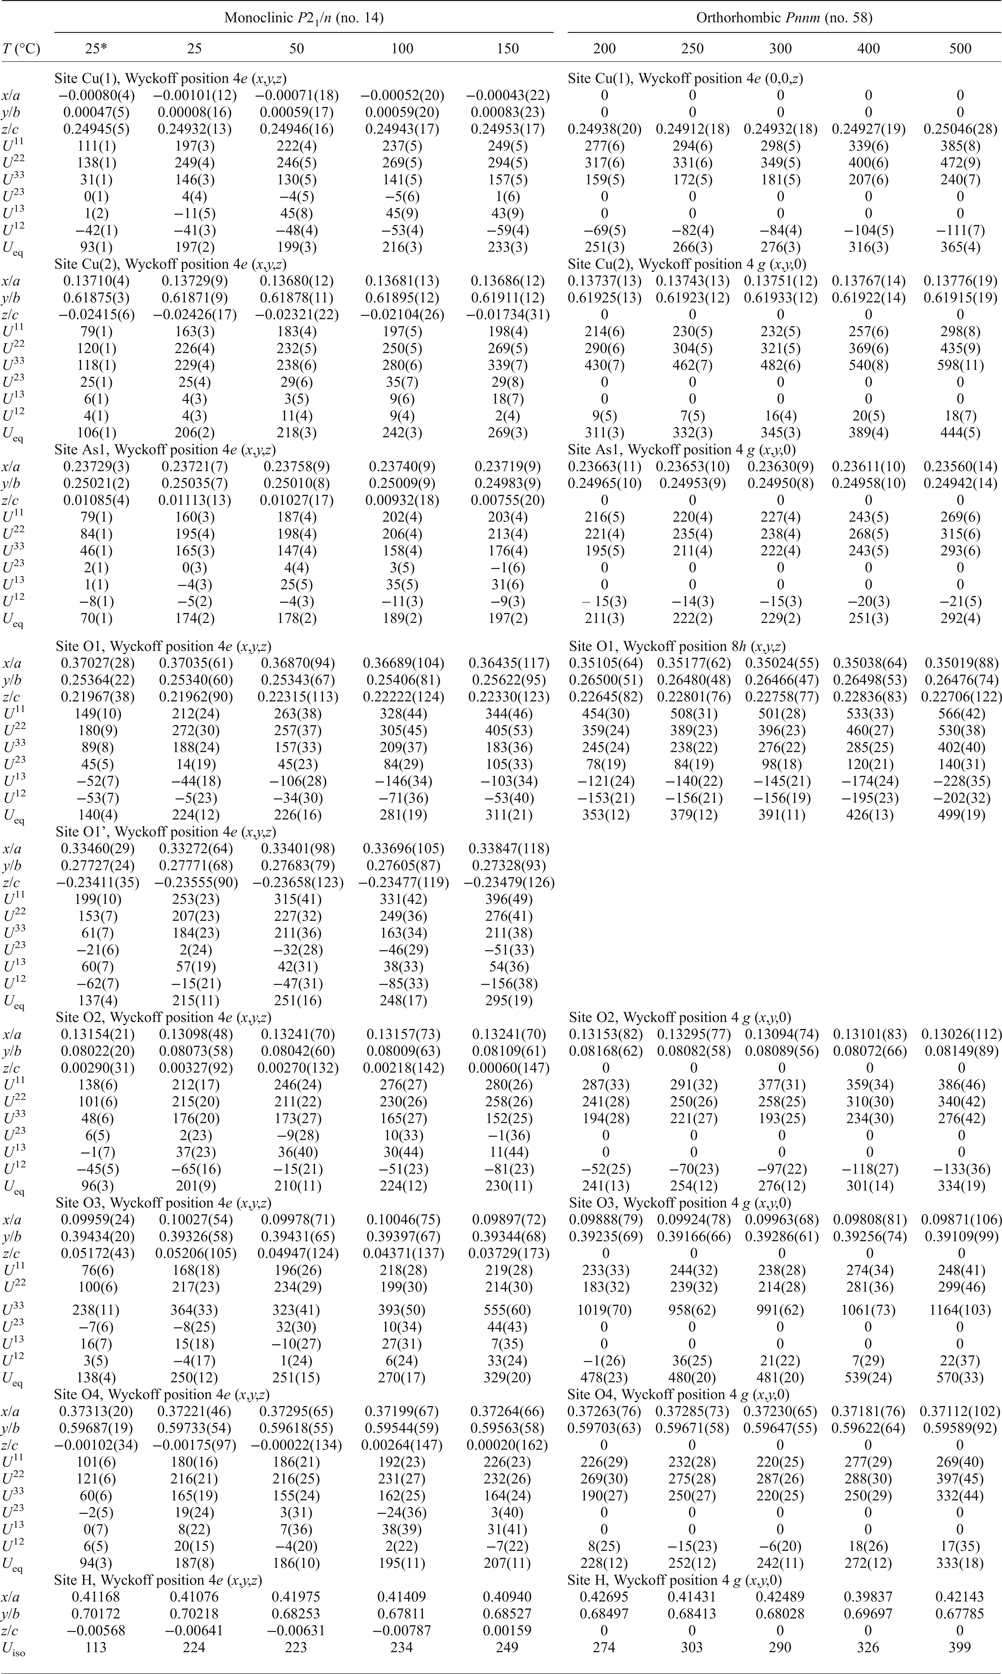
 $F_c^2 $λ 3/sin 2θ]−1/4 (where k is the overall scale factor). All parameters were refined simultaneously. Final difference-Fourier maps were featureless. The values of the conventional agreement indices, R 1 and R all, as well as the goodness of fit (Goof) based on F 2 are reported in Table 2. Fractional coordinates and anisotropic displacement parameters U ij are reported in Table 3, whereas interatomic distances and selected geometrical parameters are reported in Table 4. The crystallographic information files and lists of observed structure factors have been deposited as Supplementary material.
Fractional coordinates, equivalent isotropic (U eq) and anisotropic displacement parameters U ij (Å2 ×10⁴) for olivenite at various temperatures.

Standard deviations are given in parentheses.
*CCD data.
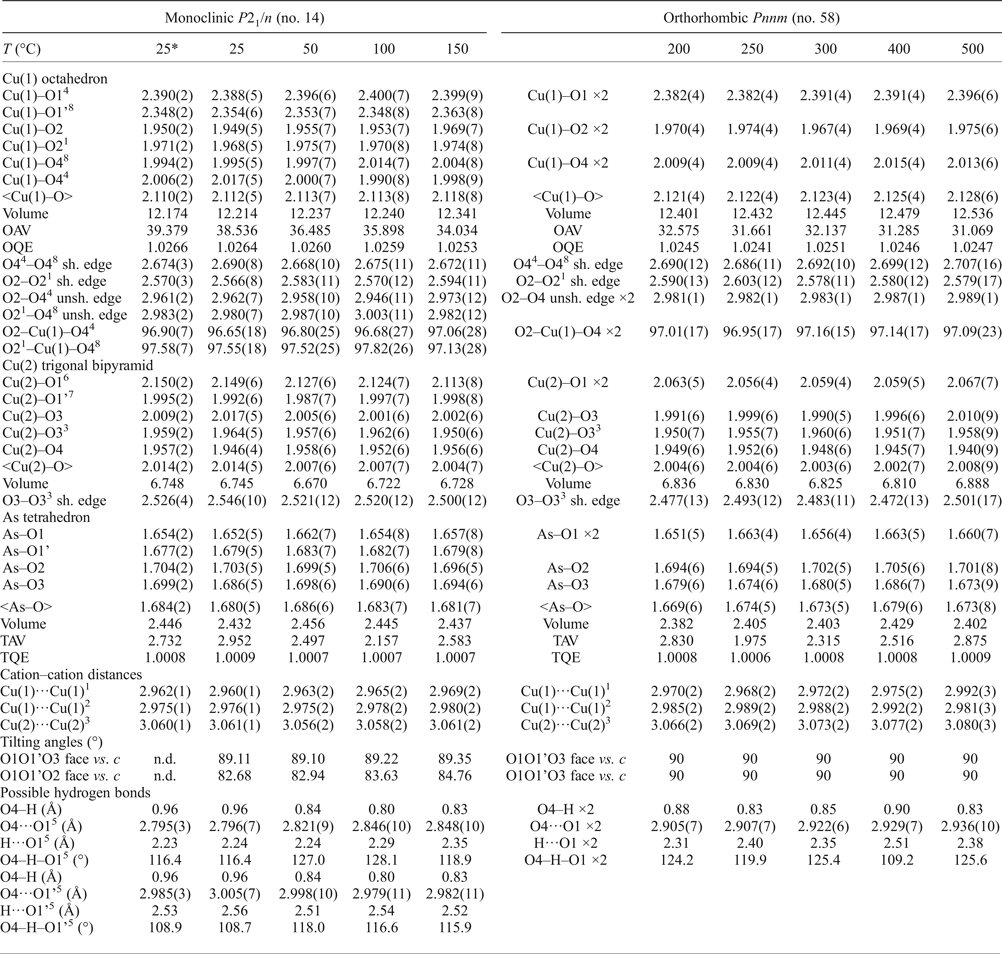
Bond distances (Å), polyhedral volumes (Å3), octahedral and tetrahedral angle variations (OAV, TAV, °˄2, Robinson et al., Reference Robinson, Gibbs and Ribbe1971) and quadratic elongations (OQE, TQE, Robinson et al., Reference Robinson, Gibbs and Ribbe1971), selected bond angles (°), shared and unshared O–O edges (Å), intercationic distances (Å) and features of hydrogen bonds (Å, °) for olivenite at various temperatures.

Standard deviations are given in parentheses. Symmetry codes: (1) –x, –y, –z ; (2) –x, –y, –z + 1 ; (3) –x, –y + 1, –z; (4) –x+½, y–½, –z+½; (5) –x + 1,–y + 1,–z; (6) –x+½, y+½, –z+½; (7) –x+½, y+½, –z–½; (8) x–½, –y+½, z+½.
*CCD data.
Results and Discussion
Unit-cell parameters
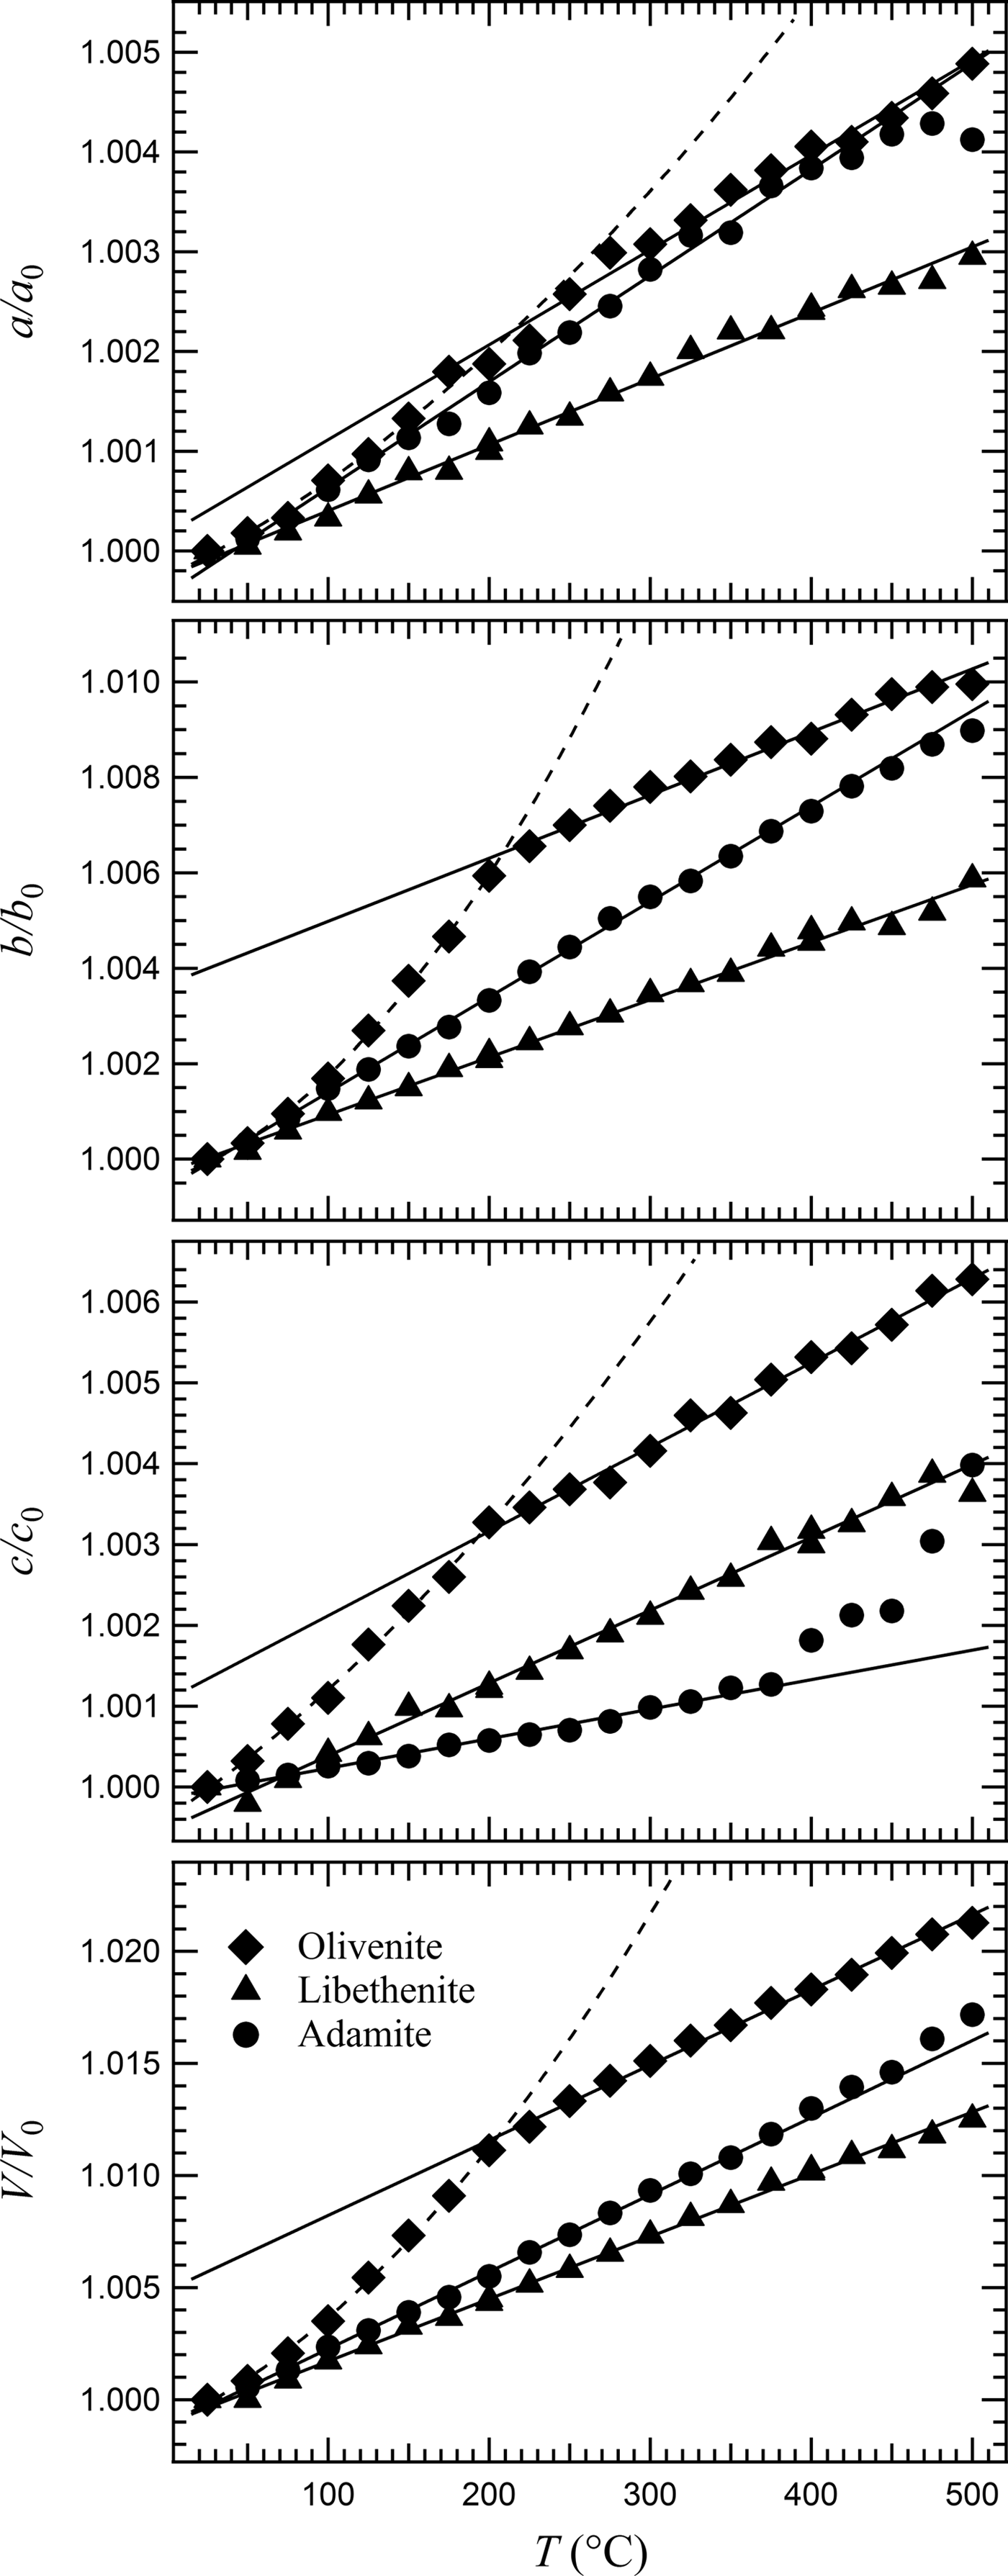
Unit-cell parameters and volume of olivenite are plotted as a function of temperature in Fig. 2. Data for libethenite (Zema et al., Reference Zema, Tarantino and Callegari2010) and adamite (Zema et al., Reference Zema, Tarantino, Boiocchi and Callegari2016) are also reported for comparison. All datasets are normalized to their RT values. The β angles, close to 90° in the monoclinic phase, are not plotted against T as their values are quite scattered.
Variation of unit-cell parameters and volume with temperature for olivenite (diamonds). Data for libethenite (triangles; Zema et al., Reference Zema, Tarantino and Callegari2010) and adamite (circles; Zema et al., Reference Zema, Tarantino, Boiocchi and Callegari2016) are also shown for comparison. Data are normalized to RT values. Linear regressions are calculated in the range 200–500°C for olivenite and 25–400°C for libethenite and adamite, and are reported as solid lines. Polynomial fits for the evolution of unit-cell parameters and volume in the monoclinic olivenite phase are reported as dashed lines.

In the range 25–200°C, monoclinic olivenite shows positive and non-linear axial and volume expansions. Expansion curves were then fitted by a simple second-order polynomial: α(T) = α0 + α1(T‒T 0) + α2(T‒T 0)2 (Fei, Reference Fei and Ahrens1995). Thermal expansion coefficients for cell dimensions and volume in this temperature range are:
 $$\eqalign{\alpha _a &= {\rm} 0.99995\left( 9 \right){\rm} + {\rm} 0.9\left( 2 \right)\cdot 10^{ - 5}\left( {T - T_0} \right){\rm} \cr & \quad + {\rm} 0.2\left( 1 \right)\cdot 10^{ - 7}\left( {T - T_0} \right)^2}$$
 $$\eqalign{\alpha _b &= {\rm} 0.99992\left( 8 \right){\rm} + {\rm} 1.7\left( 2 \right)\cdot 10^{ - 5}\left( {T - T_0} \right){\rm} \cr & \quad + {\rm} 1.0\left( 1 \right)\cdot 10^{ - 7}\left( {T - T_0} \right)^2}$$
 $$\eqalign{\alpha _c &= {\rm} 0.99997\left( 7 \right){\rm} + {\rm} 1.5\left( 2 \right)\cdot 10^{ - 5}\left( {T - T_0} \right){\rm} \cr & \quad + {\rm} 0.2\left( 1 \right)\cdot 10^{ - 7}\left( {T - T_0} \right)^2}$$
 $$\eqalign{\alpha _V &= {\rm} 0.9998\left( 2 \right){\rm} + {\rm} 4.0\left( 4 \right)\cdot 10^{ - 5}\left( {T - T_0} \right){\rm} \cr & \quad + {\rm} 1.4\left( 2 \right)\cdot 10^{ - 7}\left( {T - T_0} \right)^2}$$
where T is expressed in K. It is evident that b is the direction of maximum expansion (b > c > a).
A drastic change in the evolution of unit-cell parameters is observed starting from 200°C. However, no step-like anomaly is observed in the temperature dependence of the unit-cell volume, indicating that this transition is probably of the second order, as anticipated by Belik et al. (Reference Belik, Naumov, Kim and Tsuda2011). In fact, from this temperature up to 500°C, unit-cell parameters and volume expand linearly. The thermal expansion coefficients, determined over this temperature range by least-squares linear regression analysis, are: αa = 0.95(4)·10–5 K–1, αb = 1.33(5)·10–5 K–1, αc = 1.04(3)·10−5 K–1 and αV = 3.36(7)·10−5 K–1, with axial expansion coefficients ratios being αa:αb:αc = 1 : 1.40 : 1.09. Quantitative estimation of structure-controlled thermal expansion anisotropy was derived using the formalism of Schneider and Eberhard (Reference Schneider and Eberhard1990): A = (|α(b) − α(c)| + |α(b) − α(a)| + |α(c) − α(a)|) × 10−6, which yielded a value of 0.8 K–1. When compared with the structural thermal behaviour of libethenite and adamite, this is the lowest value observed, somewhat similar to that of the other Cu-bearing phosphate member of the mineral family, libethenite (1.10 K–1, Zema et al., Reference Zema, Tarantino and Callegari2010), but rather different from that of the Zn-analogue arsenate adamite, which behaves more anisotropically (3.2 K–1, Zema et al., Reference Zema, Tarantino, Boiocchi and Callegari2016).
Only preliminary signs of deterioration of the crystal, such as some broadening of diffraction profiles and weakening of intensities due to incipient dehydration process, are observed at 500°C in olivenite. Again, the two Cu-bearing minerals, olivenite and libethenite, seem to show similar thermal stability, higher than that of the Zn-analogue adamite, which starts decomposing at ~400°C under the conditions of these studies.
Structural modifications at HT
As for the other members of the mineral family, expansion in olivenite is limited mainly by edge-sharing Cu(2) dimers along a and by edge-sharing Cu(1) octahedra chains along c; on the other hand, connections of polyhedra along b, the direction of maximum expansion, is guaranteed by corner-sharing. Indeed, this is valid for both the monoclinic and orthorhombic phases, as shown above, although expansion rates change significantly at the transition.
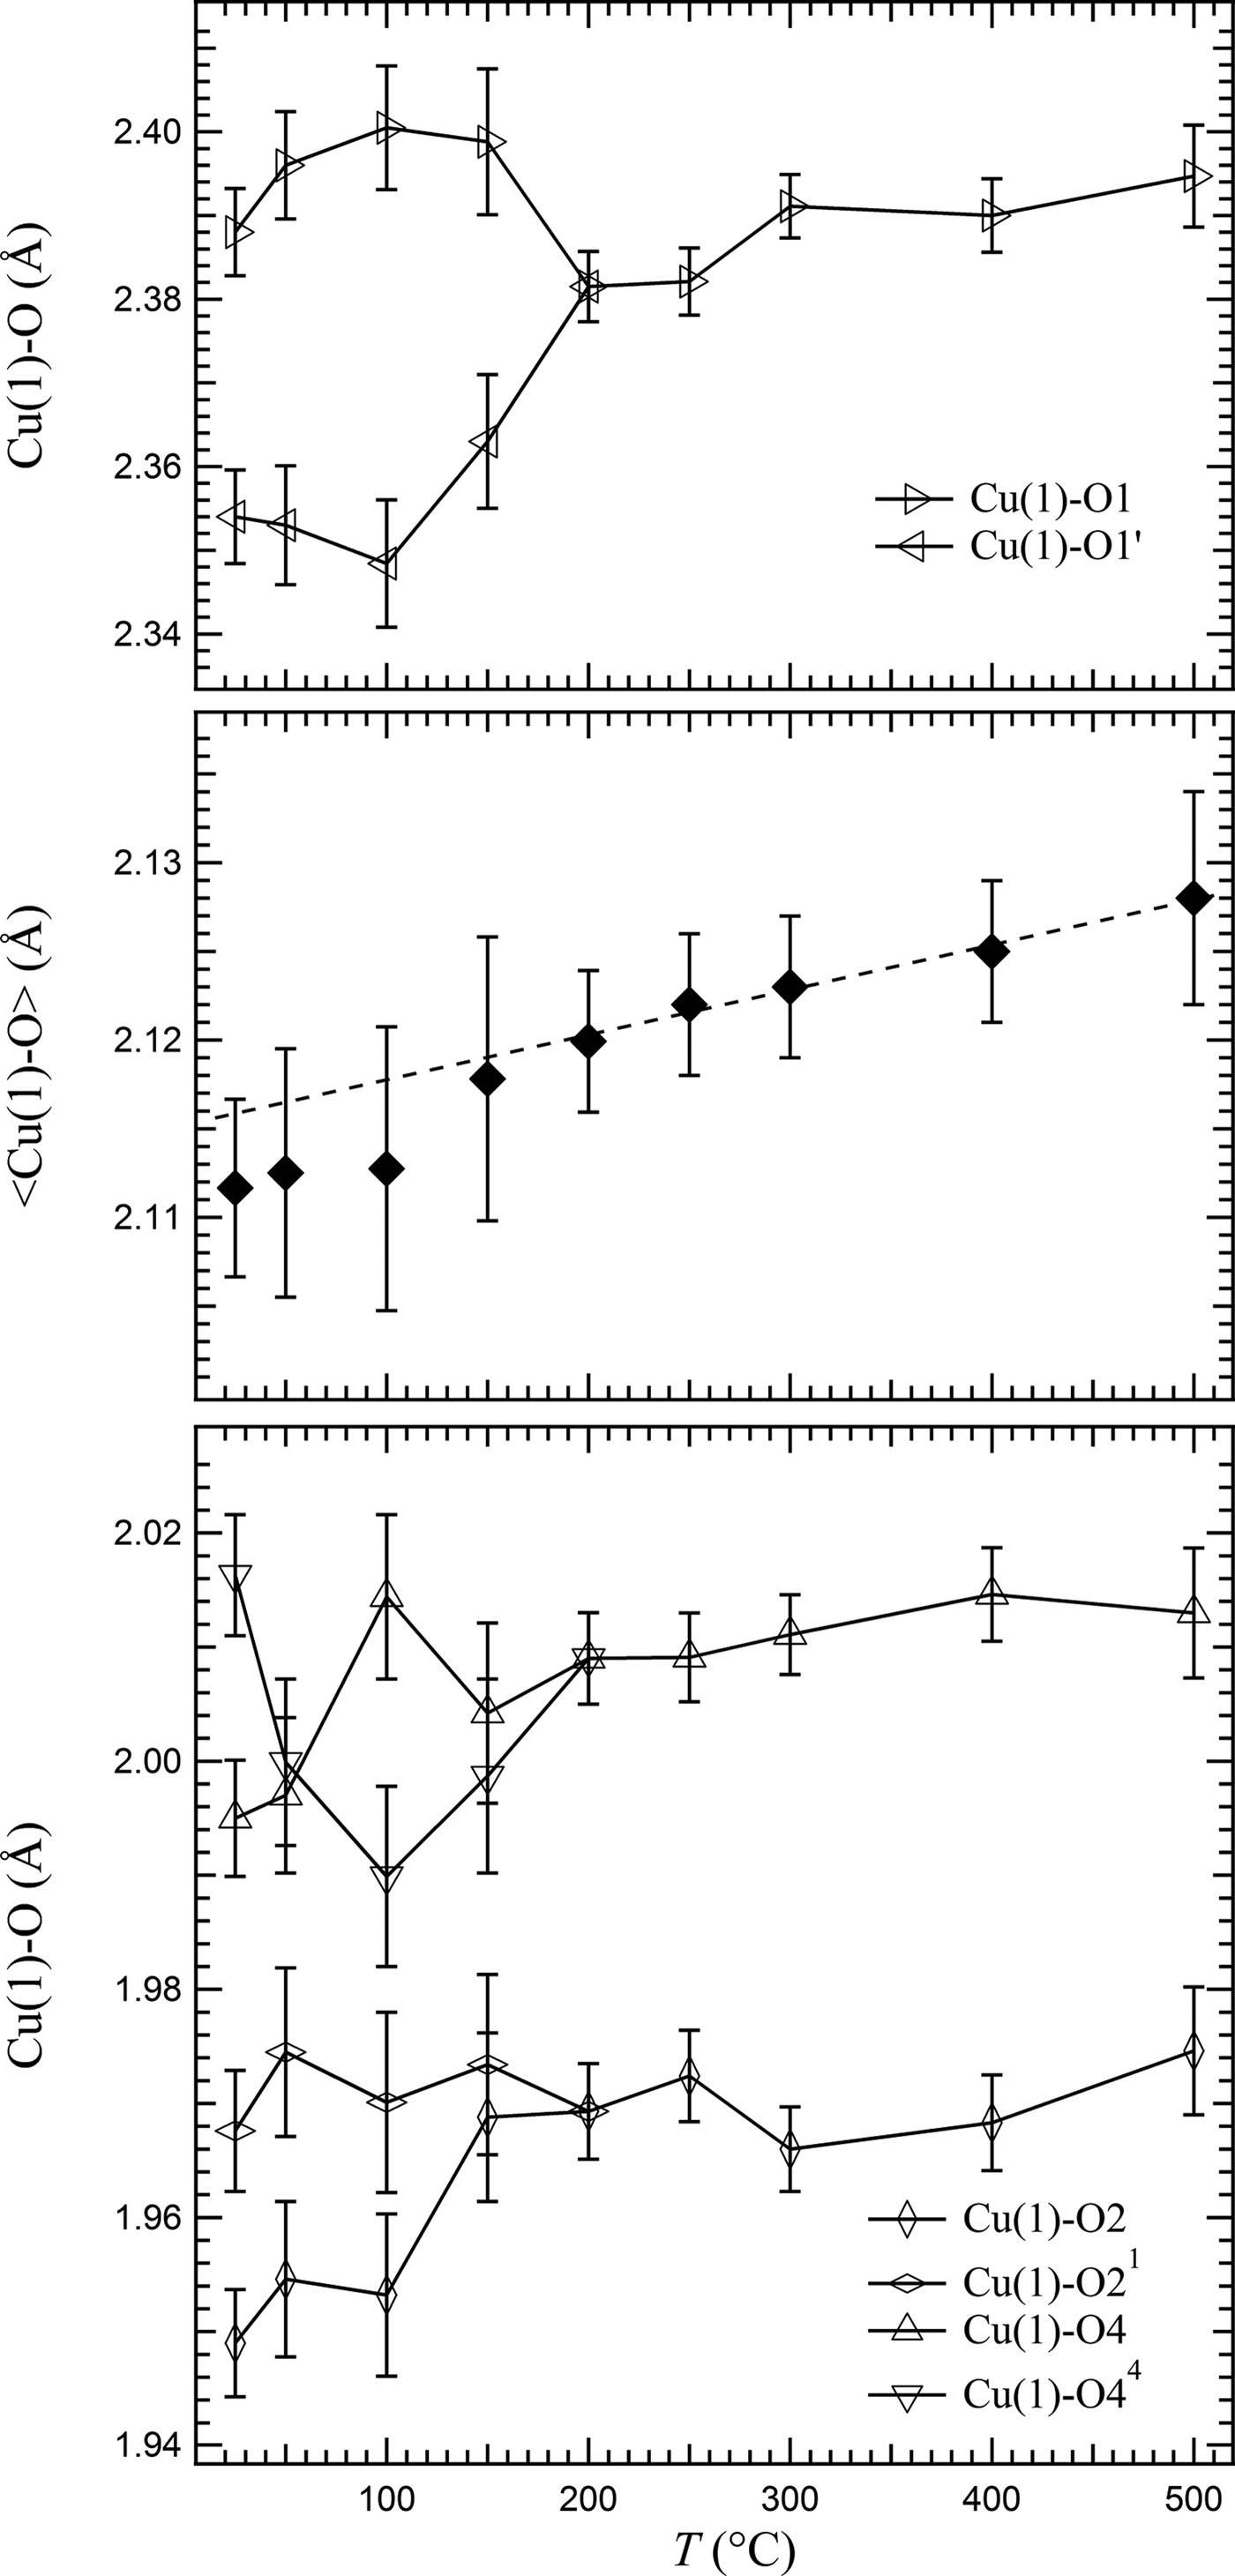
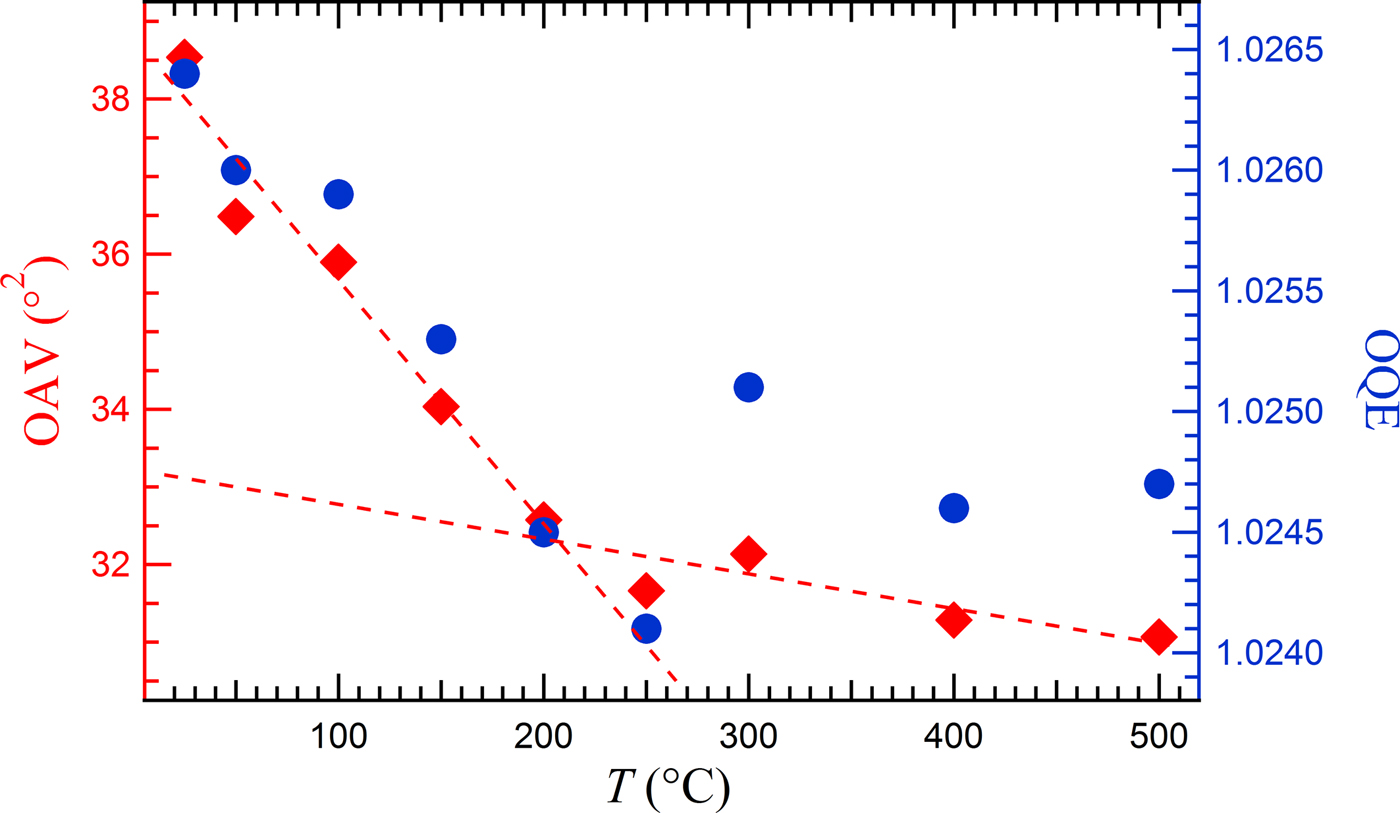
Geometrical and distortion parameters of Cu(1) octahedron as a function of temperature are shown in Figs 3 and 4. Bond distances (Fig. 3) increase slightly with T, the average distance showing a linear behaviour in the orthorhombic phase. It is interesting to note that this is mainly due to the expansion of the axial Cu(1)–O distances, whereas modifications occurring at the octahedron equatorial plane are of a lesser extent. In particular, the Cu(1)–O axial distances increase from 2.371(6) Å at RT (mean value of the two independent distances) to 2.396(6) Å at 500°C, whereas the Cu(1)–O and Cu(1)–OH equatorial distances increase from 1.959(5) and 2.006(5) Å at RT (mean values of the independent distances) to 1.975(6) and 2.013(6) Å at 500°C, respectively. Therefore the coordination around Cu(1) becomes more and more 4 + 2 in character with increasing T. Polyhedral volume follows the same behaviour as that of the average bond distance. Overall, the Cu(1) polyhedron is less distorted than its counterpart in libethenite at room temperature (Zema et al., Reference Zema, Tarantino and Callegari2010). Nonetheless, distortion parameters octahedral quadratic elongation (OQE) and octahedral angle variations (OAV) (Robinson et al., Reference Robinson, Gibbs and Ribbe1971) decrease linearly with T until the phase transition occurs, and remain almost constant in the orthorhombic phase in the whole investigated range of T (Fig. 4).
Individual and average Cu(1)–O bond distances as a function of temperature. Note that legends refer to the independent distances in the monoclinic phase and that O1’ becomes a position symmetrically equivalent to O1 in the orthorhombic one. Linear regression for < Cu(1)–O > average distance calculated in the range 200–500°C is reported as a dashed line and extended to the entire T axis range.

Distortion parameters for Cu(1) polyhedron as a function of temperature. Left axis: octahedral angular variance (OAV); right axis: octahedral quadratic elongation (OQE). Linear regressions in the ranges 25–200°C and 200–500°C are reported for OAV as dashed red lines.

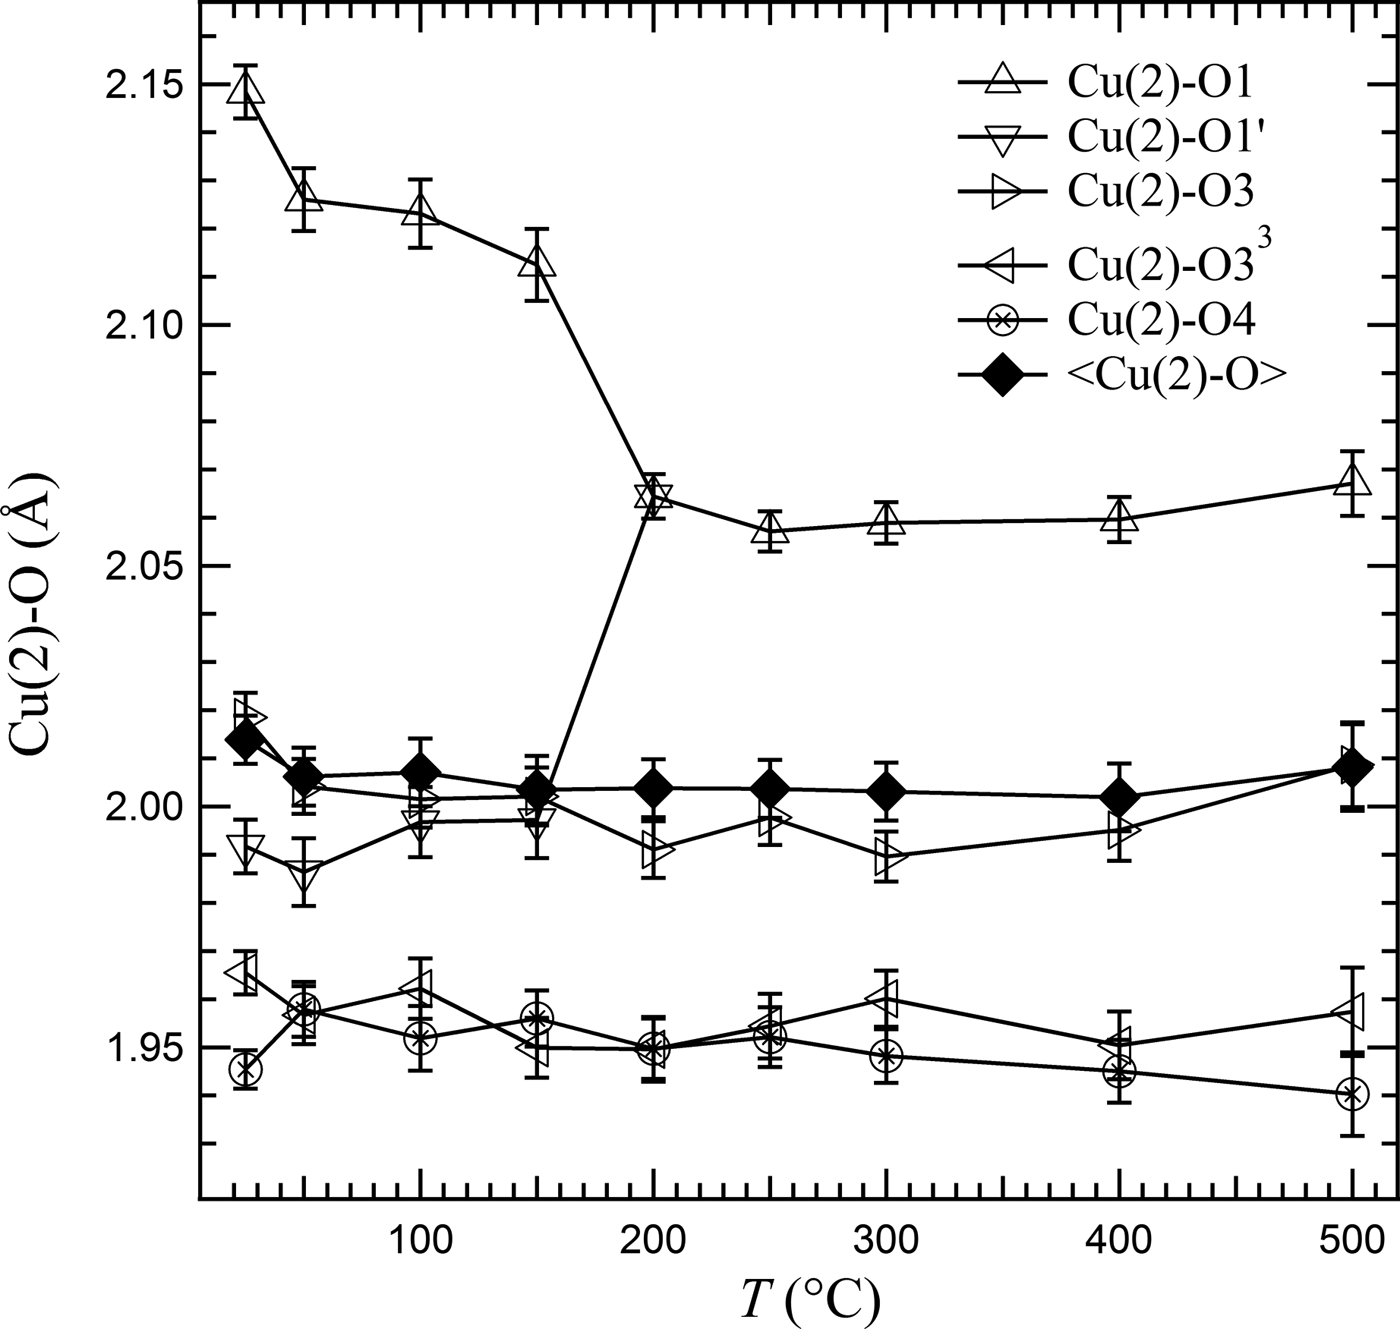
The Cu(2) coordination at room temperature, i.e. in the monoclinic phase, can be described as 4 + 1 (Fig. 5). In fact, the Cu(2)–O1 distance is much longer [2.150(2) Å] than the other four distances, ranging between 1.957(2) and 2.009(2). With increasing temperature, the Cu(2)–O1 distance decreases significantly from 2.149(6) Å at RT to 2.113(8) at 150°C, whereas the Cu(2)–O1’ distance, as well as the other independent distances, remain almost constant. However, the Cu(2)–O1 and Cu(2)–O1’ distances converge to 2.063(5) Å at the transition, when the coordination at Cu(2) is a distorted trigonal bipyramid, similar to that observed in libethenite, and its geometrical features do not change with temperature.
Individual and average Cu(2)–O bond distances as a function of temperature. Notations as for Fig. 3.

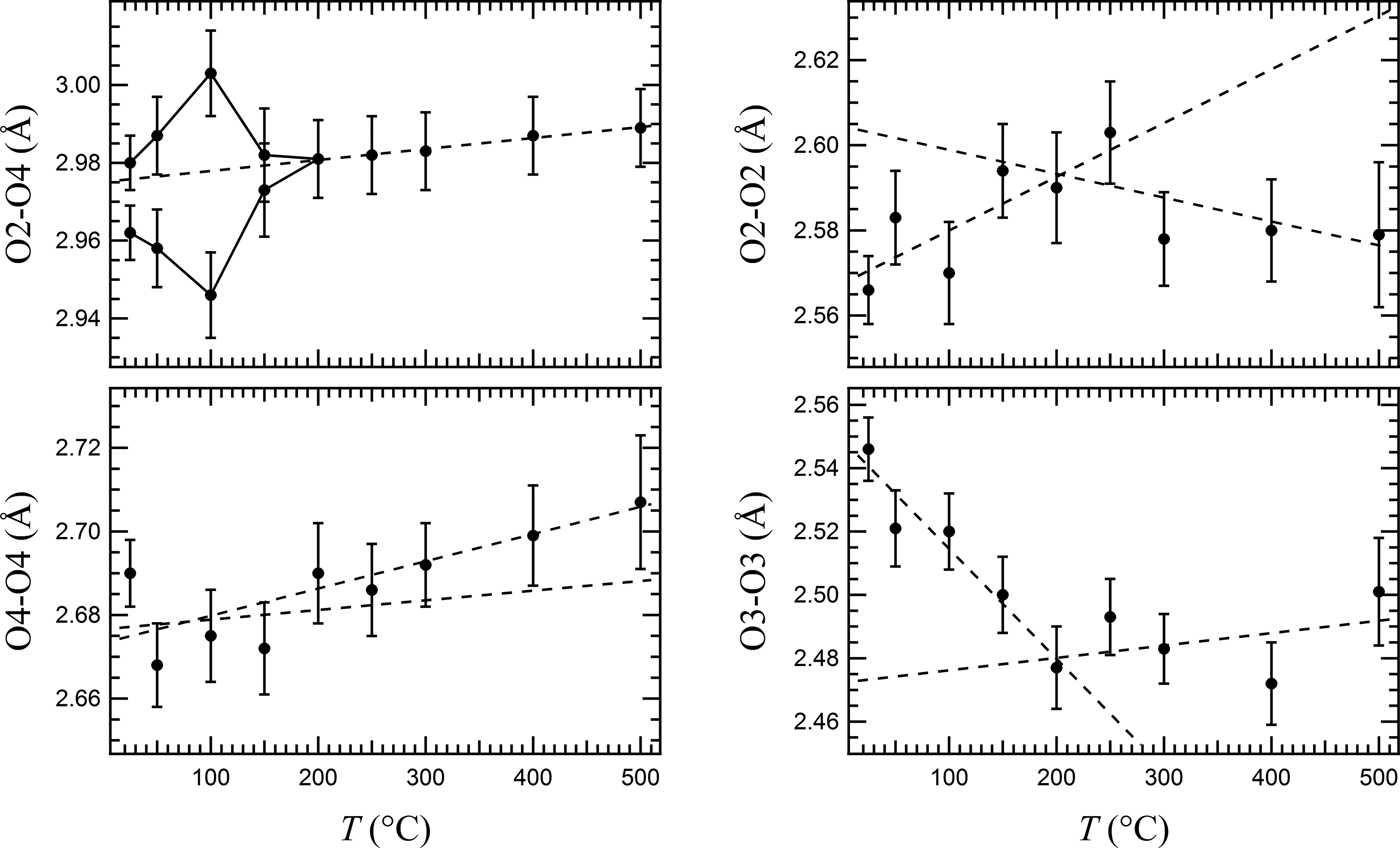
No significant variation is observed for the bond distances and distortion of the As tetrahedron (see data in Table 4), which acts as a rigid body. When interpolyhedral connections are considered, it must be noted that in minerals of the olivenite group, the AsO4 tetrahedron is much larger than the PO4 counterpart [PO4 tetrahedron volume in libethenite: 1.87 Å3; AsO4 in both adamite and olivenite: 2.45 Å3 (Zema et al., Reference Zema, Tarantino and Callegari2010, Reference Zema, Tarantino, Boiocchi and Callegari2016; this work; all from CCD data)] and this accounts for the far more expanded cells of the As-bearing minerals [libethenite: 398.51(2) Å3; adamite: 429.80(3) Å3; olivenite: 421.04(5) Å3; all from CCD data], with adamite being the largest due to the slightly larger ionic radius of Zn2+ with respect to Cu2+. In turn, the structural relaxation due to the larger volume of the AsO4 tetrahedron is also responsible for the longer O2–O4 unshared octahedral edge in olivenite [2.972(2) Å, mean of the two independent values of the monoclinic phase; from CCD data] than in libethenite [2.947(1) Å, Zema et al., Reference Zema, Tarantino and Callegari2010; from CCD data]. The O2–O4 equatorial octahedral edges are oriented almost exactly along c, and are then indicative of the elongation of the chain. Figure 6 shows that the values of the two independent O2–O4 edges in the monoclinic phase initially diverge with increasing T up to 100°C. Then they converge towards similar values at 150°C and become symmetrically equivalent in the orthorhombic phase, where they increase quite linearly with T. The behaviour of the edges extending along c is coupled to the increase in the Cu(1)···Cu(1) distances along the chain (see data in Table 4). The two shared edges O2–O2 and O4–O4 (Fig. 6) do not seem to change significantly with increasing T. Concerning the Cu(2) interpolyhedral connections, the O3–O3 edge, which is shared by two Cu(2) polyhedra to form the Cu(2)–Cu(2) dimer, is quite short [2.526(4) Å, from CCD data] to reduce the high-energy effects of edge-sharing, and not significantly different from those in libethenite [2.554(2) Å, Zema et al., Reference Zema, Tarantino and Callegari2010; from CCD data] and adamite [2.517(4) Å, Zema et al., Reference Zema, Tarantino, Boiocchi and Callegari2016; from CCD data]. Nevertheless, it decreases almost linearly in the monoclinic structure until the phase transition, and then remains almost constant after that (Fig. 6). The Cu(2)···Cu(2) distance (see data in Table 4) increases almost linearly across the entire temperature range investigated, with no discontinuities at the transition.
Variation of selected polyhedral edges with temperature: O2–O4, within each octahedron and indicative of the elongation of the chain along c; O2–O2, shared by two octahedra along the chain; O4–O4, shared by two octahedra along the chain and bearing the H atoms; and O3–O3, shared by two Cu(2) trigonal bipyramids. Linear regressions calculated in the ranges 25–200°C (except for the O2–O4 edge) and 200–500°C are reported as dotted lines.

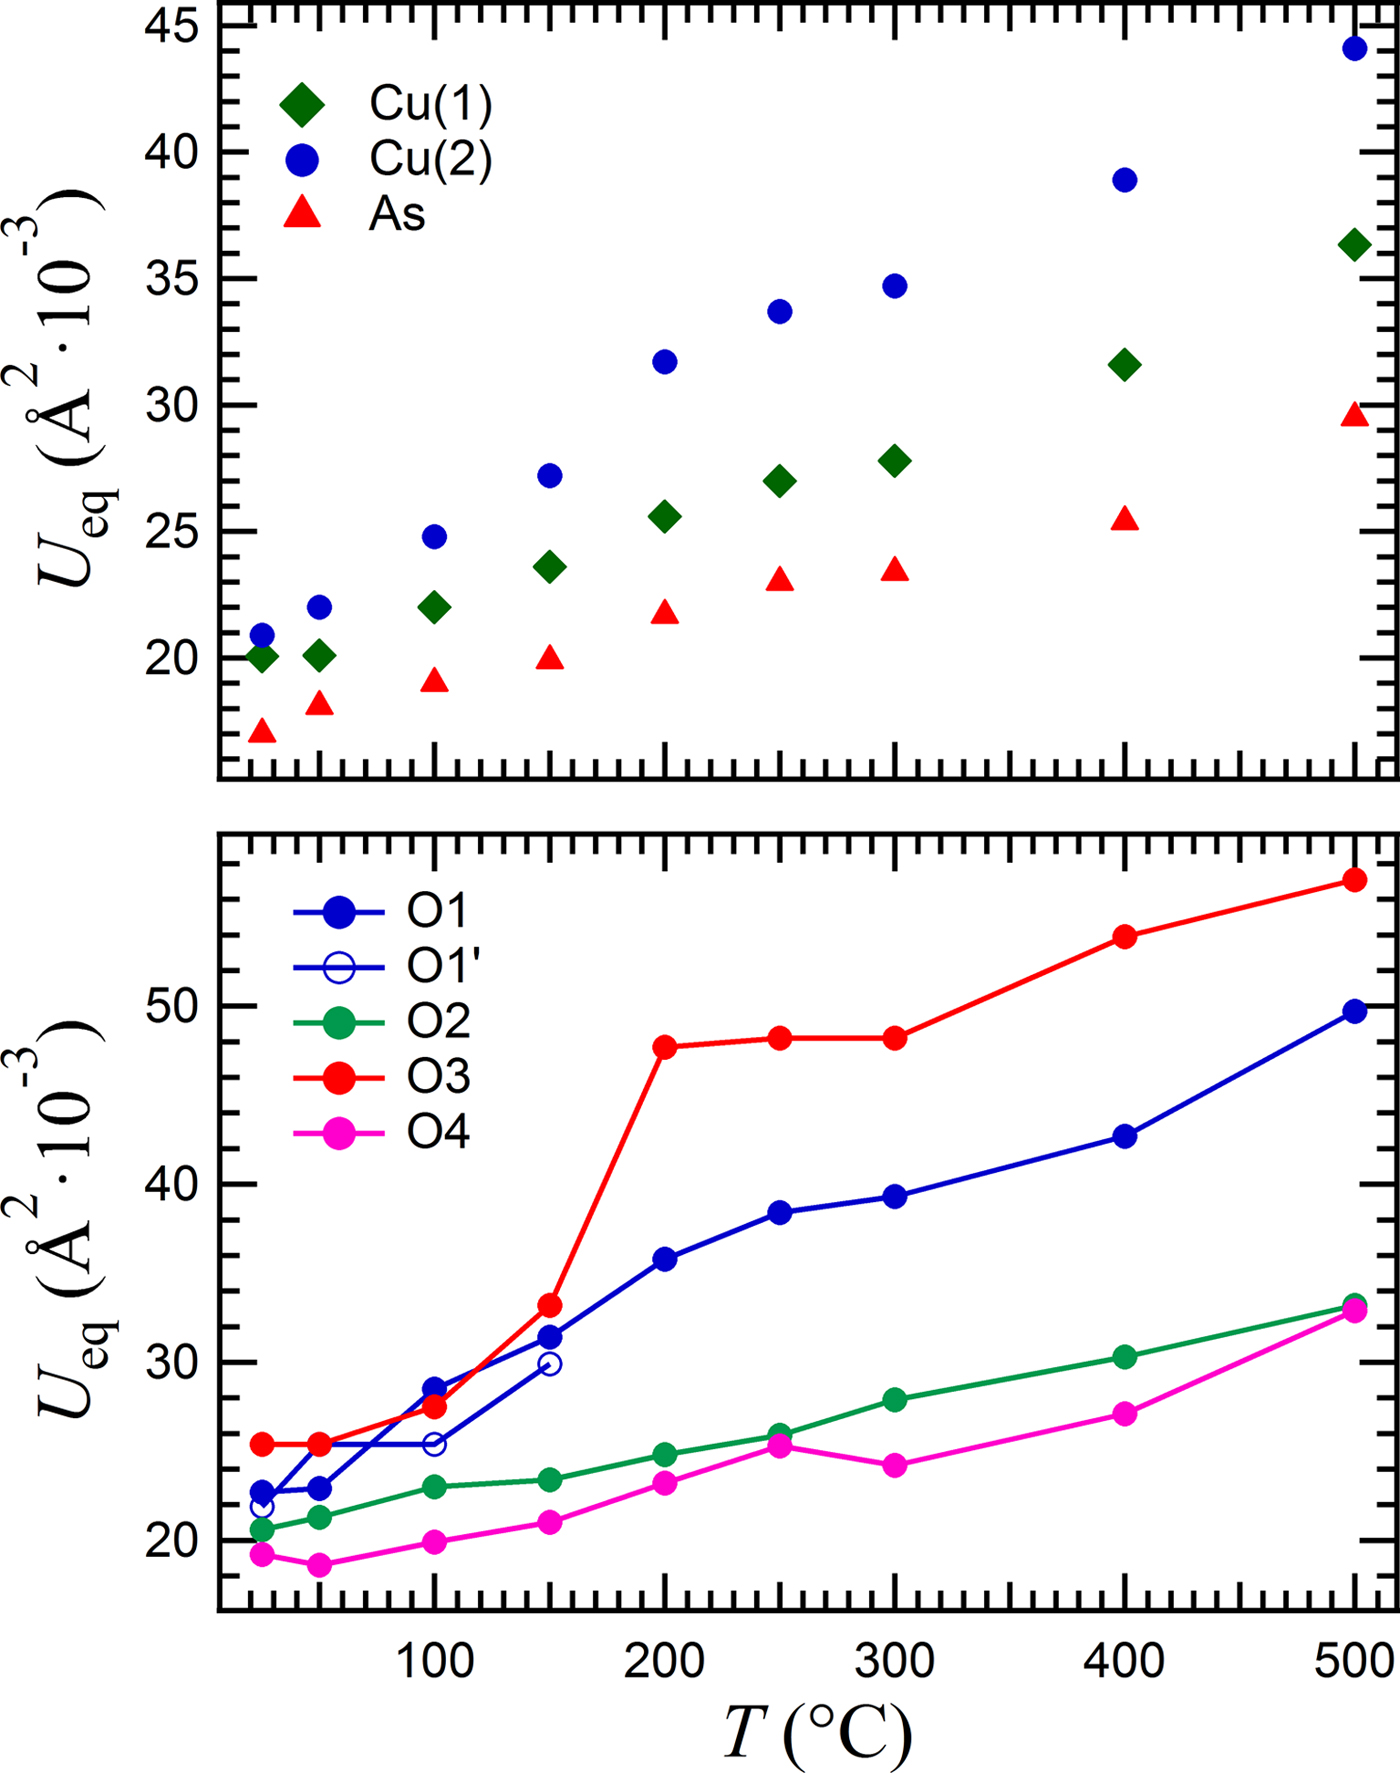
The temperature dependences of the equivalent atomic displacement parameters (ADPs) are reported in Fig. 7. All atoms in the structure apart from O3 show a linear increase of their ADPs with increasing T. Interestingly, the oxygen atom O3 shows a jump up to higher values at the transition. This is associated with a change in the shape of the ellipsoid, which becomes more anisotropic. In fact, the U 33/U 11 ratio changes from 2.53 at 200°C to 4.37 at 250°C. The elongation of the ADP for O3 along c might reflect some positional disorder, which implies a libration of AsO4 tetrahedron. In the monoclinic phase, the olivenite structure is able to accommodate temperature variations by rotations of tetrahedra, but this is not possible in the orthorhombic phase as O1 and O1’ are equivalent and O2 and O3 lie on the 4g Wyckoff position (site symmetry ..m). Such a mechanism of deformation could account for the larger thermal expansion of the monoclinic phase than of the orthorhombic one, in which expansion is limited by bond lengths.
Equivalent atomic displacement parameters as a function of temperature. Upper panel: cations; lower panel: oxygen atoms. A line connecting points is reported for improving the readability of the graph.

Distortion and strain analysis
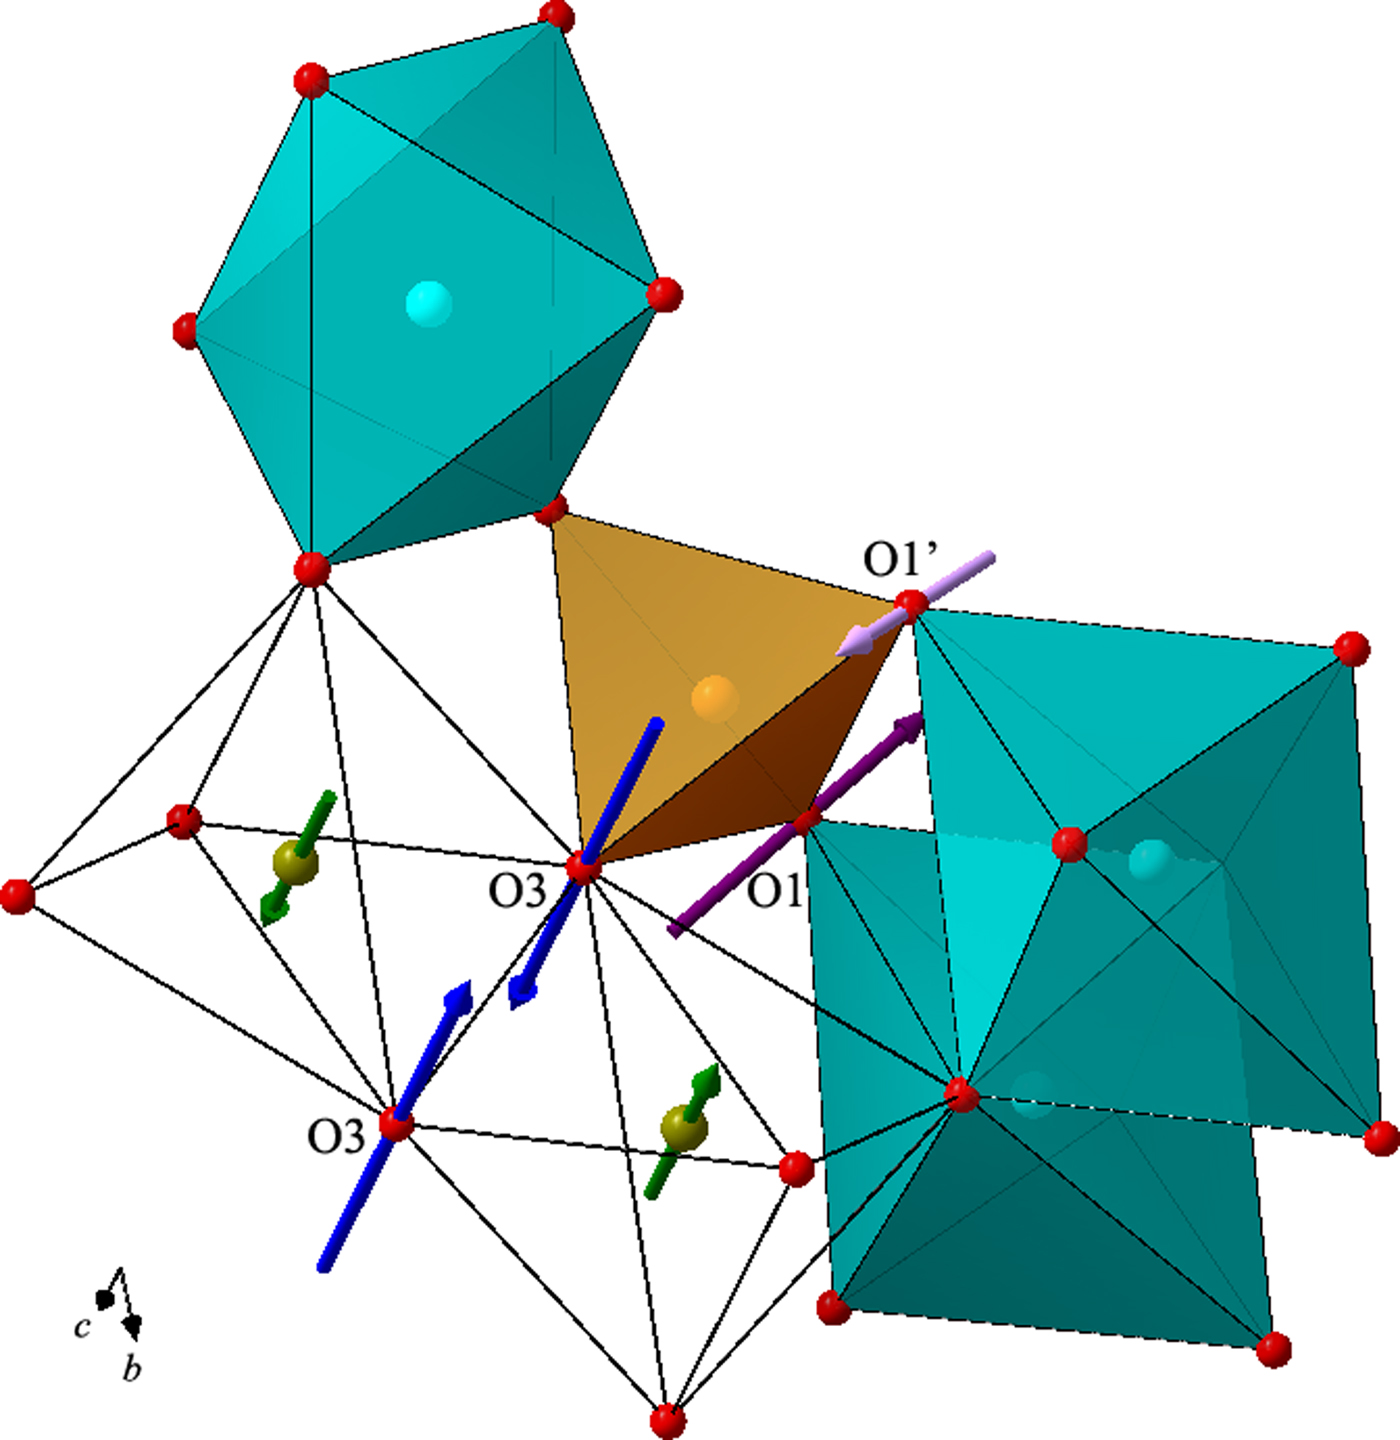
The order parameter for structural phase transition in olivenite can be extracted from atomic fractional coordinates by using mode decomposition and from the unit-cell parameters, which display changes in the structural state overtly as spontaneous strain. There is a group-subgroup relation between the room temperature P21/n and the high-temperature Pnnm symmetries, and the transition is allowed to be continuous. However, the difference between the two phases is significantly large. There is a primary distortion (irrep  $\Gamma _4^ + $), which yields the observed symmetry break between the two phases, plus the usual fully symmetric distortion mode (irrep
 $\Gamma _1^ + $). The number of independent symmetry modes corresponding to the
 $\Gamma _4^ + $ symmetry is 11, while the subspace of
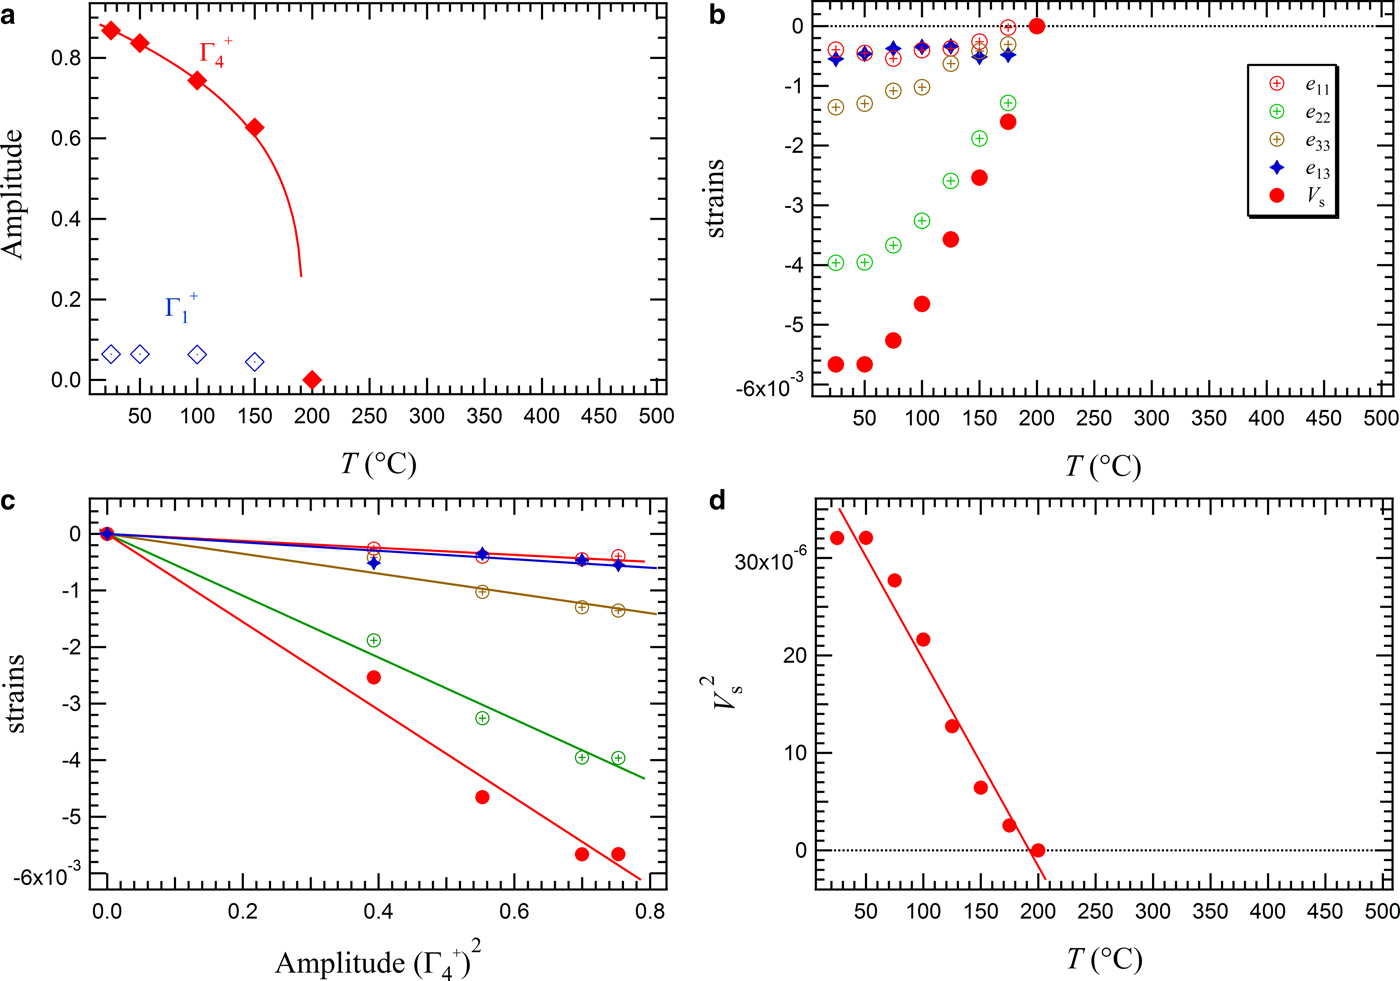
 $\Gamma _1^ + $ distortions has 16 dimensions, in accordance with the number of free atomic parameters present in the parent structure. The structural behaviour has been analysed by following the evolution of the two irrep distortions active in the monoclinic phase as a function of temperature (Fig. 8a). Mode decomposition has been carried out by using Amplimodes (Orobengoa et al., Reference Orobengoa, Capillas, Aroyo and Perez-Mato2009; Perez-Mato et al., Reference Perez-Mato, Orobengoa and Aroyo2010) in the Bilbao Crystallographic Server (Aroyo et al., Reference Aroyo, Kirov, Capillas, Perez-Mato and Wondratschek2006a,Reference Aroyo, Perez-Mato, Capillas, Kroumova, Ivantchev, Madariaga, Kirov and Wondratschekb, Reference Aroyo, Perez-Mato, Orobengoa, Tasci, de la Flor and Kirov2011) on the results of the crystal-structure refinements at all temperatures. The resulting amplitudes of
 $\Gamma _4^ + $ and
 $\Gamma _1^ + $ at room temperature are 0.8679 Å and 0.0638 Å (not taking hydrogen atoms into account and with respect to the orthorhombic structure at 250°C), respectively. The primary distortion is significantly larger than the non-symmetry breaking distortion. The maximum atomic displacement in the distortion with respect to the reference structure is 0.2227 Å and is shown by the O3 atom. The primary
 $\Gamma _4^ + $ distortion includes a significant relative displacement of the O3, O1, O1' oxygen atoms, of Cu(2) and also As cations, as depicted in Fig. 9. From the correlation of the different displacement vectors of the oxygen atoms, the whole movement appears as a rotation of AsO4 tetrahedra. This in turn affects the Cu(1) geometry, which becomes more 4 + 2 in character and changes the coordination of the Cu(2) atoms (Fig. 5). However, the structural unit that seems to be most affected by such rotation is the O3–O3 shared edge of the Cu(2) dimers. These edges in the orthorhombic phase lie in the xy plane and the relative displacements of O3 atoms belonging to the edge are along z and opposite to each other. The global effect is to lengthen the edge, as shown in Fig. 6, and reduce the repulsion between these two oxygen atoms. At room temperature, this edge is 2.55(1) Å in olivenite and 2.527(9) and 2.542(5) Å in adamite and libethenite, respectively.
(a) Temperature dependence of the amplitudes of the primary  $\Gamma _4^ + $ and fully symmetric distortions; (b) symmetry-adapted strains calculated from lattice parameters; (c) strains vs.
 $\Gamma _4^ + $ amplitude relationships: strains vary linearly with the square of
 $\Gamma _4^ + $ amplitude and, within experimental uncertainty, extrapolate to the origin; (d) volume strain, V s, data have been fit with standard solutions to a Landau expansion considering that V s scales with the square of the order parameter.

Description of the  $\Gamma _4^ + $ distortion component. The directions of the atomic displacements correspond to the directions of the arrows. The lengths of the arrows have been exaggerated to properly illustrate the displacements.

At structural phase transitions, cooperative changes that occur in the atomic displacements induce macroscopic lattice strains (spontaneous strains). Strain parameters have been calculated by using the equations given by Carpenter et al. (Reference Carpenter, Salje and Graeme-Barber1998b), who reviewed the use of spontaneous strain to measure order parameters associated with phase transitions in minerals. For a zone centre mmm→2/m transition, the symmetry breaking strain must transform as the active representation of the primary distortion mode  $\Gamma _4^ + $ (B2g in Mulliken symbols), for which the basis function is xz, giving e 13 ∝ Q as the expected strain/order parameter relationship. The non-symmetry breaking strains (linear strains e i, i = 1–3 and volume strain, V s), are associated to the identity representation and are proportional to Q 2. Therefore, the expected relationships between strain components are: e 13 ∝ V s½ ∝ e i½ ∝ Q. Changes in lattice parameters as a function of temperature yield the linear strain components and volume strain V s shown in Fig. 8b as a function of T. Values for the reference parameters, a 0, b 0, c 0 and V 0 were obtained by fitting straight lines to data for the respective unit-cell parameter above the transition and extrapolating to lower temperatures. A simple inspection of variations of unit-cell parameters as a function of temperature (Table 1) clearly shows that the β angle is already very close to 90° at room temperature. Nonetheless, fairly large variations of the other unit-cell parameters, in particular of b and c, occur at the transition (Fig. 2). This implies a very small e 13 strain component (< 0.001), which also shows a large scatter, like the β angle, and relatively large non-symmetry breaking strains (up to ~0.006 in magnitude). These latter strains go continuously to zero and vary non linearly with T (at least at low T). The low-symmetry phase has a smaller volume than the high-symmetry phase at the same temperature, giving negative values of V s. All the non-symmetry breaking strains scale nearly linearly one to the other, consistently with the aforementioned symmetry considerations, therefore in the subsequent discussion only the volume strain will be considered. More relevantly, all the non-symmetry breaking strains scale linearly with the square of amplitude of the primary distortion
 $\Gamma _4^ + $ within experimental uncertainties, as evident in Fig. 8c.
Using a Landau free energy expansion (G) to the 6th order in the order parameter (Q), quadratic in strain (e i) and simultaneously linear and quadratic in order-parameter-strain components-coupling, the equilibrium value of Q can be expressed as Q = A(T c*–T)n. The simultaneous linear and quadratic coupling of strain components to the order parameter implies a renormalization of the Landau expansion in order parameter for free energy (Landau and Lifshitz, Reference Landau and Lifshitz1958): the transition temperature T c* is renormalized by coupling between the order parameter and the symmetry-breaking strain e 13, while the fourth-order term of the expansion contains contributions from coupling of the square of Q with the volume strain.
Distortion amplitudes follow a well-behaved, smooth temperature dependence, shown in Fig. 8a. It should be pointed out that in general, for each individual atomic position, the contributions of the two modes superpose, and therefore the temperature evolution of the distortion shown in Fig. 8a cannot be directly observed in the thermal changes of single atomic coordinates or bond distances. The available points for the amplitude of the  $\Gamma _4^ + $ distortion have been fitted to the continuous function reported above. The fitted critical exponent is 0.26(1) for T c* = 194°C, as extrapolated from the linear fit in Fig. 8d, thus indicating that the transition is close to Landau tricritical behaviour. To a good approximation, V s2 varies linearly with T (Fig. 8d), thus further confirming a tricritical behaviour (Q 4 ∝ |T c* – T|).
Cu(1) octahedra in the olivenite structure show a 4 + 2 distortion with two long apical O1 anions, however half of the octahedra have their elongation axis O1–Cu(1)–O1’ oriented along ca. [120] and half along [1 $\bar 20$]. Elongation in different orientations compensate each other, thus the 4 + 2 octahedral distortion does not induce a large shear and e 13 strain is indeed small. On the other hand, non-symmetry breaking strains influence the transition character. Strain effects drive the transition towards first-order with the fourth-order term parameter B in the Landau potentials tending to smaller or negative values, and this also relevant for all transitions near to the tricritical point where B disappears.
The geometrical mechanism for the transition involves both a shift of Cu(2) and a rotation of the AsO4 tetrahedra. Such rotation, expressed as the angle between the c axis and the normals to the tetrahedral faces formed by O1, O1' and O3 and O1, O1' and O2, respectively, appears to show the same temperature dependence as other properties that scale with Q. From the standpoint of the octahedral Cu coordination, the transition is associated with a reduction of the distortion of the octahedron, which however keeps a 4 + 2 character in the orthorhombic phase. The effect of the deformation is on the one side to maintain a distance of 3.061(1) Å between Cu cations in adjacent five-coordinated groups at RT, as in libethenite, and concurrently, stretch the O3–O3 edge. On the other hand, it reflects the effects of repulsion between copper cations in adjacent octahedra with a Cu(1)–Cu(1) distance of 2.960(1) Å, longer than for libethenite (2.9331(1) Å).
Although the exact origin has not yet been explained, the structural phase transition in olivenite seems to be largely displacive, considering that the evolution of the order parameter conforms to a standard solution of the Landau expansion. Coupling between strain and order parameter can account for the nearly tricritical character of the transition.
Acknowledgements
The authors thank reviewers Stuart Mills and Pete Leverett for their insightful comments. Funds from Fondo Ricerca Giovani to MZ, SCT and AMC are acknowledged.
Supplementary material
To view supplementary material for this article, please visit https://doi.org/10.1180/minmag.2017.081.048