Introduction
Wind disturbances are a form of natural disturbance commonly experienced by tropical forests, leading to the formation of canopy gaps and often fragmentation of forest landscapes (Everham and Brokaw Reference Everham and Brokaw1996; Schwartz et al. Reference Schwartz, Uriarte, DeFries, Bedka, Fernandes, Gutiérrez-Vélez and Pinedo-Vasquez2017). Such strong wind events range in magnitude from catastrophic hurricanes or cyclones to windstorms and tree blowdowns (Lugo Reference Lugo2008), altering forest structure by causing extensive defoliation (Lugo and Scatena Reference Lugo and Scatena1996), stem breakages and uprooting of trees (Putz et al. Reference Putz, Coley, Lu, Montalvo and Aiello1983). These effects create gaps in forest canopies, not only modifying microenvironmental conditions (Lenart Reference Lenart2003; Lugo Reference Lugo2008) but also providing opportunities for regeneration of species that may otherwise be suppressed by pre-disturbance stand conditions (Nagel et al. Reference Nagel, Svoboda and Kobal2014).
Forest succession following disturbance can be conceptualised as beginning with a phase when stem density increases steeply within the gap, caused by rapid regeneration of existing understorey seedlings and saplings which exploit the high light availability of the opened canopy, resprouting from damaged adult trees as well as germination of seeds from the soil seed bank (Brokaw Reference Brokaw1985; Pickett et al. Reference Pickett, Collins and Armesto1987; Yih et al. Reference Yih, Boucher, Vandermeer and Zamora1991). This initial phase has been variously termed the ‘building’ (Vandermeer et al. Reference Vandermeer, Boucher, Perfecto and Granzow-de la Cerda1996, Reference Vandermeer, Boucher, Granzow--de-la Cerda and Perfecto2001) or ‘stand initiation’ (Oliver and Larson Reference Oliver and Larson1990) phase, lasting approximately 3–10 years depending on disturbance intensity and site conditions (Chazdon Reference Chazdon, Carson and Schnitzer2008; Schnitzer et al. Reference Schnitzer, Dalling and Carson2000; Yee et al. Reference Yee, Lai, Chong, Neo, Koh, Tan, Seah, Loh, Lim, van Breugel and Tan2019). This is then followed by a phase when stems under the newly formed dense canopy – albeit of lower height than the original canopy – experience intense competition, with some stems having a competitive advantage either from being taller at the onset of canopy closure and thus having access to more light or being able to tolerate lower light conditions and others being shaded out (Vandermeer et al. Reference Vandermeer, Boucher, Granzow--de-la Cerda and Perfecto2001). This subsequent phase, referred to as ‘thinning’ (Vandermeer et al. Reference Vandermeer, Boucher, Perfecto and Granzow-de la Cerda1996, Vandermeer et al. Reference Vandermeer, Boucher, Granzow--de-la Cerda and Perfecto2001) or ‘stem exclusion’ (Oliver and Larson Reference Oliver and Larson1990), marks the transition from recruitment-driven to competition-driven dynamics. Within Watt’s (Reference Watt1947) and Whitmore’s (Reference Whitmore, Tomlinson and Zimmermann1978, Reference Whitmore1989) forest growth cycle framework comprising gap, building and mature phases, Vandermeer’s ‘building’ and ‘thinning’ phases resolve the demographic processes linking post-gap regeneration to the building phase and subsequent transition into forest maturity.
It is widely agreed that wind disturbance is one of the mechanisms that maintains high species diversity in tropical forests (Burslem and Whitmore Reference Burslem and Whitmore1999; Silva Pedro et al. Reference Silva Pedro, Rammer and Seidl2016). The intermediate disturbance hypothesis posits that recurring disturbances of intermediate frequency or intensity regularly reset population densities to lower levels, thereby preventing certain species from attaining dominance or achieving competitive exclusion of other species, hence maintaining high levels of diversity (Connell Reference Connell1978; Vandermeer et al. Reference Vandermeer, Boucher, Perfecto and Granzow-de la Cerda1996). Implicitly, these refer to long-lived or resource-conservative climax species; however, in tropical rainforests in Nicaragua, Vandermeer et al. (Reference Vandermeer, Granzow-de la Cerda, Boucher, Perfecto and Ruiz2000) attributed increased species diversity to an extremely strong hurricane that eradicated pioneer seed trees such that late-successional seedlings and saplings did not get outcompeted by pioneer saplings. The extent to which disturbance may or may not increase plot-level, that is, ‘alpha’ tree diversity needs to be disentangled from the confounding relationships with increased recruitment and stem densities, as each additional stem represents a potential colonisation of the locality by an additional species from the regional species pool (Colwell et al. Reference Colwell, Chao, Gotelli, Lin, Mao, Chazdon and Longino2012).
Monitoring recovery of tree communities at high resurvey frequencies following a disturbance would offer valuable insight into successional trajectories. Aside from stem densities and species diversities, community composition trajectories after a disturbance event are also typically expected to exhibit a hump-shaped trajectory, displaying an initial divergence from undisturbed compositions followed by a convergence back towards them, though the magnitude and timescales of these shifts may vary greatly based on disturbance type and intensity (Mirabel et al. Reference Mirabel, Hérault and Marcon2020; Seidl et al. Reference Seidl, Rammer and Spies2014). Across past studies of post-hurricane regeneration, there is no clear consensus on how species compositions change over time during regeneration, with observations found to vary across different post-disturbance timeframes and local conditions (Lugo Reference Lugo2008). While Zhao et al. (Reference Zhao, Allen and Sharitz2006) observed that species compositions were becoming increasingly dissimilar from the pre-disturbance state over 12 years of regeneration, Vandermeer et al. (Reference Vandermeer, Granzow-de la Cerda, Boucher, Perfecto and Ruiz2000) found no significant evidence of a divergence in species composition between affected and unaffected forests after 10 years. As for lower-magnitude windstorms in tropical forests specifically, Yee et al. (Reference Yee, Lai, Chong, Neo, Koh, Tan, Seah, Loh, Lim, van Breugel and Tan2019) documented an initial divergence in species compositions in the first two years after the disturbance, though this divergence appeared to taper off after just the second year of regeneration.
This raises the important question of how variations in the wind disturbance regimes, that is, the frequency, intensity or spatial extent of damage caused by wind disturbances differentially affect subsequent regeneration across the tropics. Although there are many wind disturbance ecological studies focusing on the effects of hurricanes, mostly concentrated on a few sites at higher latitudes in the Neotropics (Lin et al. Reference Lin, Hogan and Chang2020), there is a shortage of studies on lower-magnitude wind disturbances not amounting to hurricanes (e.g., convective storms; Gora et al. Reference Gora, McGregor, Muller-Landau, Burchfield, Cushman, Rubio, Biem Mori, Sullivan, Chmielewski and Esquivel-Muelbert2025) and their effects on tropical forest succession in the equatorial region (within 10° N and S), which is largely hurricane-free, especially within Tropical Asia. As lower-magnitude windstorms are expected to increase in frequency and intensity due to climate change (Gora et al. Reference Gora, McGregor, Muller-Landau, Burchfield, Cushman, Rubio, Biem Mori, Sullivan, Chmielewski and Esquivel-Muelbert2025), it is becoming increasingly urgent that their effects on the community dynamics of species-rich tropical forests are better understood. There is also a shortage of studies that investigate species composition trajectories specifically during the thinning (or stem exclusion) phase. By examining whether species compositions increase or decrease in similarity between affected and unaffected forests after the thinning phase, it can be determined if succession is proceeding towards original undisturbed compositions or is continuing along divergent trajectories, thus enhancing understanding of the temporal dynamics of species composition changes and the legacies of wind disturbances.
In this study, we investigate forest structural and species diversity changes and species composition trajectories in a tropical forest in equatorial Singapore 12 years after a severe windstorm event. This study constitutes a follow-up survey and investigation from research plots last surveyed eight years ago that examined the building phase post-wind disturbance (Lai et al. Reference Lai, Chong and Yee2022; Yee et al. Reference Yee, Lai, Chong, Neo, Koh, Tan, Seah, Loh, Lim, van Breugel and Tan2019); by the completion of surveys in the earlier studies, an intact canopy had already formed; hence, it was hypothesised that the thinning phase would have occurred (or been occurring) when this new data were collected. We expected that plots in areas affected by tree falls during the windstorm would exhibit strong thinning in terms of reductions in stem densities accompanied by a continued recovery of total basal area in 2023 compared to 2015, in contrast to unaffected plots which we expected no change. At the community level, we hypothesise that alpha diversities would decrease in tandem with stem densities, with diversity in affected plots expected to decrease alongside sapling stem count. We also expect species compositions of affected plots to display trajectories that move towards increasing similarity with unaffected plots, given that they had appeared to stop diverging after only two years of regeneration (Yee et al. Reference Yee, Lai, Chong, Neo, Koh, Tan, Seah, Loh, Lim, van Breugel and Tan2019), reflecting succession towards the pre-disturbance state with regard to community assemblage. For all variables, we tested if affected plots were still different from unaffected plots, that is, whether succession in terms of these aspects were complete, and whether this differed between plots that were assessed to be in younger secondary forest versus old-growth forests.
Materials and methods
Study site and inventory
This study was conducted in a lowland tropical forest in equatorial Singapore, located in Southeast Asia. Annual precipitation in Singapore exceeds 2,000 mm with no prolonged regular dry season and daily temperatures usually range from 24 to 32°C across the year. The site (1°24.8’N, 103°47.5’E), located north of the Upper Seletar Reservoir and bisected by Mandai Road (hence hereafter ‘Mandai forest’), is part of the Central Catchment Nature Reserve (CCNR) and consists of a mosaic of early- and late-successional native-dominated forest (Yee et al. Reference Yee, Chong, Neo and Tan2016). Common tree genera found there include Calophyllum, Diospyros, Garcinia, Gironniera, Palaquium, Prunus, Syzygium, Santiria and Timonius.
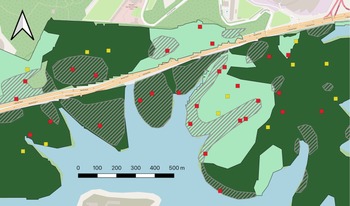
In 2011, the Mandai forest was hit by an unusually severe windstorm event with maximum wind speeds of >60 km/h, leading to approximately 40 ha of tree blowdowns and canopy gaps. Within three months of the windstorm impact, forty 10 × 10 m vegetation plots were established in the Mandai forest through stratified random sampling (Figure 1; Lai et al. Reference Lai, Chong and Yee2022; Yee et al. Reference Yee, Lai, Chong, Neo, Koh, Tan, Seah, Loh, Lim, van Breugel and Tan2019). Of these 40 plots, 26 were located in affected forests and 14 in originally unaffected forests, although tree falls subsequently occurred in two of the 14 plots in 2013 and 2014 which were re-classified as affected plots thereafter (Lai et al. Reference Lai, Chong, Yee, Tan and van Breugel2020). The plots were further categorised into young secondary and old-growth forest types, following the vegetation map of Yee et al. (Reference Yee, Corlett, Liew and Tan2011) and ground-truthing (Yee et al. Reference Yee, Lai, Chong, Neo, Koh, Tan, Seah, Loh, Lim, van Breugel and Tan2019; Figure 1). These plots were surveyed annually between April and July from 2011 to 2015, with all individual stems ≥ 1 cm diameter-at-breast-height (DBH) measured, identified and tagged. After the 2015 survey, all stem tags were removed, and the approximate locations of only stems ≥5 cm DBH were mapped to be matched in future surveys. All plots were then similarly resurveyed again from mid-June 2023 to early January 2024, that is, after a gap of about eight years since 2015; stems that were not previously mapped could not be matched and were hence given new tags. The removal and re-installation of new stem tags between 2015 and 2023 unfortunately meant that individual mortality and recruitment could not be tracked within this timeframe, except for trees ≥ 5 cm DBH for which the demographic analyses will be presented elsewhere. There were minimal signs of human disturbance to the study area and only along forest edges and trails which did not intersect with the plots.
The Mandai forest study site. The squares represent plot locations: red squares – affected plots; yellow squares – unaffected plots. Forest type: dark green – old-growth forest; light-green – young secondary forest. Hatched areas indicate the extent of blowdown damage estimated from aerial photographs in 2011 (Yee et al. Reference Yee, Lai, Chong, Neo, Koh, Tan, Seah, Loh, Lim, van Breugel and Tan2019). Plot type does not always correspond with the forest type and affected areas shown because of reclassifications after ground-truthing.
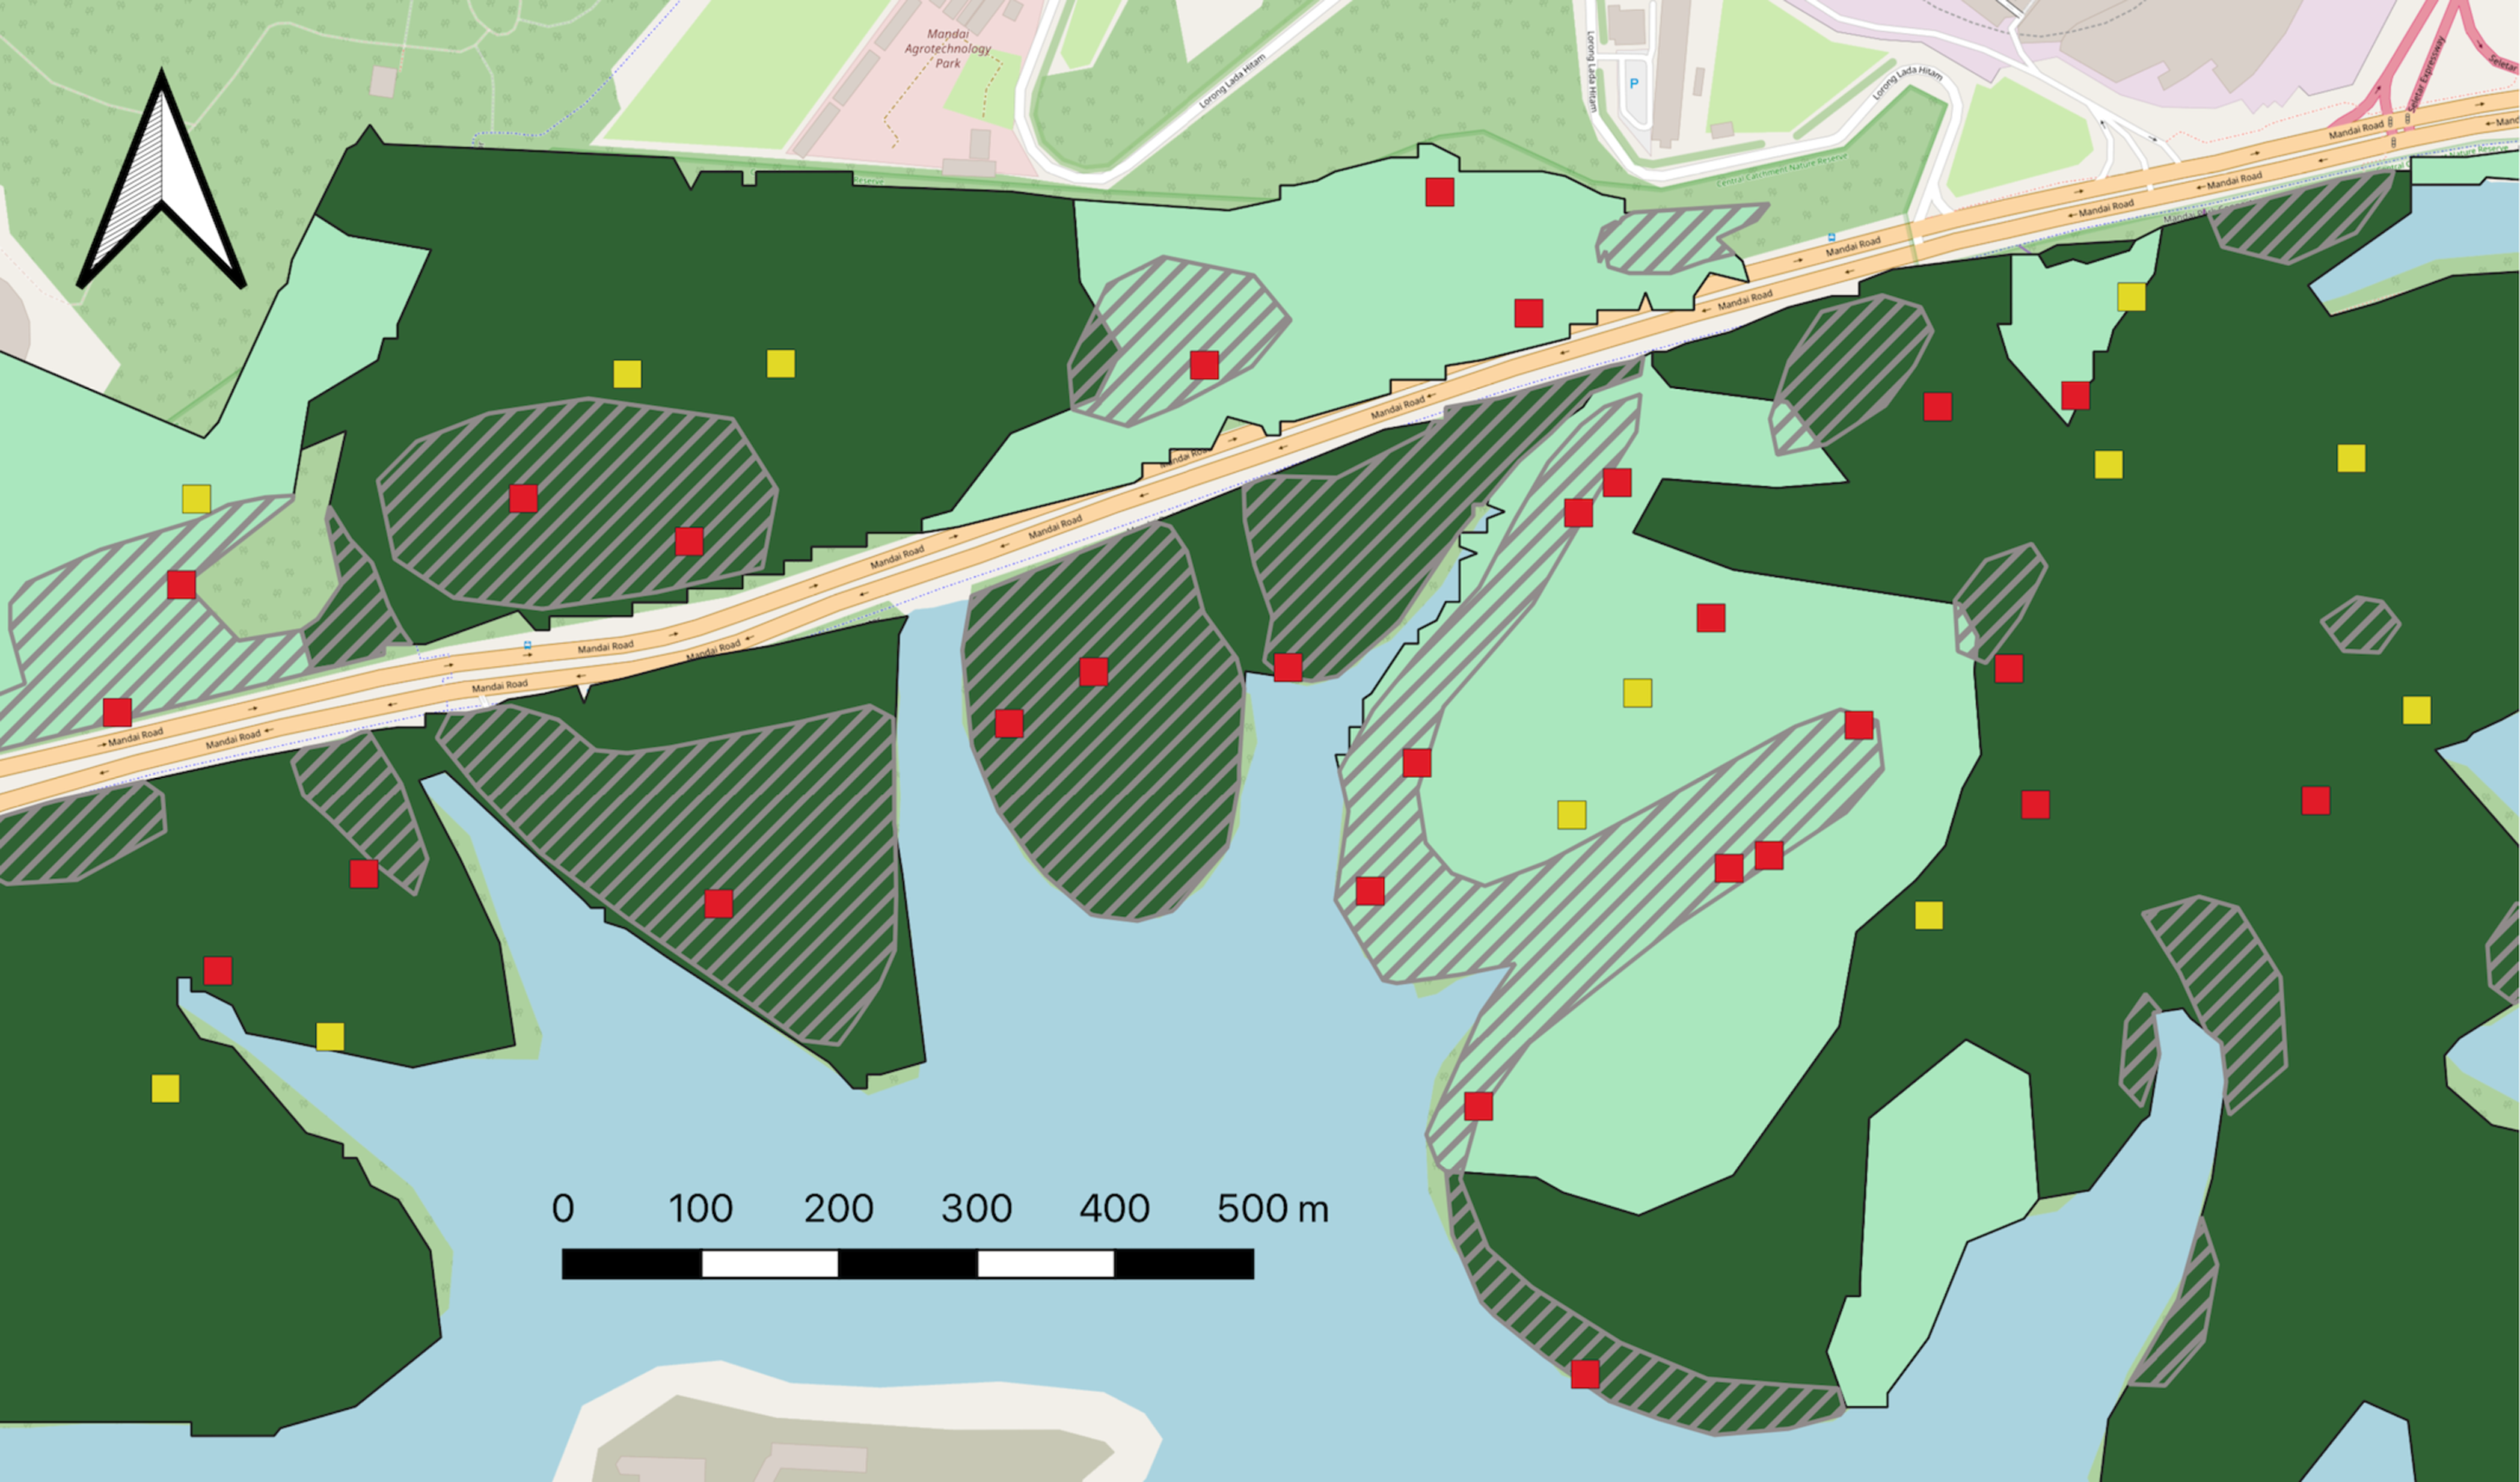
Figure 1. Long description
The map depicts the Mandai forest study site, illustrating plot locations and forest types affected by wind disturbances. Red squares represent affected plots, while yellow squares indicate unaffected plots. Dark green areas denote old-growth forest, and light-green areas represent young secondary forest. Hatched areas show the extent of blowdown damage estimated from aerial photographs in 2011. Plot types do not always correspond with the forest types and affected areas due to reclassifications after ground-truthing.
Data analyses
We extended the comparisons of forest structure (stem counts and total basal area), alpha (i.e., plot-level) diversity and community composition changes from 2011 to 2015 in Yee et al. (Reference Yee, Lai, Chong, Neo, Koh, Tan, Seah, Loh, Lim, van Breugel and Tan2019) to the data from the resurveys in 2023.
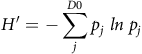
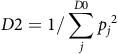
For alpha diversity, we calculated Hill’s numbers for three orders (Chao et al. Reference Chao, Chiu and Jost2014): zeroth-order, that is, species richness (D0); first-order (D1), that is, exponent of the Shannon–Wiener (H’) index,
 $H^{\prime} = - \sum\limits_j^{D0} {{p_j}}\,\, ln\;{p_j}$
 $D1 = {e^{H^\prime}}$
where pj is the relative proportion of stems of each species j out of all stems in the plot; and second-order (D2), that is, the inverse Simpson Index,
 $ D2=1/\sum\limits_j^{D0}{p_{j}}^{2} $
To examine the extent to which temporal trajectories of alpha diversity are coupled with that of stem densities, we also computed diversities rarefied to the same number of stems – 50, corresponding to the average number of stems in unaffected plots – in each plot.
For community composition, we conducted a partial redundancy analysis (RDA) of tree community composition in terms of stem counts with damage and forest types interacting with year of survey as constraining factors and the main effect of year as the covariate. RDA is a constrained ordination method based on Euclidean distance, and we presented the group loadings over the years, that is, principal response curves (PRC; van den Brink and ter Braak Reference van den Brink and ter Braak1998, Reference van den Brink and ter Braak1999) with the unaffected, old-growth forest plots as the reference group (i.e., same as Yee et al. Reference Yee, Lai, Chong, Neo, Koh, Tan, Seah, Loh, Lim, van Breugel and Tan2019). The statistical significance of each PRC axis was assessed with Monte Carlo permutation tests.
We tested if forest structure and alpha diversity changed from 2015 to 2023 using paired t-tests, focusing specifically on this interval because it corresponds to the hypothesised thinning phase following canopy closure documented in the earlier surveys (Lai et al. Reference Lai, Chong and Yee2022; Yee et al. Reference Yee, Lai, Chong, Neo, Koh, Tan, Seah, Loh, Lim, van Breugel and Tan2019). As our objective was to evaluate within-plot changes across the thinning phase rather than to model temporal trajectories, we used paired t-tests to directly assess differences between these two timepoints while accounting for repeated measurements of the same plots. We also examined if these variables and community composition were still significantly different between damage and forest type with a two-way analysis of variance; if the damage × forest type interaction was statistically significant, we followed up with all possible pairwise comparisons using Tukey’s correction for multiple testing. All data analyses were performed in R version 4.2.1 (R Core Team 2024). The calculation of diversity and RDA were conducted using the R package ‘vegan’ (Oksanen et al. Reference Oksanen, Simpson, Blanchet, Kindt, Legendre, Minchin, O’Hara, Solymos, Stevens, Szoecs, Wagner, Barbour, Bedward, Bolker, Borcard, Carvalho, Chirico, de Caceres, Durand, Evangelista, FitzJohn, Friendly, Furneaux, Hannigan, Hill, Lahti, McGlinn, Ouellette, Ribeiro Cunha, Smith, Stier, ter Braak and Weedon2024). Rarefied diversity was computed using the ‘iNEXT’ package (Hsieh et al. Reference Hsieh, Ma and Chao2025).
Results
In our 2023 follow-up survey, a total of 2,176 stems from 181 species were measured and tagged in 2023. This was a decrease of 45.5% in stems and 16.2% in number of species compared to the last survey in 2015 by Yee et al. (Reference Yee, Lai, Chong, Neo, Koh, Tan, Seah, Loh, Lim, van Breugel and Tan2019).
Forest structure
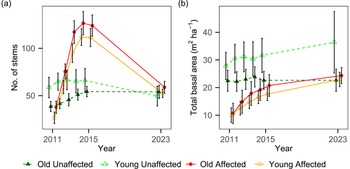
The mean (± s.e.) stem density in affected old-growth plots decreased by 52.5% from 123.9 ± 11.2 per 100 m2 in 2015 to 58.8 ± 6.23 per 100 m2 in 2023 (t = 9.50, df = 12, p-value < 0.001; Table S1), while that in affected young secondary plots decreased by 53.0% from 111.3 ± 9.5 per 100 m2 in 2015 to 52.3 ± 4.38 per 100 m2 in 2023 (t = 6.46, df = 14, p-value < 0.001; Figure 2a). The stem density in unaffected young secondary plots also seemed to decrease slightly, by 24.8% from 66.0 ± 12.8 per 100 m2 in 2015 to 49.6 ± 10.4 per 100 m2 in 2023 (t = 4.16, df = 4, p-value = 0.014). Meanwhile, the stem density in unaffected old-growth plots remained approximately constant from 54.4 ± 5.5 per 100 m2 in 2015 to 54.0 ± 7.0 per 100 m2 in 2023 (t = 0.0590, df = 6, p-value = 0.955). Stem densities were not significantly different between the four categories of plots in 2023 (F = 0.367; df = 3, 36; p-value = 0.777).
(a) Change in number of stems per plot from 2011 to 2023. (b) Change in plot total basal area (m2/ha) from 2011 to 2023. Vertical bars denote the standard errors of the mean.
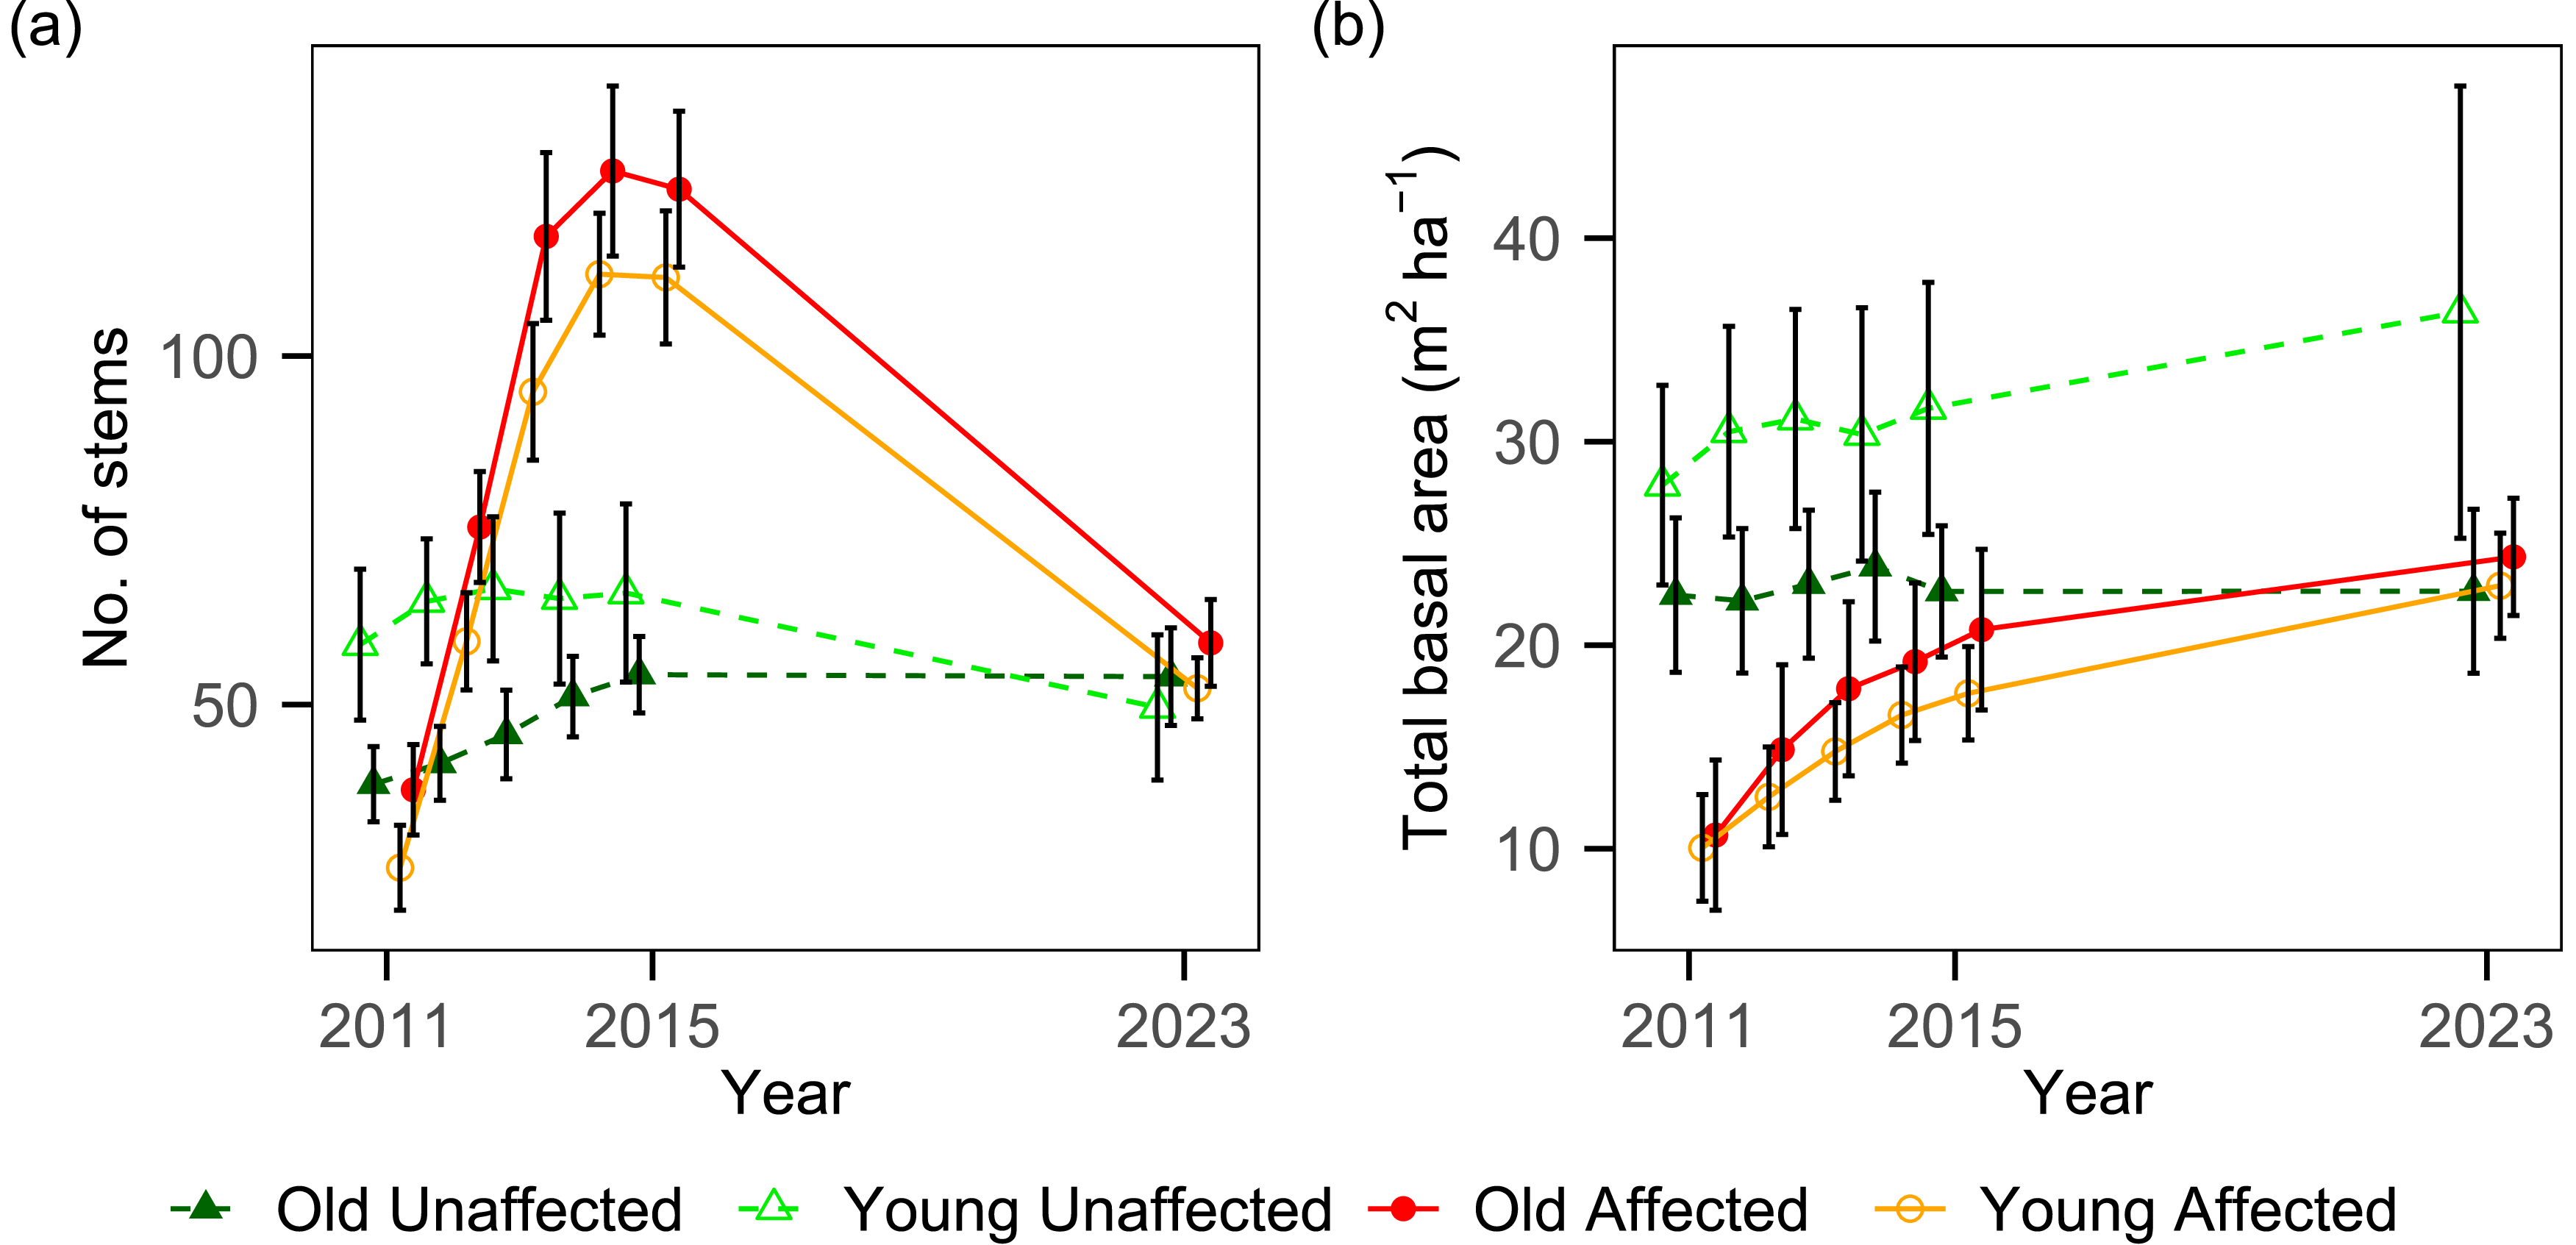
On the other hand, the total basal area of affected plots continued to increase from 2015 to 2023, albeit at a slower rate than from 2011 to 2015 (Figure 2b). The mean total basal area of affected old-growth plots increased by 16.8% from 20.8 ± 3.9 m2/ha to 24.3 ± 2.9 m2/ha, although this was statistically only marginally significant (t = 1.95, df = 12, p-value = 0.075), while that of affected young secondary plots increased by 30.1% from 17.6 ± 2.3 m2/ha to 22.9 ± 2.6 m2/ha (t = 2.40, df = 14, p-value = 0.031). Mean total basal area of unaffected young secondary forest plots also increased, by 15.2% from 31.7 ± 6.2 m2/ha to 36.4 ± 11.1 m2/ha, although with a larger variation between plots and this increase was not statistically significant (t = 0.912, df = 4, p-value = 0.413; Figure 2b). In contrast, mean total basal area of old unaffected plots remained approximately constant from 22.7 ± 3.3 m2/ha in 2015 to 22.7 ± 4.0 m2/ha in 2023 (t = 0.00223, df = 6, p-value = 0.998). Total basal area was also not significantly different between the four categories of plots in 2023 (F = 1.55; df = 3, 36; p-value = 0.219).
Alpha diversity
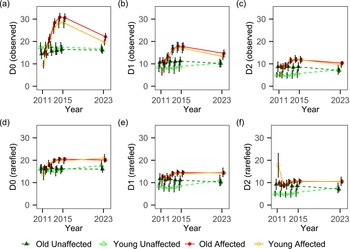
Zeroth-order alpha diversity (D0) most closely mirrors the changes in stem densities (Figures 2a, 3a), with mean species richness in old affected plots decreasing by 27.8% from 30.6 ± 1.8 species in 2015 to 22.1 ± 1.6 species in 2023 (t = 7.84, df = 12, p-value < 0.001), while that in young affected plots decreased by 30.1% from 28.3 ± 2.2 species in 2015 to 19.7 ± 1.3 species in 2023 (t = 6.13, df = 14, p-value < 0.001). In the same duration, mean species richness in unaffected plots remained approximately constant, that is, changes were not statistically significant; that in young unaffected plots decreased slightly by 3.4% from 17.4 ± 2.1 to 16.8 ± 1.8 species (t = 0.739, df = 4, p-value = 0.501), while that in old unaffected plots also decreased slightly by 1.8% from 16.4 ± 1.8 to 16.1 ± 1.5 species (t = 0.188, df = 6, p-value = 0.857). However, affected plots still had higher D0 than unaffected plots (F = 6.64; df = 1, 36; p-value = 0.014), while the interaction (F = 0.8004; df = 1, 36; p-value = 0.377) and forest type (F = 0.926; df = 1, 36; p-value = 0.342) terms were not statistically significant.
Change in observed (a–c) and rarefied (d–f) zeroth-order (a, d), first-order (b, e) and second-order tree alpha diversities from 2011 to 2023. Vertical bars denote the standard errors of the mean.
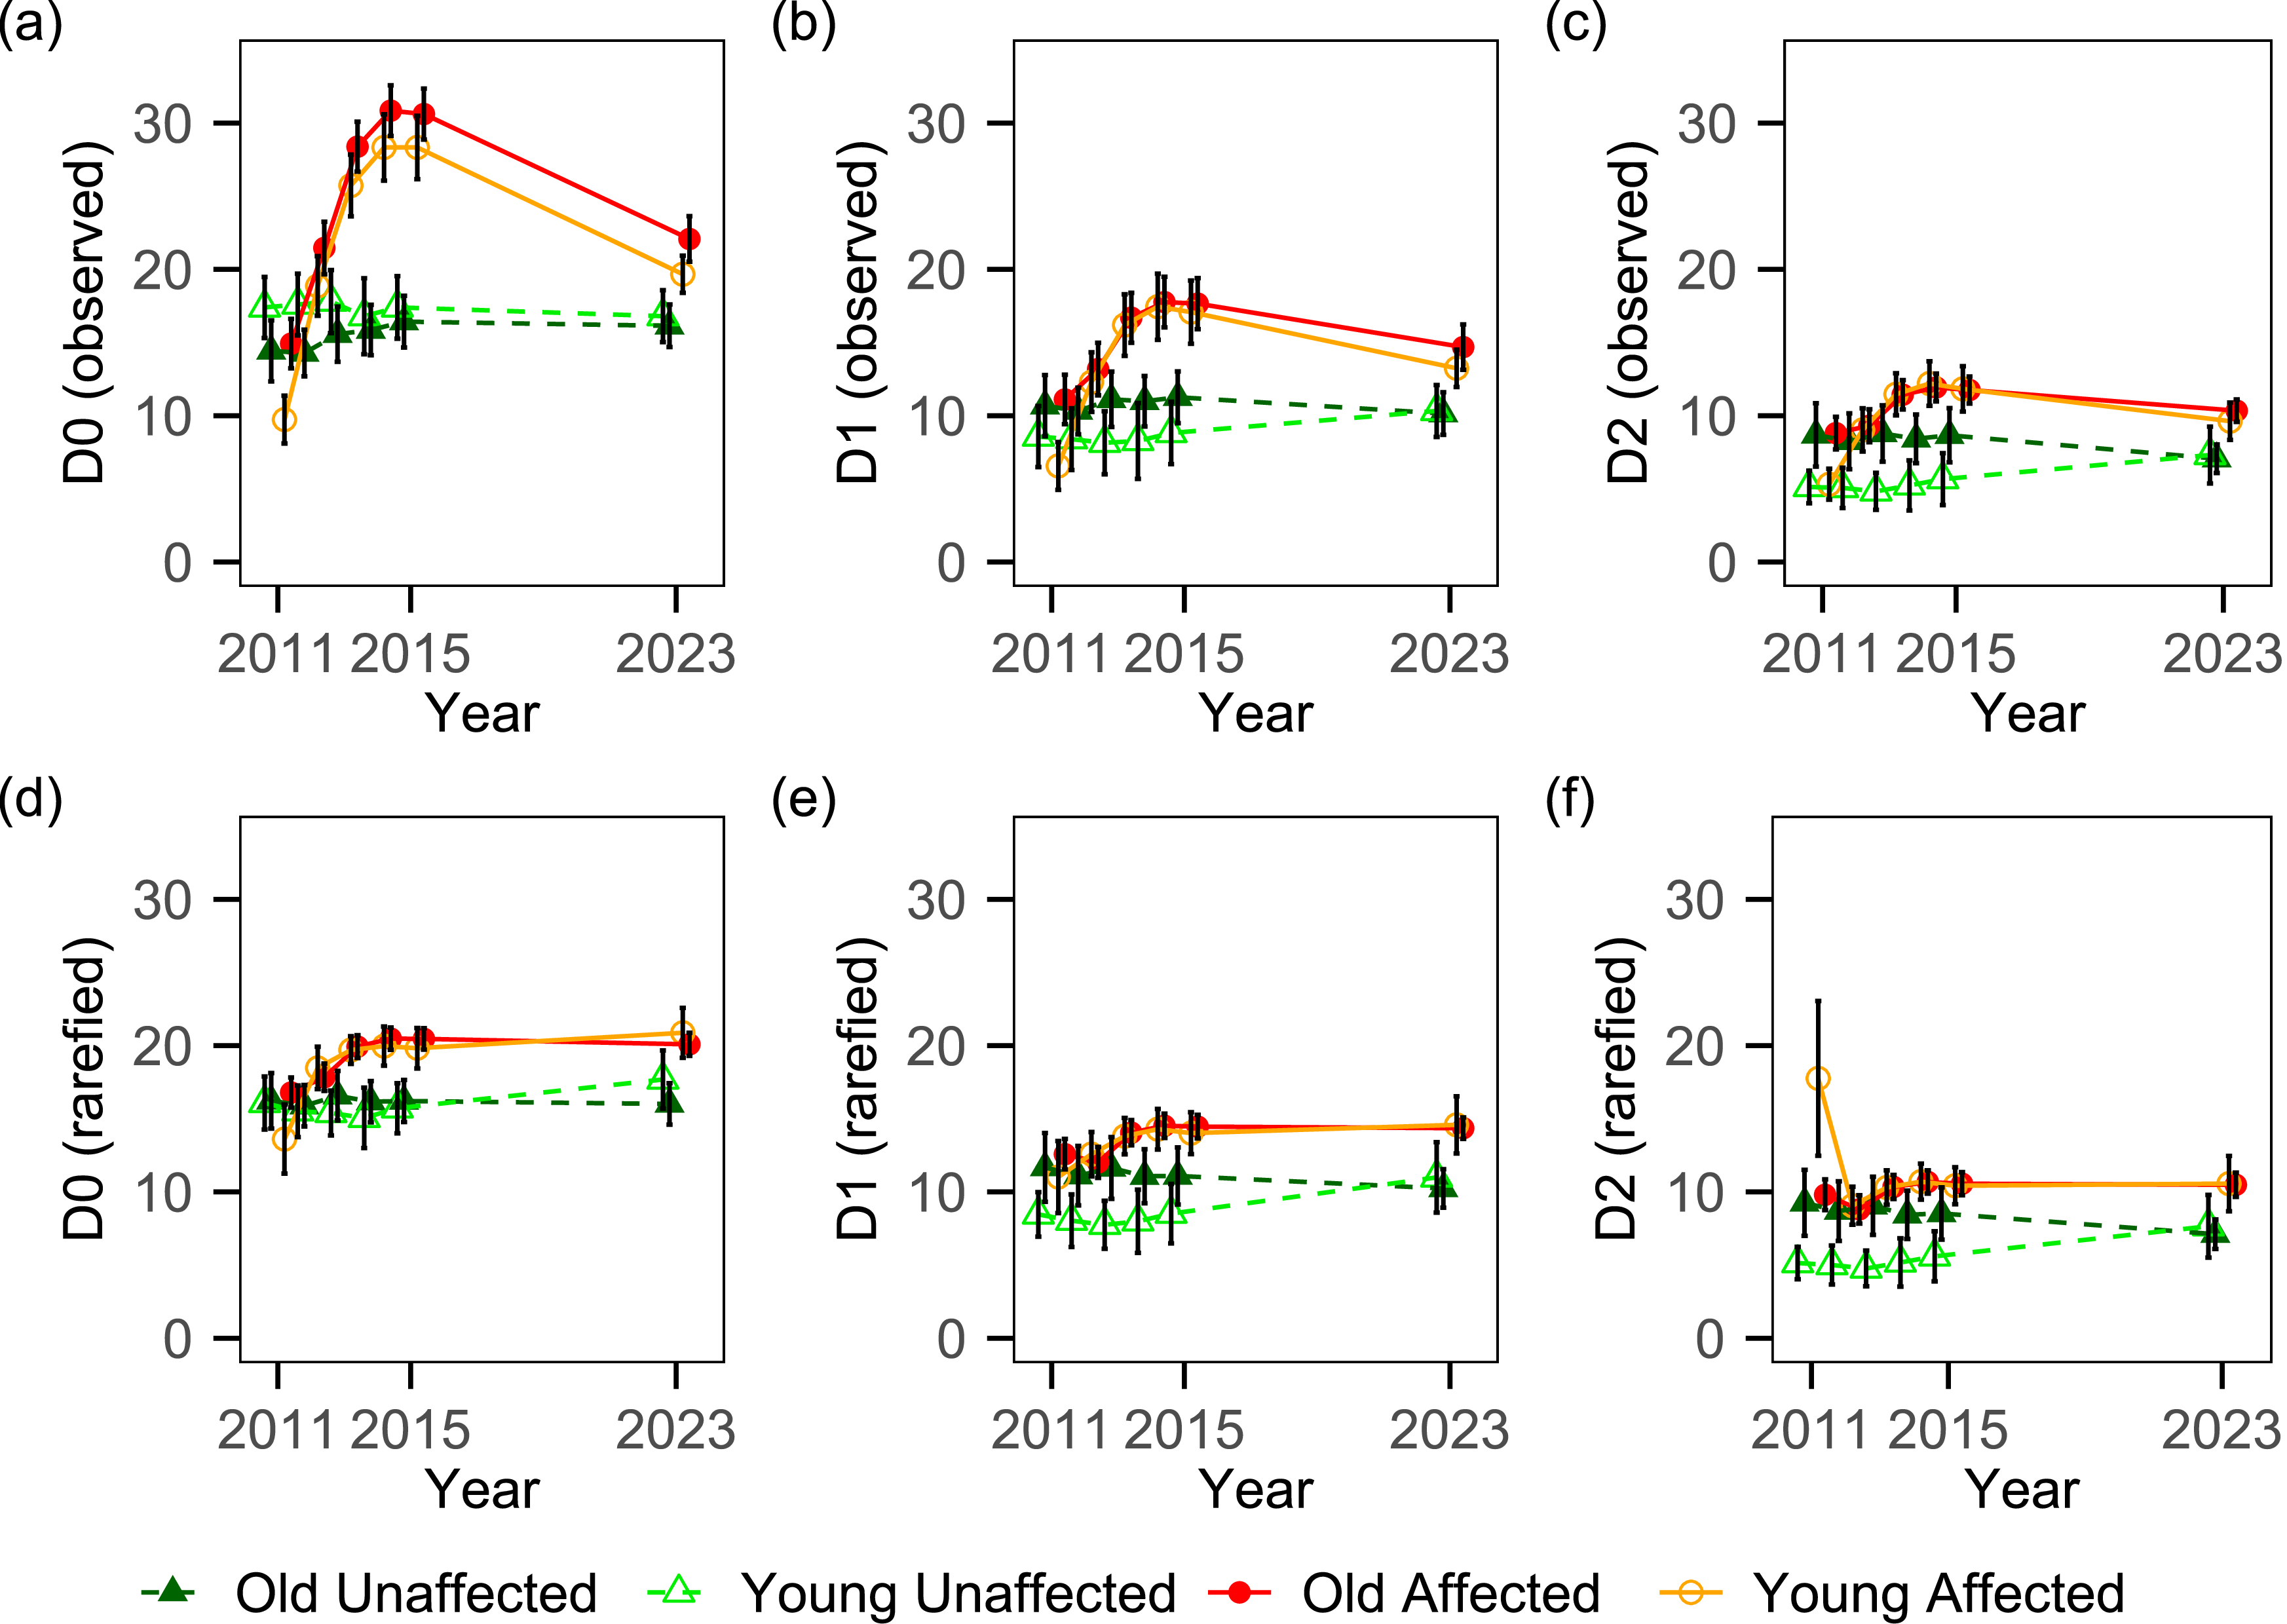
Figure 3. Long description
The image contains six line graphs depicting changes in observed and rarefied tree alpha diversities from 2011 to 2023. Panel A: A line graph shows the observed zeroth order tree alpha diversity over time. The x-axis represents the year, ranging from 2011 to 2023, and the y-axis represents the observed diversity, ranging from 0 to 30. Different lines represent old unaffected, young unaffected, old affected, and young affected categories. Panel B: A line graph shows the observed first order tree alpha diversity over time. The x-axis represents the year, ranging from 2011 to 2023, and the y-axis represents the observed diversity, ranging from 0 to 30. Different lines represent old unaffected, young unaffected, old affected, and young affected categories. Panel C: A line graph shows the observed second order tree alpha diversity over time. The x-axis represents the year, ranging from 2011 to 2023, and the y-axis represents the observed diversity, ranging from 0 to 30. Different lines represent old unaffected, young unaffected, old affected, and young affected categories. Panel D: A line graph shows the rarefied zeroth order tree alpha diversity over time. The x-axis represents the year, ranging from 2011 to 2023, and the y-axis represents the rarefied diversity, ranging from 0 to 30. Different lines represent old unaffected, young unaffected, old affected, and young affected categories. Panel E: A line graph shows the rarefied first order tree alpha diversity over time. The x-axis represents the year, ranging from 2011 to 2023, and the y-axis represents the rarefied diversity, ranging from 0 to 30. Different lines represent old unaffected, young unaffected, old affected, and young affected categories. Panel F: A line graph shows the rarefied second order tree alpha diversity over time. The x-axis represents the year, ranging from 2011 to 2023, and the y-axis represents the rarefied diversity, ranging from 0 to 30. Different lines represent old unaffected, young unaffected, old affected, and young affected categories. Vertical bars denote the standard errors of the mean.
First- (D1) and second-order (D2) alpha diversities for affected plots similarly decreased from 2015 to 2023, with mean D1 and D2 of old affected plots decreasing by 16.9% (t = 2.89, df = 12, p-value = 0.013) and 12.7% (t = 1.67, df = 12, p-value = 0.120), respectively, although this was not statistically significant for D2; and mean D1 and D2 of young affected plots decreased by 22.8% (t = 3.35, df = 14, p-value = 0.005) and 18.6% (t = 1.99, df = 14, p-value = 0.067), respectively, within this duration (Figure 3b-c). Changes in D1 and D2 of unaffected plots, like for D0, were also not statistically significant, but in terms of the direction of change they were different from their corresponding D0 changes and between the two forest types: mean D1 and D2 of old unaffected plots decreased by 10.6% (t = 0.788, df = 6, p-value = 0.461) and 18.4% (t = 1.37, df = 6, p-value = 0.236), respectively, from 2015 to 2023, while mean D1 and D2 of young unaffected plots increased by 17.0% (t = 1.11, df = 4, p-value = 0.328) and 28.1% (t = 1.39, df = 4, p-value = 0.238), respectively, within the same duration. As with D0, the affected plots were higher in D1 (F = 6.3; df = 1, 36; p-value = 0.017) and D2 (F = 4.30; df = 1, 36; p-value = 0.045) than the unaffected plots in 2023, while the interaction (D1: F = 0.299; df = 1, 36; p-value = 0.588; D2: F = 0.126; df = 1, 36; p-value = 0.725) and forest type (D1: F = 0.511; df = 1, 36; p-value = 0.479; D2: F = 0.121; df = 1, 36; p-value = 0.730) terms were not statistically significant.
On rarefying to a common stem density (50 stems per 100 m2), there were only differences between affected and unaffected plots for rarefied D0 (F = 5.01; df = 1, 36; p-value = 0.032) and D1 (F = 4.34; df = 1, 36; p-value = 0.044). There were no statistically significant differences for rarefied D2 and in changes in rarefied diversities for the categories of plots between 2015 and 2023 (Figure 3d–f).
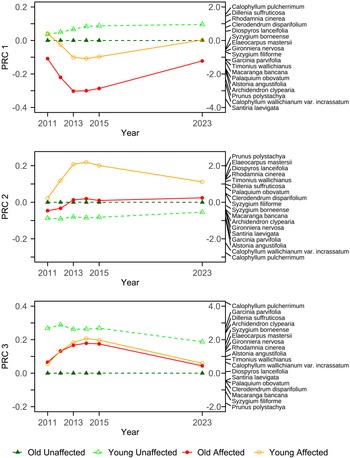
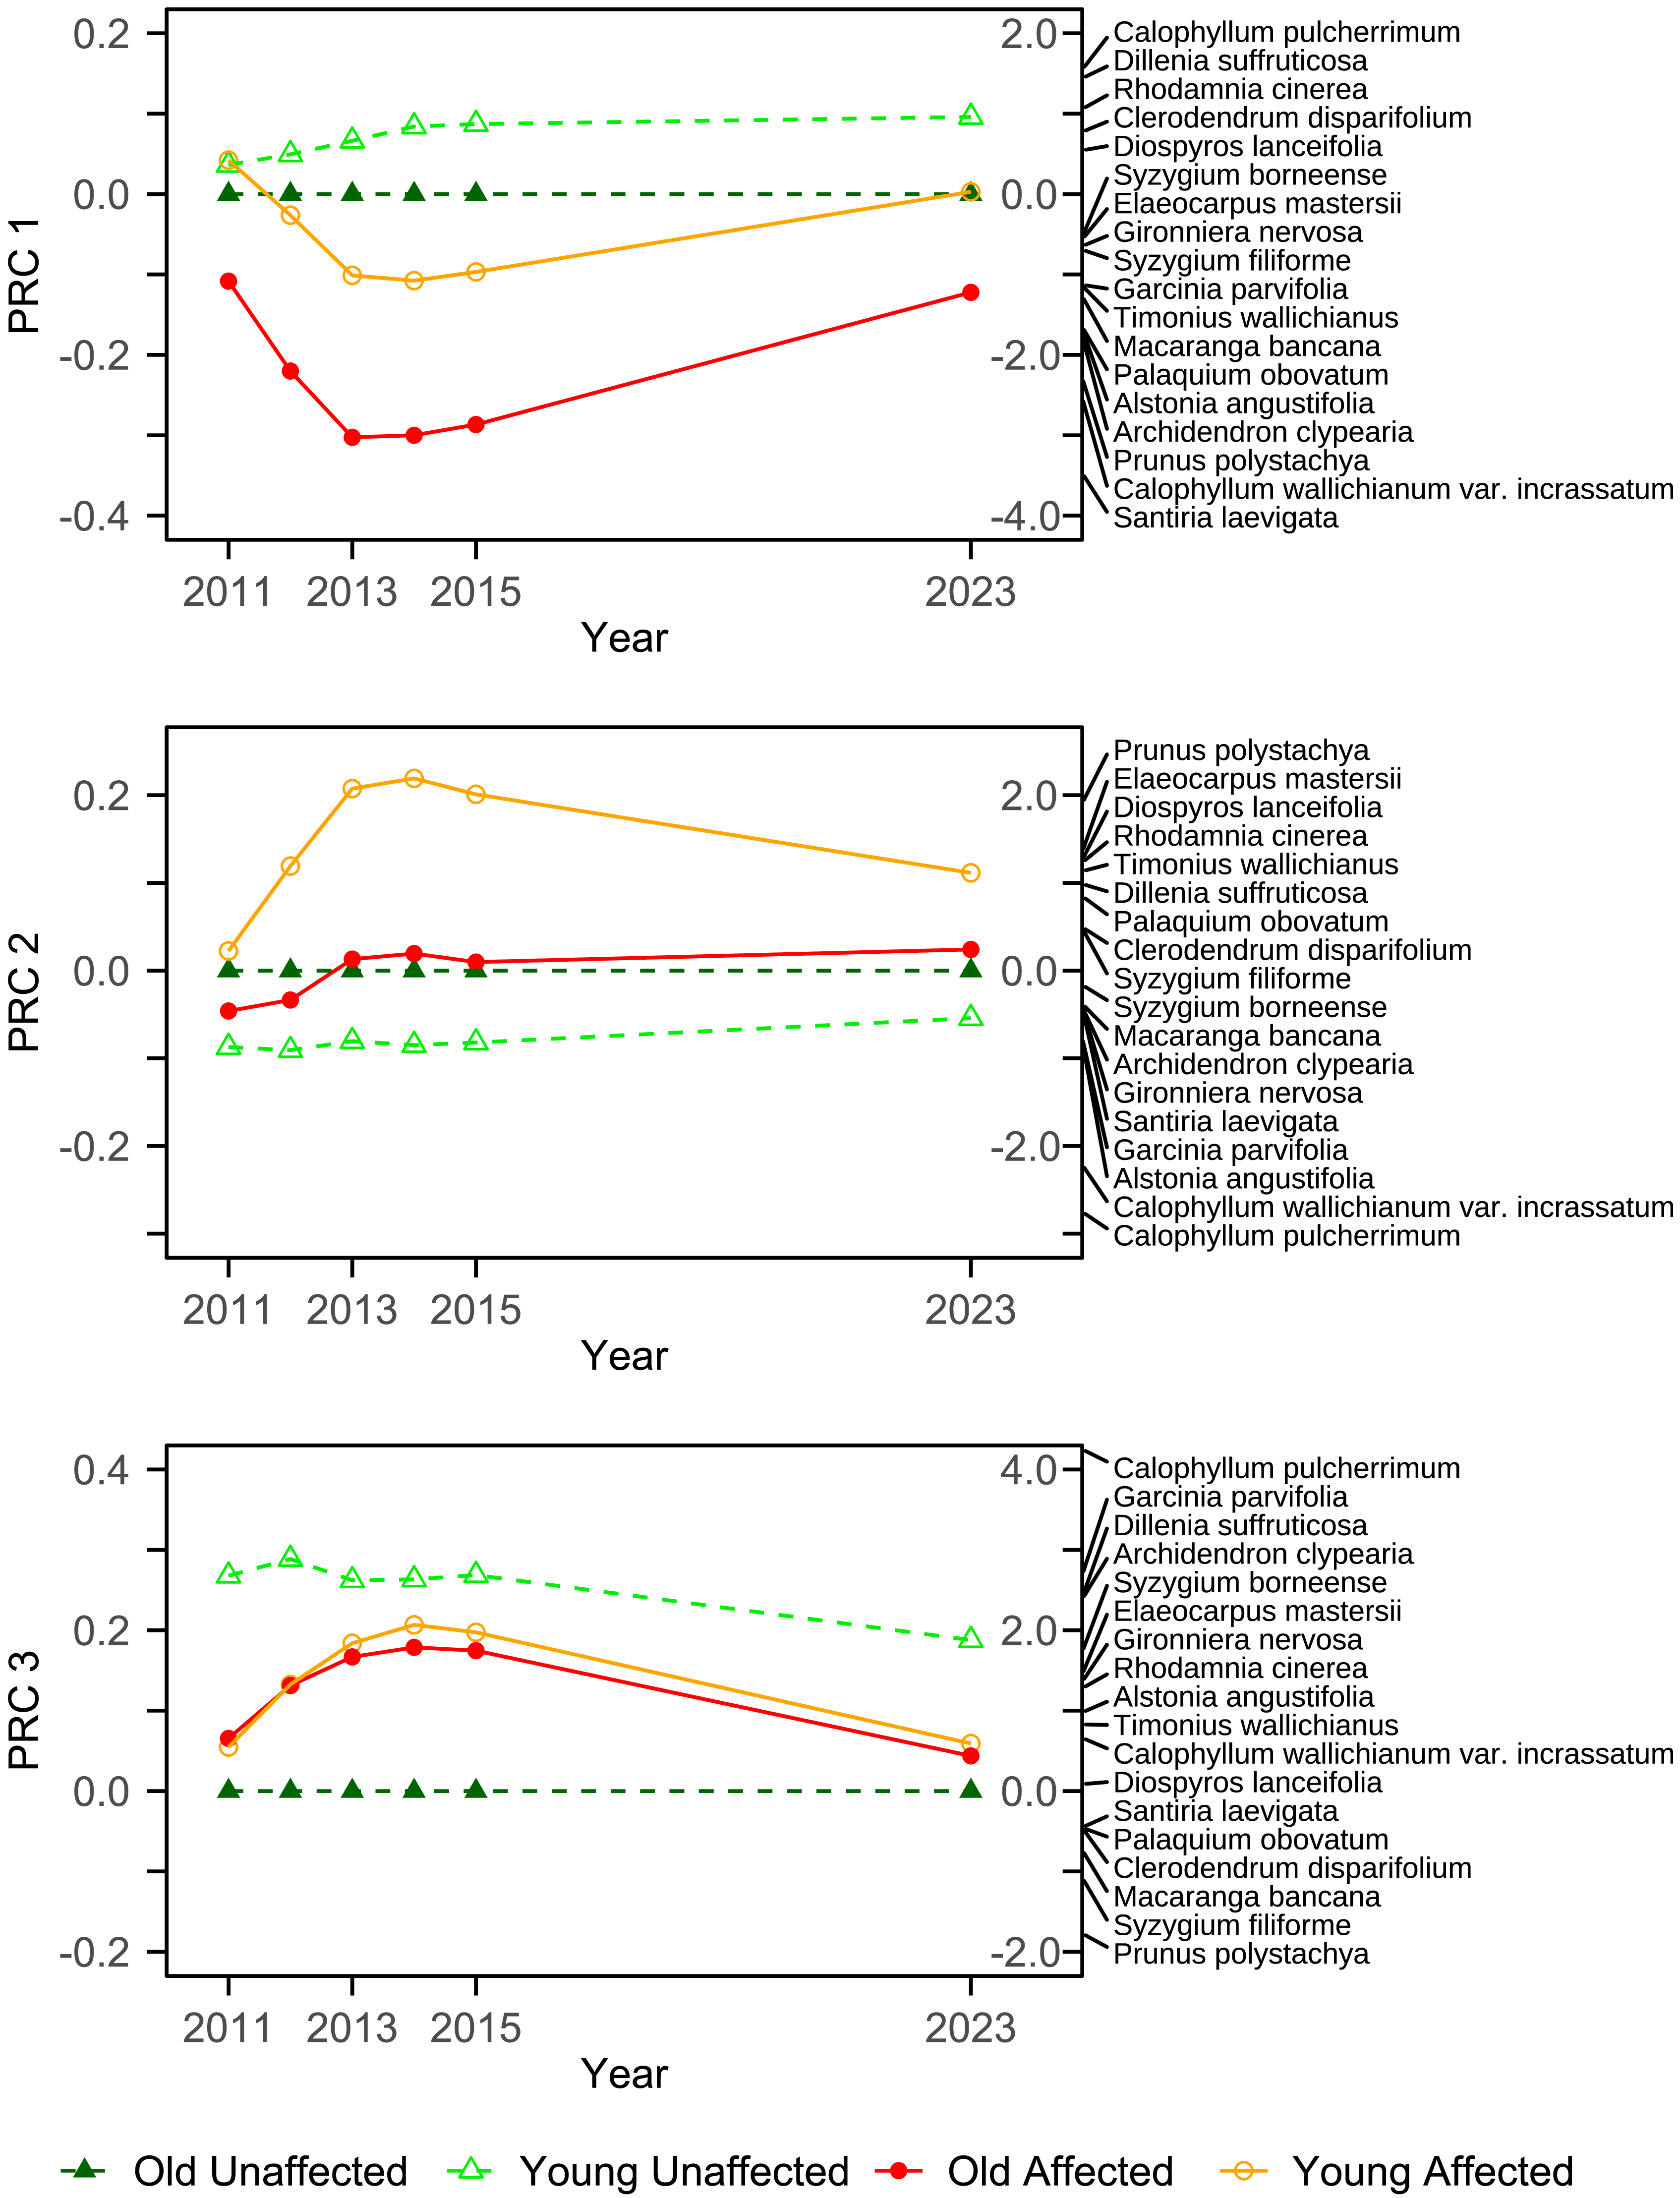
Changes in tree community compositions after the windstorm event in 2011, along the first three axes of the principal response curves. The axis scales on the left are for the coefficients of each forest type; old-growth, unaffected forest plots serve as the reference group. The axis scales on the right are for the species coefficients; only the top 18 species in terms of importance value are shown.
Community composition
As with Yee et al. (Reference Yee, Lai, Chong, Neo, Koh, Tan, Seah, Loh, Lim, van Breugel and Tan2019), the first to third PRC axes were significant in Monte Carlo permutated F tests (PRC axis 1: F = 8.95; df = 1, 216; permutated p-value = 0.001; PRC axis 2: F = 5.76; df = 1, 216; permutated p-value = 0.001; PRC axis 3: F = 4.13; df = 1, 216; permutated p-value = 0.020), while the fourth axis (F = 1.09; df = 1, 216; permutated p-value = 1.00) onwards were not. PRC axis 1 showed that community composition of affected plots of both old-growth and young secondary forest types returned to closer similarity with that of unaffected plots from 2013 to 2023 after diverging from 2011 to 2013 (Figure 4). However, community composition in 2023 in terms of PRC axis 1 was still significantly different between affected versus unaffected plots (F = 10.0; df = 1, 36; p-value = 0.003) and between old-growth versus young secondary forest plots (F = 17.6; df = 1, 36; p-value < 0.001), while the interaction term was not significant (F = 0.229; df = 1, 36; p-value = 0.635). PRC axis 2 showed an additional axis of variation in community composition where affected young secondary forest plots returned to closer similarity with unaffected plots as well as affected old-growth plots from 2013 to 2023 after diverging from 2011 to 2013 (Figure 4); however, community composition of affected young secondary forest plots in terms of PRC axis 2 were still different from the other three categories of plots (interaction term: F = 8.56; df = 1, 36; p-value = 0.006; Table S2) in 2023. PRC axis 3 showed the community compositions of affected plots of both young secondary and old-growth forest plots returning to closer similarity with unaffected old-growth plots from 2014 to 2023 after shifting away and towards closer similarity with unaffected young secondary forest plots from 2011 to 2014 (Figure 4); by 2023, affected plots were no longer significantly different in terms of PRC axis 3 from unaffected old-growth plots in terms of PRC axis 3 (interaction term: F = 8.17; df = 1, 36; p-value = 0.007; Table S3).
Discussion
The stem densities in affected plots more than halved across the eight years between 2015 and 2023, confirming that the thinning phase had occurred during this period. The steep initial increase in stem counts documented in affected plots from 2011 to 2015 followed by the significant reduction observed after 2015 (Figure 2b; Yee et al. Reference Yee, Lai, Chong, Neo, Koh, Tan, Seah, Loh, Lim, van Breugel and Tan2019) is therefore consistent with the building/stem initiation and thinning/stem exclusion phases of forest regeneration (Oliver and Larson Reference Oliver and Larson1990; Vandermeer et al. Reference Vandermeer, Boucher, Perfecto and Granzow-de la Cerda1996; Vandermeer et al. Reference Vandermeer, Boucher, Granzow--de-la Cerda and Perfecto2001). Despite more than halving in the number of stems, the total basal area of affected plots continued to increase, though at a slower rate than observed before from 2011 to 2015. The basal area recovery trajectory observed is corroborated by past studies which show that basal area recovery slows down over time after wind disturbance (de Oliveira et al. Reference de Oliveira, Durigan and Putz2021; Lugo Reference Lugo2008; Yee et al. Reference Yee, Lai, Chong, Neo, Koh, Tan, Seah, Loh, Lim, van Breugel and Tan2019). While Yee et al. (Reference Yee, Lai, Chong, Neo, Koh, Tan, Seah, Loh, Lim, van Breugel and Tan2019) found that the basal area of affected forests had reached levels similar with that of unaffected forests by the fifth post-disturbance year, the findings of this study show that the recovery of basal area persists through at least the early part of the thinning phase.
Interestingly, young unaffected plots also displayed a small degree of thinning in terms of stem counts. These plots could have experienced a lesser yet non-negligible extent of damage from the windstorm, for example, defoliation; Yee et al. (Reference Yee, Lai, Chong, Neo, Koh, Tan, Seah, Loh, Lim, van Breugel and Tan2019) found that both affected and unaffected plots had similar leaf litter depths and spikes in soil total N, extractable P and extractable K in the first few years after the windstorm. Hence, there could have been increased recruitment initially even in unaffected young secondary forest plots which still resulted in a certain degree of thinning later on. On the other hand, this may have also been simply the detection of ongoing succession in the young secondary forest plots, where the thinning process during succession after the older, land use history-associated (rather than windstorm-associated) disturbances are still ongoing. This would be in line with the increase – though non-statistically significant – in first and second orders of diversity that were observed in the unaffected young secondary forest plots, as expected with early succession (Purschke et al. Reference Purschke, Schmid, Sykes, Poschlod, Michalski, Durka, Kühn, Winter and Prentice2013).
Alpha diversity of affected plots decreased in tandem with the loss of stems during thinning, while that of unaffected plots generally remained the same. However, zeroth- and first-order diversities rarefied to the same number of stems were still elevated in the affected plots compared to the unaffected plots. This suggests that wind disturbance did promote species richness and diversity in ways that were not accounted for by the ‘sampling effect’ of increased stem densities, and this effect lasted throughout the period of our monitoring post-disturbance. The absence of difference in second-order diversity between affected and unaffected plots, however, indicates that the observed elevated diversity can likely be attributed to the persistence of rarer species rather than shifts in more common, dominant taxa. Following the windstorm, the canopy gaps likely created heterogenous light and microsite conditions that facilitated the recruitment of a broader range of species, including rarer species that are less-frequently established under closed canopy conditions (Brokaw Reference Brokaw1985). Although canopy structure subsequently recovered, some of these rarer recruits could have persisted at low abundances into the thinning phase, maintaining elevated richness and Shannon diversity levels. These prolonged disturbance effects are consistent with established models of gap-phase regeneration and tropical forest succession (Chazdon Reference Chazdon2003; Connell Reference Connell1978) and may be attributed to persistence of microsite heterogeneity within the plots or negative density dependence (Comita et al. Reference Comita, Muller-Landau, Aguilar and Hubbell2010; Vandermeer et al. Reference Vandermeer, Boucher, Perfecto and Granzow-de la Cerda1996).
There was a likely peak in dissimilarity between affected and unaffected plots in the third year after the disturbance, followed by some evidence for a gradual convergence in species composition trajectories thereafter. This primary disturbance signal was captured in PRC axis 1, but the convergence was not yet complete 12 years after the disturbance event. Species loadings on PRC axis 1 indicate an ecological spectrum ranging from species that persist for long periods in the shaded forest understorey such as Calophyllum pulcherrimum, Dillenia suffruticosa and Rhodamnia cinerea, to species that recruit and accelerate growth in canopy gaps such as Alstonia angustifolia, Archidendron clypearia, Calophyllum wallichianum var. incrassatum, Macaranga bancana, Palaquium obovatum, Prunus polystachya, Santiria laevigata and Timonius wallichianus. There was an additional dimension of variation in species composition trajectories in PRC axis 2, with a similar peak in dissimilarity in young affected forest plots in the third year which was not observed in the old-growth affected forest plots, and which had not completely converged with the other groups after 12 years. Species that loaded strongly to this variation were Diospyros lanceifolia, Elaeocarpus mastersii, Prunus polystachya, and Rhodamnia cinerea on one end and Calophyllum pulcherrimum and Calophyllum wallichianum var. incrassatum on the other. These species likely reflect the differences in young secondary versus old-growth forests when tree fall gaps occur. PRC axis 3 highlighted yet another aspect of successional trajectories. The increase in stem densities of some species: Archidendron clypearia, Calophyllum pulcherrimum, Dillenia suffruticosa, Garcinia parvifolia, Gironniera nervosa and Syzygium borneense in both young secondary and old-growth affected plots during the building phase brought them to greater similarity with unaffected young secondary forest compared with unaffected old-growth forest during the building phase, although with the thinning phase the community composition along this dimension returned towards the direction of unaffected old-growth forest with more Prunus polystachya and Syzygium filiforme.
Past experimental observations on logging treatments documented similar hump-shaped trajectories of community composition but over time periods different to what we have observed, with dissimilarity from undisturbed plots peaking between 15 and 25 years, before converging back towards undisturbed compositions (Mirabel et al. Reference Mirabel, Hérault and Marcon2020). Similarly, simulations of forest fire disturbance on temperate forests found that the convergence in species composition between affected forests and unaffected forests was very slow, with species composition still differing significantly after the simulation timeframe of 500 years (Seidl et al. Reference Seidl, Rammer and Spies2014). The incomplete convergence in species composition observed in this study could be possibly attributed to the relatively short timeframe of 12 years after the initial windstorm which could have been a relatively low-intensity disturbance compared to logging or fire, even if this particular event was vast in spatial scale compared to typical wind disturbance events in hurricane-free areas. Nonetheless, these observations reveal that wind disturbances have legacies on species composition that last more than a decade. Interestingly, a long-term study on hurricane damage on a neotropical forest found that species composition had changed after 50 years, though the change is attributed to the loss of pioneer and secondary species and the dominance of climax species (Lugo Reference Lugo2008; Weaver Reference Weaver1989). This could indicate that wind disturbances hasten the progress of succession (Zhao et al. Reference Zhao, Allen and Sharitz2006), and the legacies of wind disturbances may endure over a period of decades or even centuries.
Wind disturbances are an important type of disturbance even in the hurricane-free equatorial tropics, but in this region usually occur at small scales that create small gaps which can only fit one or a few small plots. Extensive area and patchy distribution of tree falls in the large-scale natural disturbance event leading to our study allowed for a large number of replicates in a single study to examine with sufficient statistical power. With climate change, extreme weather events will increase in frequency, which in turn means that tree fall gaps can be expected to be larger and more frequent (Gora et al. Reference Gora, McGregor, Muller-Landau, Burchfield, Cushman, Rubio, Biem Mori, Sullivan, Chmielewski and Esquivel-Muelbert2025); how this change in disturbance regime will affect the structure and composition of tropical forests is unclear. Our results show that diversity, after accounting for stem abundance effects, was elevated after the disturbance, and while community composition had partially converged between directly impacted and less disturbed areas, there remained differences at the end of the 12-year study period. Most studies of wind disturbances are in areas frequented by hurricanes and also concentrated in the Neotropics (Lin et al. Reference Lin, Hogan and Chang2020); there is a need for more studies in other tropical regions such as the Asia-Pacific. There are also few studies on the thinning phase because this requires persistence of monitoring beyond the initial few years after the disturbance event. The plots in our study area will therefore provide valuable data and insights if they continue to be monitored for the long term.
Nonetheless, our study has several limitations. The relatively small size of our plots (10 × 10 m) increases their sensitivity to stochastic demographic events. They are also more likely to be influenced by variations in microsite conditions, compared to larger plots which are able to smooth out random demographic noise contributed by microsite variation. The classification of our plots into discrete damage categories may also impair our ability to capture finer variations in extent of damage. Additionally, because of our specific focus on the thinning phase, we analysed changes in forest structure and alpha diversity by using paired t-tests between two timepoints rather than modelling longer-term temporal trajectories over multiple timepoints using a mixed effect model, which could reveal broader temporal patterns. The establishment of a more extensive network of larger plots in the region, more robust determinations of damage extent and forest age and the use of functional traits to predict demographic responses will enhance the current understanding of forest recovery phases and dynamics.
Conclusion
Stem counts in affected plots reduced significantly between 5 and 12 years after the windstorm event, confirming the occurrence of the thinning phase. The reduction in basal area from loss of stems was more than offset by individual tree growth leading to overall continued increase in total basal area. Plot-level richness closely tracked the changes in stem counts, but not necessarily so for higher orders of diversity that account for evenness in relative abundances. Affected plots were found to be converging in species composition towards that of unaffected plots but not yet completely, indicating that succession was proceeding towards the pre-disturbance assemblage but still ongoing during this timeframe. This study offers a comprehensive groundwork for future studies on both the building and thinning phases of succession in Singapore and the region.
Supplementary material
The supplementary material for this article can be found at https://doi.org/10.1017/S0266467426100613.
Acknowledgements
We are grateful to our many field helpers, especially Charlotte Lim, Janebelle Koh, Tay Rui En and members of the Long-Term Forest Ecological Monitoring project team: Rie Chong, Soh Sun Yi, Muhammad Khairuldin, Lim Yi He, See Toh Ee Kin, Clara Choo, Leow Si Ying, Alicia Ong and Kelly Soo for assistance with fieldwork and plant identification.
Financial support
This study was funded by the Department of Biological Sciences, National University of Singapore and the National Parks Board, Singapore.
Competing interests
The authors declare none.