Implications
This study suggests that grass silage promotes rumen microbial growth more than maize silage when both forages are incubated under the same conditions in a rumen simulation technique (Rusitec). The changes in composition and contribution of microbial fractions give indications to a shift in microbial community as a result of variation of silage type and feed particle size. A standardisation in the milling of feedstuffs would improve comparability of Rusitec studies. Further research in identifying the accountability of dietary factors, for example, the amount and type of crude protein, on microbial protein synthesis in continuous culture systems is needed.
Introduction
Microbial protein leaving the rumen is the most important source of amino acids (AA) to meet the requirements for maintenance and performance in ruminants. The amount and efficiency of microbial CP synthesis (EMPS) depends on the availability of energy and N in favour of the microbial growth (Clark et al., Reference Clark, Klusmeyer and Cameron1992; Stern et al., Reference Stern, Varga, Clark, Firkins, Huber and Palmquist1994). Variable proportions of feedstuffs in the diet alter the availability of carbohydrates and CP to microbial protein synthesis. As shown by Boguhn et al. (Reference Boguhn, Kluth and Rodehutscord2006a and Reference Boguhn, Kluth and Rodehutscord2006b), maize silage and grass silage in total mixed rations seemed to affect the EMPS, as well as the microbial AA profile in vitro (rumen simulation technique (Rusitec)). Both forages differ in their nutrient composition. Grass forages typically contain no starch, and maize silages are known for lower concentrations of CP and fibre fractions than grass silages. Therefore, it is assumed that a combination of both forages could promote microbial CP synthesis in terms of synchronisation of available energy and N.
The use of rumen simulations allows the quantification of daily microbial N yield with less effort and under more constant conditions than in vivo (Stern et al., Reference Stern, Varga, Clark, Firkins, Huber and Palmquist1994). The feedstuffs are usually reduced in particle size by milling or cutting before incubation. Those changes in physical characteristics also affect the availability of nutrients, both in the amount and in the course over time (Michalet-Doreau and Ould-Bah, Reference Michalet-Doreau and Ould-Bah1992). A variation in feed particle size (1 v. 3 mm sieve size) affected ruminal N metabolism in continuous culture fermenters, but the effects depended on the microbial fraction that was analysed (Rodríguez-Prado et al., Reference Rodríguez-Prado, Calsamiglia and Ferret2004). These authors supported the concept that the origin of the microbial samples is very important for the estimation of the microbial AA amount. Differences in the AA profile between and within the microbial fractions isolated from the solid and the liquid phases of a Rusitec were found when the availability of nutrients was varied (Boguhn et al., Reference Boguhn, Kluth and Rodehutscord2006b). The effect of feed particle size as an additional dietary factor on the synthesis of microbial CP and AA profile of microbial fractions in the Rusitec has not been clarified yet.
The first objective of this study was to identify the maize silage to grass silage ratio at which the maximum amount and EMPS occurs, and in which way the variation in particle size plays a role in a Rusitec system. We hypothesised that a combination of maize silage and grass silage benefits microbial N yield and EMPS to a higher extent than using either forage source separately. Furthermore, it should be clarified to what extent microbial fractions differ in their AA profile and their contribution to AA yield in response to variations in forage source and particle size distribution in the diet. As both dietary factors influence the availability of nutrients, interactions between diet and particle size on microbial CP synthesis might occur.
Material and methods
Treatments
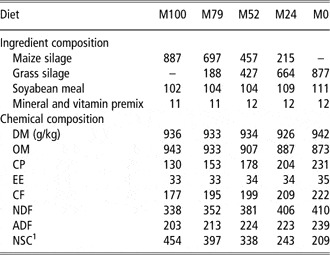
Maize silage and grass silage used in this study originated from a dairy cow farm near Halle upon Saale, Germany. The dry matter content was 350 g/kg (maize silage) and 380 g/kg (grass silage), and the pH values 3.72 and 4.21, respectively. The concentrations of acetic acid, propionic acid, butyric acid and lactic acid were 25.1, 0.6, 0.3 and 56.6 g/kg dry matter for maize silage and 6.2, 0.3, 0.3 and 92.2 g/kg dry matter for grass silage. Ammonia-N content was 116 mg/g total N in maize silage and 43 mg/g total N in grass silage. Five diets were composed to match a forage proportion of about 0.88 in the diet (Table 1). The diets, namely M100, M79, M52, M24 and M0 were characterised by maize silage to grass silage ratios of 100 : 0, 79 : 21, 52 : 48, 24 : 76 and 0 : 100, respectively. Soyabean meal was included at a proportion of approximately 0.11 across all diets in order to reach a minimum CP concentration of 130 g/kg dry matter. The stepwise replacement of maize silage by grass silage from diet M100 to diet M0 was accompanied by an increase in CP concentration of up to 231 g/kg dry matter in diet M0, and by an increase in fibre fractions (crude fibre, NDF and ADF). The maize silage contained 323 g starch per kg dry matter, and a change in dietary maize starch content proportional to the inclusion rate of maize silage was assumed. Differences in starch content were also reflected by the calculated fraction of non-structural carbohydrates (NSC; Table 1). In order to realise a variation in particle size distribution, the oven-dried diets (65°C) were ground through sieves with a pore size of 1 or 4 mm (cutting mill, Pulverisette 15, Fritsch GmbH, Idar-Oberstein, Germany). Hence, each diet was proofed at fine (F) and coarse (C) particle size.
Composition of experimental diets (g/kg DM)

DM = dry matter; OM = organic matter; EE = ether extract; CF = crude fibre; NSC = non-structural carbohydrates.
1NSC = 1000 − NDF − CP − EE − ash (Van Soest et al., Reference Van Soest, Robertson and Lewis1991).
Rumen simulation
The in vitro procedure, using a semi-continuous Rusitec (Czerkawski and Breckenridge, Reference Czerkawski and Breckenridge1977) is described in more detail in a companion study (Hildebrand et al., Reference Hildebrand, Boguhn and Rodehutscord2010) and in general followed the procedures as described by Boguhn et al. (Reference Boguhn, Kluth and Rodehutscord2006a). In brief, six fermenters, with a volume of 800 ml each, were used per period. One incubation period lasted for 13 days. Randomised across seven periods, F and C treatments were tested in four and three replications per diet, respectively. The ruminal inoculum was obtained from five wether sheeps that were fed hay ad libitum and 250 g of a concentrate feed per day. Each fermenter contained two nylon bags of 100 μm pore size, which were filled with 15 g of the respective diet. Every 24 h, one bag was replaced by a new one, and therefore each bag was incubated for 48 h. The continuously infused buffer solution (546 ml/day, s.d. = 29) contained 0.7 mmol ammonium per litre from 15NH4Cl (115 μg 15N/mg N) to label the N pool and quantify the microbial protein synthesis. Liquid effluents were collected in cooled bottles (4°C).
Sampling procedure
The total amount of effluent was quantified daily from days 7 to 13, assuming that the plateau of 15N enrichment in bacteria and thus a steady state was reached within 6 days after starting the 15N infusion (Boguhn et al., Reference Boguhn, Kluth and Rodehutscord2006a). A daily subsample of 320 ml effluent was centrifuged twice for 5 min at 2000 × g and at 4°C to separate feed particles. Liquid-associated microbes in the effluent (LAM-E) were obtained by differential centrifugation as described by Boguhn et al. (Reference Boguhn, Kluth and Rodehutscord2006a). Briefly, particle-free effluents were centrifuged three times at 27 000 × g and at 4°C for 15 min. After the first centrifugation step, 40 ml of supernatant was taken for all 7 days and pooled per fermenter for storage at −20°C. Subsequent to the first and second centrifugations, the microbial pellet was re-suspended in saline solution (9 g NaCl/l). After the third centrifugation step, the pellet was conveyed into plastic tubes for storage.
Feed residues in nylon bags were taken daily from days 7 to 12, washed in 50 ml of buffer solution, squeezed moderately, dried at 65°C, weighed and pooled per fermenter. On the last day of incubation, the two bags per fermenter were evacuated to isolate solid-associated microbes (SAM) according to the method described by Carro and Miller (Reference Carro and Miller2002). The microbes were separated from the remaining fluid and further treated as described by Boguhn et al. (Reference Boguhn, Kluth and Rodehutscord2006a). In brief, the bags were squeezed moderately and incubated in a saline solution of methylcellulose (1 g methylcellulose + 9 g NaCl/l distilled water), about 30 min at 39°C and thereafter about 6 h at 4°C. After washing and removing the bags, the remaining suspension was centrifuged stepwise, as described for the LAM-E.
The entire liquid content of the fermenter vessel at the end of the incubation period, including the suspension of the washing step from feed residues was used to obtain a further microbial fraction, the LAM in the fermenter (LAM-F). The procedure of obtaining the LAM-F was equal to isolating the LAM-E fraction as described before.
Microbial isolates of fractions LAM-E, SAM and LAM-F were frozen at −20°C immediately after the last centrifugation step. After freeze-drying, all microbial pellets were ground by mortar and pestle and daily samples of the LAM-E fraction were pooled per fermenter.
Analyses
Crude nutrients, fibre fractions and starch in feed and feed residues were analysed according to the official methods in Germany (Verband Deutscher Landwirtschaftlicher Untersuchungs- und Forschungsanstalten, VDLUFA, 2006), and specifications as described in the companion study (Hildebrand et al., Reference Hildebrand, Boguhn and Rodehutscord2010). Supernatants obtained during LAM-E isolation were analysed for NH3-N (Hildebrand et al., Reference Hildebrand, Boguhn and Rodehutscord2010). Finely ground samples of 15NH4Cl, feed, feed residues, freeze-dried supernatants and microbial isolates were filled into tin capsules and delivered to an elemental analyser (EuroEA, HEKAtech GmbH, Wegberg, Germany) combined with an isotope ratio mass spectrometer (Delta V advantage, Thermo Fisher Scientific, Bremen, Germany). Concentrations of N and 15N were determined in triplicate per sample. AA were analysed in 100 mg of the freeze-dried microbial mass of SAM, LAM-F and LAM-E. Analysis followed standard procedures (method 4.11.1; VDLUFA, 2006) with laboratory details as described by Rodehutscord et al. (Reference Rodehutscord, Kapocius, Timmler and Dieckmann2004). In brief, after a performic acid oxidation step, samples were hydrolysed in 6 N HCl. Norleucine was used as an internal standard. Tryptophan, histidine and tyrosine were not determined. AA were separated and detected by an AA analyser (Biochrom 30, Biochrom Ltd, Cambridge, UK), using various citrate buffer solutions and ninhydrin. Absorbance was determined at 570 nm, with the exception of proline, which was quantified from absorbance at 440 nm. AA analysis was run in duplicate.
Calculations
The daily amount of microbial N originating from the LAM-E fraction (NLAM-E, mg/day), was calculated as:
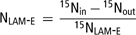
with 15Nin (μg/day) defined as the sum of daily input of 15N via buffer solution and feed. The daily output of 15N (15Nout, μg/day) was calculated by summarising the amounts of 15N in NH3-N and feed residues, including SAM. The daily input of 15N was assumed to be equal to the daily 15N output. N losses by evaporation of ammonia were assumed to be negligibly low. The difference between 15Nin and 15Nout was attributed to the LAM-E fraction and therefore related to the proportion of 15N in NLAM-E (15NLAM-E, μg/mg).
Feed residues were defined as the sum of SAM and undegraded feed. The daily amount of N originating from the SAM fraction (NSAM, mg/day) was determined as:

with the amount of N in feed residues (NFR, mg/day), the proportion of 15N in NFR (15NFR, μg/mg), the proportion of 15N in dietary N (15NDiet, μg/mg), the proportion of 15N in NSAM (15NSAM, μg/mg) and the assumed natural abundance of 15N in unlabelled NSAM (3.66 μg/mg).
For the calculation of EMPS, the daily outflow of microbial N, as the sum of NSAM and NLAM-E was related to the amount of degraded organic matter (OM). The degradation of OM was calculated as the difference between daily input and output of OM in relation to its daily input. The amount of OM in feed residues was corrected for the contribution of SAM, according to Boguhn et al. (Reference Boguhn, Kluth and Rodehutscord2006a). The efficiency of microbial N utilisation was calculated as the ratio of daily microbial N and available N, determined as the sum of degraded dietary N and N from buffer solution (Bach et al., Reference Bach, Calsamiglia and Stern2005).
The concentrations of individual AA were expressed as percentage of analysed AA. The proportion of analysed amino acid N (AA-N) in the total N of the microbial fractions was calculated by consideration of the molar proportion of N in individual AA.
Statistics
Data were analysed using the MIXED procedure of the software package SAS for windows (version 9.1.3, SAS Institute, Cary, NC, USA). Analysis of variance was performed for the fixed effects of diet and particle size and their interaction. The effect of period was factored as random into statistical analysis. Degrees of freedom were adjusted by the method of Kenward and Roger (Reference Kenward and Roger1997). In case of significant interactions (P < 0.05) between diet and particle size, the least square means of treatments F and C within a diet were compared by Student’s t-test. Measurements on chemical composition were compared between microbial fractions within each treatment by Student’s t-test.
Results
Composition of microbial fractions
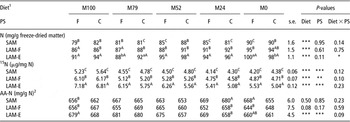
The three microbial fractions SAM, LAM-F and LAM-E differed in their content of N (P < 0.01) that averaged 84, 90 and 94 mg/g freeze-dried matter, respectively (Table 2). The LAM-E contained significantly more N than the SAM. The diet significantly affected the N concentration, which improved with increasing inclusion of grass silage in the diet. Particle size had no effect on the N concentration of the microbial fractions, but there was an interaction between diet and particle size for the LAM-E isolates. The proportion of 15N in microbial N differed between microbial fractions (P < 0.01) by mean values of 4.6, 5.2 and 5.9 μg/mg N for the SAM, LAM-F and LAM-E, respectively. The 15N ratio in total N decreased in order of LAM-E, LAM-F and SAM in all treatments. The incorporation of 15N changed with the maize silage to grass silage ratio and was highest in diet M100 and lowest in diets M24 and M0 across all microbial fractions. 15N content was also affected by particle size in all microbial fractions. For SAM, it was higher in C treatments than in F treatments. In contrast, 15N in the LAM-E fraction was higher for particle size F compared to particle size C.
N in microbial isolates, proportion of 15N and AA-N (means and pooled s.e.)

AA-N = amino acids-N; PS = particle size; F = fine; C = coarse; SAM = solid-associated microbes from feed residues; LAM-F = liquid-associated microbes from fermenter; LAM-E = liquid-associated microbes from effluent.
1Maize silage to grass silage ratio of 100 : 0 (M100), 79 : 21 (M79), 52 : 48 (M52), 24 : 76 (M24) and 0 : 100 (M0).
2On the basis of the 15 analysed AA.
a,bIn case of significant interaction between diet and PS: different superscripts indicate significant differences between particle size F and C within diets (Student’s t-test, P < 0.05).
A,B,CDifferent superscripts indicate significant differences between microbial fractions within treatments (Student’s t-test, P < 0.05).
*P < 0.05; **P < 0.01; ***P < 0.001.
The concentration of AA-N in microbial N averaged 664, 657 and 669 mg/g N for SAM, LAM-F and LAM-E fractions, respectively (Table 2). The proportion of AA-N was significantly affected by diet and particle size only in the LAM-E fraction. AA-N was highest for diet M79 (680 mg/g N) and lowest for diet M0 (660 mg/g N), as well as higher in F treatments than in C treatments. Significant differences between microbial fractions in AA-N were detected only for three of the 10 treatments.
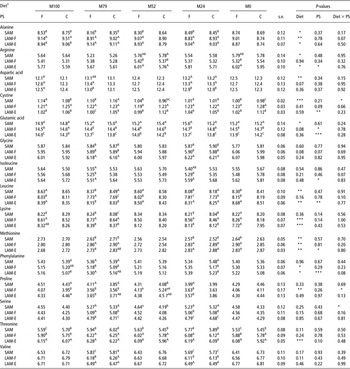
The proportion of individual AA analysed in the SAM, LAM-F and LAM-E fractions are presented in Table 3. Generally, changing the grass silage proportion changed the proportion of individual AA within the microbial mass. Maize silage to grass silage ratio affected the proportion of alanine, arginine, aspartic acid, cystine, glutamic acid, leucine and methionine in the SAM fraction; the proportion of alanine, lysine, methionine, phenylalanine and proline in the LAM-F fraction; and the proportion of alanine, arginine, leucine, lysine, methionine, phenylalanine and threonine in the LAM-E fraction significantly. Higher proportions of grass silage in the diet led to higher contents of arginine and phenylalanine, whereas those of lysine and threonine decreased within the respective microbial fractions. However, the change in AA profile in response to diet variations differed between microbial fractions. Interactions between diet and microbial fraction were observed. For example, the contents of leucine and methionine increased within the SAM fraction at higher dietary proportions of maize silage, but decreased within the LAM-E fraction. A significant effect of particle size on AA contents was detected mostly for the LAM-E fraction. Concentrations of arginine, leucine and phenylalanine increased in F treatments compared to C treatments. In contrast, the proportions of cystine, leucine and methionine were higher in particle size C than in F. Interactions of diet and particle size on the proportion of AA only occurred once for cystine, proline and serine. For all AA, a significant effect (P < 0.05) of microbial fraction on the relative AA proportion was found for some of the treatments, furthermore indicating interactions of particle size and microbial fraction (Table 3).
Proportion of AA in the fractions of solid- and liquid-associated microbes (% of analysed AA; means and pooled s.e.)

AA = amino acids; PS = particle size; F = fine; C = coarse; SAM = solid-associated microbes from feed residues; LAM-F = liquid-associated microbes from fermenter; LAM-E = liquid-associated microbes from effluent.
1Maize silage to grass silage ratio of 100 : 0 (M100), 79 : 21 (M79), 52 : 48 (M52), 24 : 76 (M24) and 0 : 100 (M0).
a,bIn case of significant interaction between diet and PS: different superscripts indicate significant differences between particle size F and C within diets (Student’s t-test, P < 0.05).
A,B,CDifferent superscripts indicate significant differences between microbial fractions within treatments (Student’s t-test, P < 0.05).
*P < 0.05; **P < 0.01; ***P < 0.001.
Microbial N and AA yield
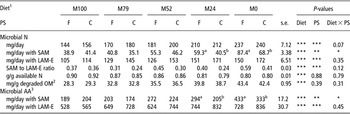
The daily output of microbial N from the SAM and LAM-E was significantly increased by the replacement of maize silage by grass silage in the diet (Table 4). An interaction of diet and particle size was detected for the SAM fraction, in which F treatments resulted in a higher amount of daily microbial N compared to C treatments in diets M24 and M0. In contrast, microbial N from LAM-E was higher for C treatments than for F treatments across all diets. Consequently, the SAM to LAM-E ratio was higher at particle size F than at particle size C on average (0.42 v. 0.31). Differences between F and C treatments became greater as the proportion of grass silage increased, but no significant interaction was detected (P = 0.12). The efficiency of microbial N utilisation (mg microbial N/mg available N) and EMPS (mg microbial N/g degraded OM) were not affected by particle size. The use of available N for microbial CP synthesis was significantly increased by the inclusion of maize silage in the diet and averaged 91% and 80% in diets M100 and M0, respectively. In contrast, EMPS significantly improved by the rising proportion of grass silage and increased by about 14 mg/g from diets M100 to M0.
Outflow of microbial N and microbial AA from the Rusitec (means and pooled s.e.)

AA = amino acids; Rusitec = rumen simulation technique; PS = particle size; F = fine; C = coarse; SAM = solid-associated microbes from feed residues; LAM-E = liquid-associated microbes from effluent; OM = organic matter.
1Maize silage to grass silage ratio of 100 : 0 (M100), 79 : 21 (M79), 52 : 48 (M52), 24 : 76 (M24) and 0 : 100 (M0).
2Values for degraded OM were taken from Hildebrand et al. (Reference Hildebrand, Boguhn and Rodehutscord2010).
3Sum of the 15 analysed AA.
a,bIn case of significant interaction between diet and PS: different superscripts indicate significant differences between particle size F and C within diets (Student’s t-test, P < 0.05).
*P < 0.05; **P < 0.01; ***P < 0.001.
The daily outflow of all individual AA and total AA as a sum of the SAM and LAM-E fraction was significantly affected by diet and particle size, and no interaction between these two dietary factors was detected (data not shown). The daily amount of all AA increased with ascending proportion of grass silage in the diet. Similar to microbial N the daily microbial AA yield from the SAM fraction was characterised by an interaction of diet and particle size, whereas the amount of total AA originating from the LAM-E fraction was improved by an increasing inclusion rate of grass silage and coarse milling compared to fine milling (Table 4).
Discussion
Amount and efficiency of microbial CP synthesis
It was hypothesised that an optimal ratio of available energy and N by changing the maize silage to grass silage ratio in a diet maximises the microbial CP synthesis. These results show that daily microbial N as well as EMPS increased with the stepwise replacement of maize silage by grass silage in the diet. These results are in contrast to in vivo studies, which showed that the inclusion of maize silage in the diet promotes the postruminal supply of microbial protein, compared to grass silage-based diets (Givens and Rulquin, Reference Givens and Rulquin2004). Effects observed under in vitro conditions can be masked or other limiting factors might occur in vivo. Constant daily feeding and feed retention time as well as limited fluctuations in pH value in the Rusitec system compared to the intact rumen might impair the direct comparison of these results with in vivo findings. As shown by Hildebrand et al. (Reference Hildebrand, Boguhn and Rodehutscord2010), the degradation of OM increased slightly when replacing maize silage by grass silage, and a high correlation between degraded OM and the microbial CP synthesis was reported for the Rusitec system by Boguhn et al. (Reference Boguhn, Kluth and Rodehutscord2006a). However, a wide range in EMPS was documented (29 to 43 mg microbial N/g degraded OM). Large differences in EMPS are also known from other in vitro studies dealing with changes in the amount and type of carbohydrates and N (Stokes et al., Reference Stokes, Hoover, Miller and Manski1991; Bach et al., Reference Bach, Yoon, Stern, Jung and Chester-Jones1999; Boguhn et al., Reference Boguhn, Kluth and Rodehutscord2006a).
Similar amounts of total short-chain fatty acids indicated that the amount of fermented carbohydrates was similar between diets of different maize silage to grass silage ratio (Hildebrand et al., Reference Hildebrand, Boguhn and Rodehutscord2010). The amount of ATP derived from fermentation of carbohydrates is assumed to be similar between structural and non-structural polysaccharides (Russell and Strobel, Reference Russell and Strobel2005; Tamminga et al., Reference Tamminga, Brandsma, Dijkstra, van Duinkerken, van Vuuren and Blok2007). However, the use of energy could have been limited by the availability of other nutrients. Diets in this study were characterised by an increase in available N with a rising proportion of grass silage in the diet. As the ratio of dietary NSC to degradable CP decreased, the EMPS increased in continuous culture (Stokes et al., Reference Stokes, Hoover, Miller and Manski1991). This observation is in accordance with these results, in which the ratio of NSC to degraded CP decreased from 6.4 to 1.6 from diets M100 to M0. These findings emphasise the importance of adequate amounts of available N when availability of energy is not limited (Bach et al., Reference Bach, Calsamiglia and Stern2005). Furthermore, an increase in NH3-N concentration in the liquid phase is generally associated with a decrease in efficiency of N utilisation (g microbial N/g available N) in continuous culture systems (Bach et al., Reference Bach, Calsamiglia and Stern2005). The current results are similar to the findings of Bach et al. (Reference Bach, Yoon, Stern, Jung and Chester-Jones1999). They found that the efficiency of N utilisation was increased by supplementation of cracked maize to lush pasture compared to pure lush pasture, whereas EMPS was lower with maize addition.
The findings of Satter and Slyter (Reference Satter and Slyter1974) suggested an available CP equivalent of 120 g/kg diet for maximal microbial growth in the liquid phase in vitro. In this study, available CP equivalent (degraded CP + N from buffer solution) was 74, 91, 100, 119 and 134 g/kg for diets M100, M79, M52, M24 and M0, respectively. Therefore, a deficit in available N is possible for the diets with high proportions of maize silage. Moreover, the N source might have played a major role in this study. Microbial growth can be enhanced by addition of AA and peptides, especially under in vitro conditions (Carro and Miller, Reference Carro and Miller1999; Demeyer and Fievez, Reference Demeyer and Fievez2004; Bach et al., Reference Bach, Calsamiglia and Stern2005). The supply of AA originating from silages more than doubled from diets M100 to M0 (0.77 v. 1.82 g AA/day). However, it is difficult to estimate the available AA and the direct use for the microbial protein synthesis, so that a discussion of this aspect can only be hypothetical.
It has been demonstrated in this study that daily microbial N was higher in C treatments compared to F treatments. The degradation of OM and CP, as well as the daily amounts of NH3-N and short-chain fatty acids in the effluent were higher in coarse-milled than in fine-milled treatments (Hildebrand et al., Reference Hildebrand, Boguhn and Rodehutscord2010). An improved microbial protein synthesis in response to increased availability of energy and N is probable. But, in contrast to the continuous culture experiment of Rodríguez-Prado et al. (Reference Rodríguez-Prado, Calsamiglia and Ferret2004), in this study there was no significant effect of feed particle size on EMPS.
Composition of microbial fractions
A wide range in chemical composition of ruminal bacteria has been reported in the literature, but techniques and location of bacterial isolations have differed among experiments (Clark et al., Reference Clark, Klusmeyer and Cameron1992; Martin et al., Reference Martin, Bernard and Michalet-Doreau1996; Yang et al., Reference Yang, Beauchemin and Rode2001). Therefore, microbial mass was isolated from three compartments of the Rusitec system in this study to investigate effects of dietary forage composition and particle size. The contents of N and 15N in the LAM-F fraction were intermediate between those of the two other fractions across all diets, indicating that this fraction represents a mixture of SAM and LAM-E. However, the proportions of AA were not intermediate at all. The higher proportion of 15N in the LAM-E compared to the SAM is in accordance with most studies using 15N as microbial marker (Rodríguez et al., Reference Rodríguez, González, Alvir, Repetto, Centeno and Lamrani2000; Yang et al., Reference Yang, Beauchemin and Rode2001; Carro and Miller, Reference Carro and Miller2002) and indicated differences in the N source used (Atasoglu et al., Reference Atasoglu, Valdes, Newbold and Wallace1999).
Dietary influences on the N content of ruminal bacteria are rarely identified (Hvelplund, Reference Hvelplund1986; Philipczyk et al., Reference Philipczyk, Südekum, Ahrens and Stangassinger1996; Yang et al., Reference Yang, Beauchemin and Rode2001). As pointed out by Bach et al. (Reference Bach, Calsamiglia and Stern2005), bacterial chemical composition is affected by the availability of energy and N as well as by the availability of AA (Wang et al., Reference Wang, Wang, Cao, Li and Zhang2008). High proportions of concentrate in the diet (Ranilla and Carro, Reference Ranilla and Carro2003) and supplementation of maize starch to grass pasture (Bach et al., Reference Bach, Yoon, Stern, Jung and Chester-Jones1999) were reported to reduce the N content in the microbial mass. In this study, N contents of microbial fractions were lowest in maize silage- and highest in grass silage-based diets. Changes in the availability of nutrients, as described between treatments F and C (Hildebrand et al., Reference Hildebrand, Boguhn and Rodehutscord2010), did not affect N contents of the microbial fractions. However, in contrast to LAM-E, 15N enrichment in the SAM fraction was higher in C treatments than in F treatments. It is supposable that SAM in C treatments had easier access to the 15N pool of the liquid phase because of lower bulk density, and consequently, a better flushing of feedbags compared to F treatments. Differences in the effect of feed particle size on microbial N metabolism between SAM and LAM were also reported by Rodríguez-Prado et al. (Reference Rodríguez-Prado, Calsamiglia and Ferret2004). In accordance with Molina-Alcaide et al. (Reference Molina-Alcaide, Moumen, Martín-García and Carro2009) interactions between microbial fraction and diet on AA profile could be detected in this study. This fact underlines the hypothesis that the origin of microbial sample might affect the results of continuous culture studies when particle size or diet varies. Diet composition has been reported to have only small effects on microbial AA profile (Martin et al., Reference Martin, Bernard and Michalet-Doreau1996; Volden and Harstad, Reference Volden and Harstad1998; Yang et al., Reference Yang, Beauchemin and Rode2001). Although the proportion of several AA was significantly affected by the maize silage to grass silage ratio in this study, the nominal differences in individual AA were not of biological importance and in the range of AA profiles reported in vivo (Clark et al., Reference Clark, Klusmeyer and Cameron1992). In accordance with Rodríguez-Prado et al. (Reference Rodríguez-Prado, Calsamiglia and Ferret2004), the effect of particle size on microbial AA profile was low. However, similar AA profiles do not prove the fact that the microbial community was similar across treatments. A companion study using different molecular techniques showed that the community structure of the bacterial group of Bacteroides–Prevotella was significantly influenced by both maize silage to grass silage ratio and feed particle size (Witzig et al., Reference Witzig, Boguhn, Kleinsteuber, Fetzer and Rodehutscord2010). The relative abundance of Prevotella bryantii increased with increasing proportion of grass silage in the diet and the authors attributed this to the changes in dietary CP.
Dietary factors influencing SAM to LAM-E ratio might be the forage to concentrate ratio (Ranilla and Carro, Reference Ranilla and Carro2003; Gómez et al., Reference Gómez, Tejido and Carro2005, Vlaeminck et al., Reference Vlaeminck, Fievez, Demeyer and Dewhurst2006) and the availability of N (Carro and Miller, Reference Carro and Miller1999; Kajikawa et al., Reference Kajikawa, Tajima, Mitsumori and Takenaka2007). As the SAM may have greater requirements for NH3-N than the LAM fraction (Carro and Miller, Reference Carro and Miller1999), higher amounts of NH3-N in the course of grass silage inclusion might have promoted the synthesis of SAM and led to an increase in the SAM to LAM-E ratio. Furthermore, the higher SAM to LAM-E ratio in F treatments compared to C treatments indicates a higher microbial colonisation of small particles than large particles (Yang et al., Reference Yang, Beauchemin and Rode2001). However, it cannot be guaranteed that the detached SAM fraction was representative for all particle associated microbes (Martín-Orúe et al., Reference Martín-Orúe, Balcells, Zakraoui and Castrillo1998; Ranilla and Carro, Reference Ranilla and Carro2003). An underestimation of the SAM fraction is likely, because the firmly adherent, not detached microbes may be lower in 15N enrichment than the loosely attached microbes. The contribution of SAM to total microbial N was, on average, 27% and lower than commonly reported in vivo (Craig et al., Reference Craig, Broderick and Ricker1987; Vlaeminck et al., Reference Vlaeminck, Fievez, Demeyer and Dewhurst2006). However, the ratio of solid to liquid phase was lower in the used rumen simulation than in an intact rumen and therefore the proportion of SAM in total microbial CP might have been lower. In accordance, the mass of LAM was reported to be higher than the mass of SAM in other in vitro studies (Carro and Miller, Reference Carro and Miller1999; Gómez et al., Reference Gómez, Tejido and Carro2005; Kajikawa et al., Reference Kajikawa, Tajima, Mitsumori and Takenaka2007).
Conclusions
This study showed that the amount of available nutrients to favour microbial CP synthesis and EMPS is most optimised when grass silage is used instead of maize silage. Grinding forage-based diets through a sieve with a pore size of 4 mm leads to an increase in daily microbial N, but not in EMPS compared to using a 1-mm milling sieve. Diet and feed particle size affect the AA profile of microbial fractions, and interactions of both factors might occur. Nevertheless, biological significance of the changed AA profile is negligible. In addition, interactions between dietary factors and microbial fractions are assumed. Differences in the amount and composition of microbial protein might indicate that specific microbial communities are promoted.
Acknowledgement
This study was funded by Deutsche Forschungsgemeinschaft (Grant no. BO 2960/1-1). The authors thank their co-workers of the Animal Nutrition group at Martin-Luther-Universität Halle-Wittenberg for their analytical support. Further thanks go to Dr R. Christopherson from the University of Alberta for proofreading the manuscript.