


Graduate study for a PhD in political science involves a long and difficult path. Earning the degree rarely takes fewer than five years. The opportunity costs of graduate study are high, as students forgo income, leisure, home purchases, and retirement savings in exchange for late nights of dense texts, problem sets, and data wrangling.
For most students, the primary motivation for choosing this difficult path is the chance of a permanent position as a professor (Nerad and Cerny Reference Nerad and Cerny2003). However, most graduate students will not become professors. Many will not complete the PhD.Footnote 1 Those who finish will face an extremely competitive job market, with far more recent PhDs than faculty openings (McGrath and Diaz Reference McGrath and Diaz2022). Furthermore, the academic labor market is expected to tighten due to projected declines in undergraduate enrollment (Barshay Reference Barshay2018; Grawe Reference Grawe2018). In this difficult environment, what should graduate students do to maximize their chances of finding a position?
Unfortunately, a substantial literature suggests that outcomes are primarily determined simply by where the PhD is earned. Scholars studying academic labor markets find a consistent pattern: the prestige or rank of a department is a strong predictor of outcomes. Across disciplines, a small number of PhD programs are responsible for a disproportionately large number of faculty placements. For example, in history, business, and computer science, fully half of all faculty members across hundreds of universities came from just eight, 16, and 18 PhD programs, respectively. Wapman et al. (Reference Wapman, Zhang, Clauset and Larremore2022) examined almost 300,000 faculty members across 100+ disciplines and found that a small group of elite universities dominates placements, a pattern they called “universal inequality.” This skewed distribution of placements has been attributed to prestige, resources, and other advantages that some programs may offer their students (Burris Reference Burris2004; Clauset, Arbesman, and Larremore Reference Clauset, Arbesman and Larremore2015; Wapman et al. Reference Wapman, Zhang, Clauset and Larremore2022). To varying degrees, the literature concludes that there is an “enormous role of institutional prestige in shaping faculty hiring across academe, both for institutions and for individuals (Clauset, Arbesman, and Larremore Reference Clauset, Arbesman and Larremore2015, 4).” In sociology, Burris (Reference Burris2004) went so far as to call this a “caste system.”
Investigations focusing on political science largely echo these findings. Frese (Reference Frese2023) examined the backgrounds of faculty at US and European universities and found a highly skewed distribution of placements dominated by Harvard University, with more than 100 PhDs currently serving as faculty members. Oprisko (Reference Oprisko2013) examined US faculty placements and found a similar skew: the top 11 universities accounted for more than 50% of faculty members. A key conclusion: “Prestige of one’s PhD alma mater (using U.S. News rank as a proxy) is an important factor in placement” (Oprisko Reference Oprisko2013). The only partial exception is Warner and Stecula (Reference Warner and Stecula2024), who examined the relationship between graduate-student stipends and placement outcomes reported on departmental websites. They analyzed placement rates for 62 departments while controlling for both graduate-program size and U.S. News & World Report (USN&WR) rankings. After accounting for department size, they did not find a statistically significant relationship between departmental rank and placements.
Most recently, Jepson and Hatemi (Reference Jepson and Hatemi2025) (henceforth JH) also examined placements at PhD-granting institutions. Their findings mirror the extant literature: placements were dominated by a small number of schools, most professors were placed at institutions ranked lower than their PhD-granting institution, and upward mobility was limited. From this analysis, they made several strong claims, including that (1) where you earn your PhD “matters”; and (2) half of PhD programs could close and “most probably would not know it” (Jepson and Hatemi Reference Jepson and Hatemi2025, 11). They also called for increased transparency regarding placements by PhD programs.
Unfortunately, these consistent findings have at least two methodological problems that may introduce bias. Both stem from the narrow sample frame used for analysis: current faculty members at PhD-granting institutions.
The first problem is that by focusing only on current faculty members, the literature may confound the size of a graduate program with its ability to place students. Even if all candidates had an equal chance on the job market, a large program would be expected to have many more placements than a small program (it should also have many more non-placements). Imagine being a prospective graduate student choosing between two PhD-granting departments: Department A and Department B. Department A always has an incoming cohort of 20 students, and two of them find academic jobs. Department B always has an incoming cohort of one student and that student always finds a job. If given a choice, which institution would a student rather attend? The outcome approach would favor Department A because it has two placements versus one from Department B. However, the placement rate for Department A is 10% whereas it is 100% for Department B.
Second, this approach ignores tenure-track positions at more than 95% of colleges and universities. There are roughly 120 PhD-granting political science programs in the United States. In contrast, there are more than 6,000 postsecondary institutions, about 4,000 of which are degree-granting programs. The US Bureau of Labor Statistics (2024) reported that more than 17,000 individuals are employed as political science faculty at postsecondary degree-granting institutions. There are approximately 3,000 political science faculty members employed at the 120 departments awarding PhDs in political science. Thus, the standard approach of examining faculty members at PhD-granting institutions ignores more than 80% of academic placements. These overlooked professorships include positions at Dartmouth College, Whitman College, and California Polytechnic State University, San Luis Obispo.
This approach is analogous to studying fitness, limiting the analysis to Olympic medalists, observing that the US delegation won the most medals, and concluding that the best strategy to improve fitness is to obtain US citizenship. An alternative explanation, however, is that the United States won the most medals because it sent the most athletes to compete.Footnote 2 A better approach to studying fitness would be to analyze how individuals train and the fitness outcomes they achieve—and not only in the Olympics. Similarly, when assessing a department’s placement performance, the size of the PhD program, the efforts and training of students, and placements at non-PhD-granting institutions should be considered.
Scholars who conduct these types of analyses are aware of these problems, but focus on PhD-granting institutions because these positions are understood to be preferred employment outcomes and because data collection is manageable. The first assumption, however, needs qualification, and the second may be addressed with some effort. Regarding the first assumption, many graduate students may prefer positions at non-PhD-granting institution. In their survey of PhD students, Golde and Dore (Reference Golde and Dore2001) found slightly more interest in liberal arts careers than in research-university careers.Footnote 3 Students who would prefer a job in a PhD-granting department nevertheless may be satisfied teaching at a small liberal arts college or community college, and they might strongly prefer such a career to a nonacademic profession.
Thus, to understand the factors that affect outcomes in the academic job market, we should examine the candidate pool and identify factors that distinguish between candidates who found positions and candidates who did not. We should also look beyond placement at PhD-granting institutions and also consider placements at non-PhD-granting colleges and universities.
I address these problems by examining a broad sample of the candidate pool and outcomes beyond placements at PhD-granting institutions, including professorships at non-PhD-granting universities and colleges, postdoctoral positions, and visiting lectureships. This analysis provides a broader perspective on how doctoral institution rank relates not only to whether candidates obtain tenure-track jobs but also to the types of positions they secure. I further evaluate how other candidate characteristics—including publications, field specialization, teaching experience, and identity—are associated with job-market outcomes.
DATA
To provide a more complete view of the academic job market in political science, I analyzed data on candidates and outcomes from the 2023–2024 job-market cycle. Starting in Fall 2023, with the help of research assistants (RAs), I collected data on the pool of job-market candidates in political science. A year later, we attempted to observe their employment outcomes. The resulting data addresses the biases in the literature and provides a different perspective on how to succeed in the academic job market.
The job-market candidate data were collected from departmental websites as of Fall 2023. Most PhD programs have a “Job Market Candidate” webpage listing their graduate students who are seeking academic employment. To varying degrees, these webpages include candidate statements and dissertation descriptions as well as curriculum vitae (CVs). When they were available, copies of candidate websites and CVs were saved.
Beginning in Fall 2024, we measured outcomes from these candidates’ job-market efforts. RAs attempted to track down all job candidates and observe their employment status. Outcomes were measured by examining updated CVs, websites, LinkedIn profiles, and other resources. From these efforts, a series of key variables were recorded, including the following:
-
1. Departmental Rank: Two measures were used: the 2022 USN&WR Best Political Science Graduate Programs ranking and a ranking of institutions according to the number of placements in JH, the most recent such analysis.
-
2. Fields: RAs coded the candidates’ specialization based on their websites and CVs. Specializations included American politics, comparative politics, international relations (IR), methods, political theory, and other. Some candidates were coded into more than one field.
-
3. Publications: RAs recorded the number of solo-authored and coauthored journal articles as well as the highest journal impact score for solo-authored and coauthored publications.
-
4. Degree Completion: Whether a candidate had completed the PhD by Fall 2023.
-
5. Number of Conference Appearances: This variable was highly skewed; therefore, in multivariate analysis, log(number of conferences + 1) was used.
-
6. Teaching Experience: The number of unique courses taught by a candidate since beginning graduate school, as a teaching assistant (TA) or as a lead instructor.
-
7. Awards: The number of teaching awards and external awards received by each candidate.
-
8. Outcomes: Whether a candidate held any of the following positions by Fall 2024: a tenure-track assistant professorship, postdoctoral position, temporary teaching position, or nonacademic employment. If a candidate secured more than one position, all were recorded. Individuals with none of these outcomes often remained at their degree-granting institution.
-
9. Perceived Underrepresented Minority (URM) and Female Identity: RAs coded candidate gender and race identifiers based on a number of factors, including name scores from Namsor.com, pronouns, identity-specific awards, personal statements of identity, and appearance. For URM, individuals with Native American, Black, and Latinx identifiers were coded as URM=1; others were coded as “0.” For female, individuals with female identifiers were coded “1” and non-female candidates were coded as “0.” Although they are imperfect, these measures based on perceived gender and race may be more relevant for studying employer discrimination than candidates’ self-identification.
The many measurement and inferential problems associated with these data should be well known to readers, but I briefly highlight some issues and encourage caution when interpreting the results.
One issue concerned which candidates should be included in the analysis. Departments varied in which candidates they included on their websites. Some listed only recent graduates. Other departments included candidates who had earned their degree as many as 10 years previously (2013), some of whom already held professorships.Footnote 4 Because of differences in candidate profiles across cohorts, I exclude candidates who already held tenure-track positions as well as candidates who received their PhD’s in 2022 or earlier. Of the total 514 profiles listed on candidates’ websites, 101 were eliminated by these restrictions, leaving a sample of 413 observations. Results did not change materially when these 101 candidates were included (Desposato Reference Desposato2026).
However, it is likely that my approach failed to identify all candidates who should have been included. It excluded candidates from departments without a job-market website and those who were not listed on their department’s website. In addition, I could not observe how broadly candidates applied and whether they were offered, but declined, a position. I did not observe the many junior faculty members who also might apply for these positions, and I did not observe candidates from institutions outside of the United States. It is also likely that some employment outcomes were not observed, especially if a candidate took a position at a non-US university.
None of the results presented herein are causally identified. For example, consider departmental rank. It may be that rank has a direct impact on placements if hiring committees prefer students from top-ranked departments or if top departments do a better job of training students and preparing them for the job market. Alternatively, rank might not have any causal effect. It may be that the highest-ranked departments simply recruit the strongest students to their graduate programs. Those students may be equally well-placed coming from any PhD program. Additional details on measurement and other aspects of the data collection are in the online appendix.
RESULTS
This section first examines the relationship between departmental rank and various job-market outcomes. It then examines other factors thought to affect placement into professorships. Finally, I present logistic and multinomial logistic regressions to test how these factors are related to job-market outcomes for candidates.
Table 1 shows the distribution of job-market candidates from Fall 2023, by university and sorted by USN&WR ranking. Almost all of the top 60 schools had websites listing job-market candidates, with a total of 371 candidates who were “all but dissertation” (ABDs) or 2023 PhDs and who did not yet have a tenure-track position. Such websites were much less common for the bottom half of the departments. Of the lower 60 institutions, only 13 had candidate websites and most of them had few job-market candidates.
Job Candidates by Institution

Table 1 Long description
The table displays the number of job candidates (N) from various institutions, ordered by their U S N and W R ranking.
Left Block (Rankings 1 to 34):
* 1. Stanford University: 10
* 2. Harvard University: 23
* 2. Princeton University: 10
* 4. U C Berkeley: 9
* 4. University of Michigan: 15
* 6. Yale University: 12
* 7. Mass. Institute of Technology: 6
* 8. U C San Diego: 9
* 10. Duke University: 7
* 10. University of Chicago: 7
* 12. U C Los Angeles: 9
* 12. U North Carolina-Chapel Hill: 4
* 12. Washington University: 5
* 15. Cornell University: 14
* 15. New York University: 15
* 17. The Ohio State University: 4
* 17. Univ. of Wisconsin-Madison: 10
* 18. Vanderbilt University: 5
* 19. Emory University: 5
* 19. Northwestern University: 11
* 19. Penn State: 11
* 19. Rochester University: 6
* 19. University of Texas at Austin: 16
* 25. U C Davis: 8
* 25. University of Minnesota: 4
* 27. University of Illinois: 4
* 28. Rice University: 2
* 28. Texas A and M: 10
* 28. University of Maryland: 8
* 28. University of Indiana: 3
* 28. University of Virginia: 1
* 34. Georgetown: 4
* 34. Penn State: 7
Right Block (Rankings 34 to 99):
* 34. University of Washington: 7
* 37. George Washington: 4
* 37. Michigan State: 5
* 37. Notre Dame: 7
* 37. University of Pittsburgh: 7
* 41. Brown University: 8
* 41. Florida State University: 4
* 41. Johns Hopkins University: 9
* 41. University of Georgia: 2
* 46. University of Colorado Boulder: 2
* 46. University of Iowa: 8
* 48. Rutgers University: 2
* 48. U C Riverside: 3
* 50. University of Houston: 3
* 54. Arizona State: 5
* 56. Amherst College: 1
* 56. U C Santa Barbara: 4
* 59. Binghamton University-S U N Y: 3
* 59. Boston University: 7
* 59. University of Nebraska: 2
* 59. University of North Texas: 4
* 63. Purdue University: 5
* 63. University of South Carolina: 1
* 68. Boston College: 2
* 68. Temple University: 3
* 68. University of Kansas: 3
* 68. University of Missouri: 16
* 68. University of Wisconsin-Milwaukee: 2
* 76. University of Oregon: 4
* 81. The New School: 2
* 89. Texas Tech University: 1
* 98. University of Alabama: 2
* 99. West Virginia University: 1
Notes: Number of job candidates listed on institutions’ websites. Institutions are ordered by the USN&WR ranking of graduate programs in political science. Only candidates who completed their degree in 2023 or were an ABD are included.
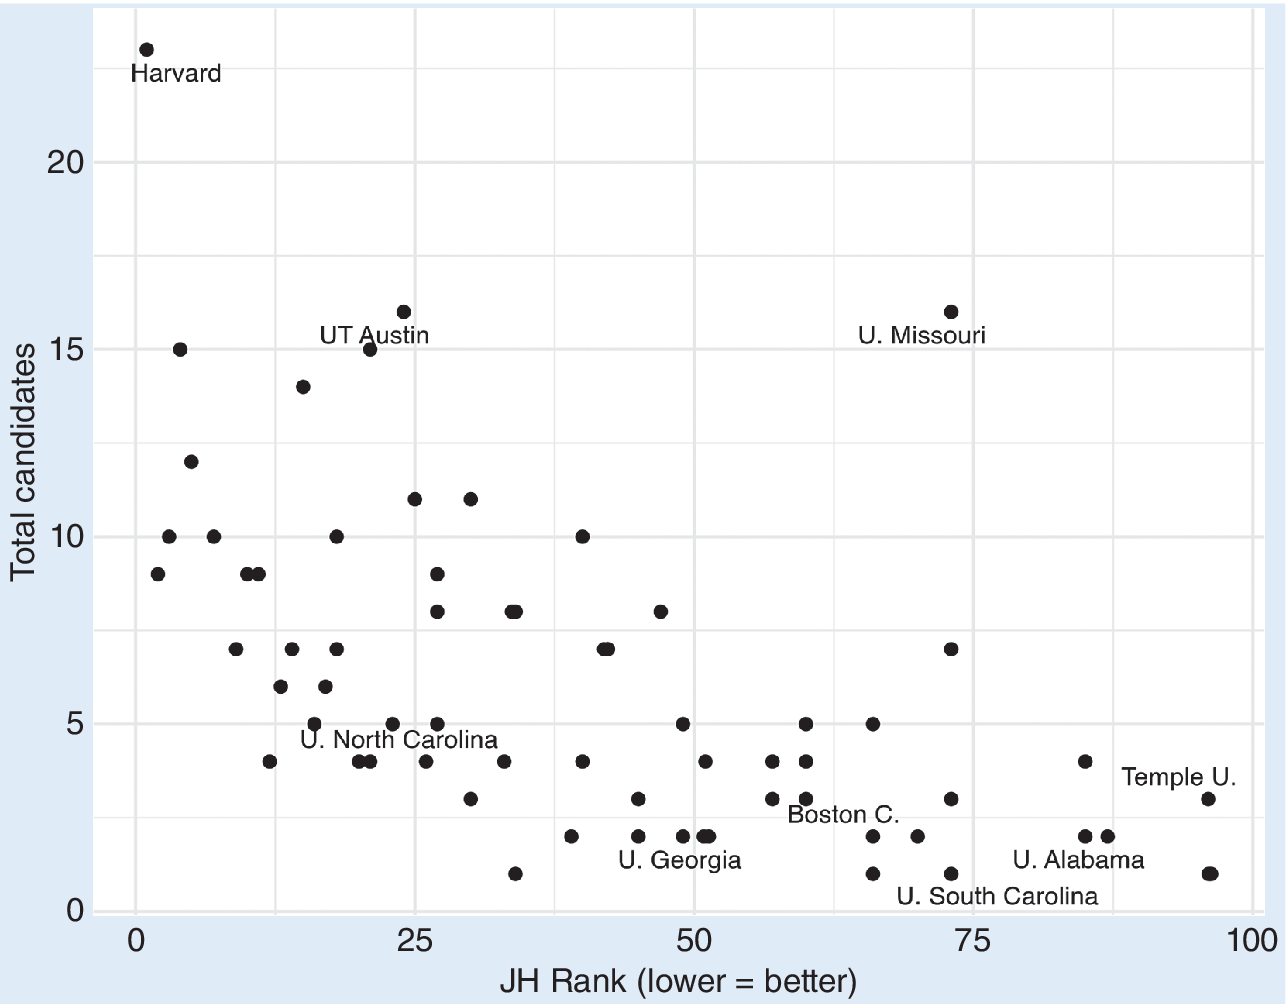
Figure 1 shows the number of job-market candidates by the schools’ JH rankings. There is a clear negative relationship: larger rank values (lower ranks) are associated with smaller job-market cohorts. Thus, one reason that some universities are overrepresented among faculty may simply be that they have large PhD programs. Indeed, the school with the largest number of candidates in Fall 2023 was JH’s top-ranked school, Harvard University, with 23 students on the job market. The next-largest cohorts were at the University of Texas at Austin and the University of Missouri, each with 16 candidates.Footnote 5 Moving down the ranks, most departments had fewer than 10 candidates. For the top 10 departments, the average number of candidates per institution was 11.9. For the schools with JH rank values of 71 or higher for which I had data, the average number of candidates was 4.0—and would have been lower (2.7) except for the University of Missouri’s 16 candidates.
Jepson–Hatemi Rank and Number of Candidates
The figure shows the relationship between the number of candidates listed on job-market websites and the Jepson–Hatemi rank of the PhD-granting institution. Overlapping points are jittered slightly.

Figure 1 Long description
The x-axis is labeled J H Rank (lower = better) with a scale from 0 to 100. The y-axis is labeled Total candidates with a scale from 0 to over 20.
* The data shows a general downward trend where institutions with a lower J H Rank (better rank) tend to have a higher number of candidates.
* Harvard is the highest outlier at the top-left, with a rank near 0 and over 20 candidates.
* U T Austin is located near rank 20 with 15 candidates.
* U. Missouri is a significant outlier in the upper-right quadrant, with a rank near 75 and 16 candidates.
* U. North Carolina is positioned near rank 15 with 5 candidates.
* A dense cluster of points exists between rank 25 and 75, mostly falling below 10 candidates.
* Specific labels in the lower-right quadrant include U. Georgia, Boston C., U. South Carolina, U. Alabama, and Temple U., all of which have ranks between 50 and 100 and fewer than 5 candidates.
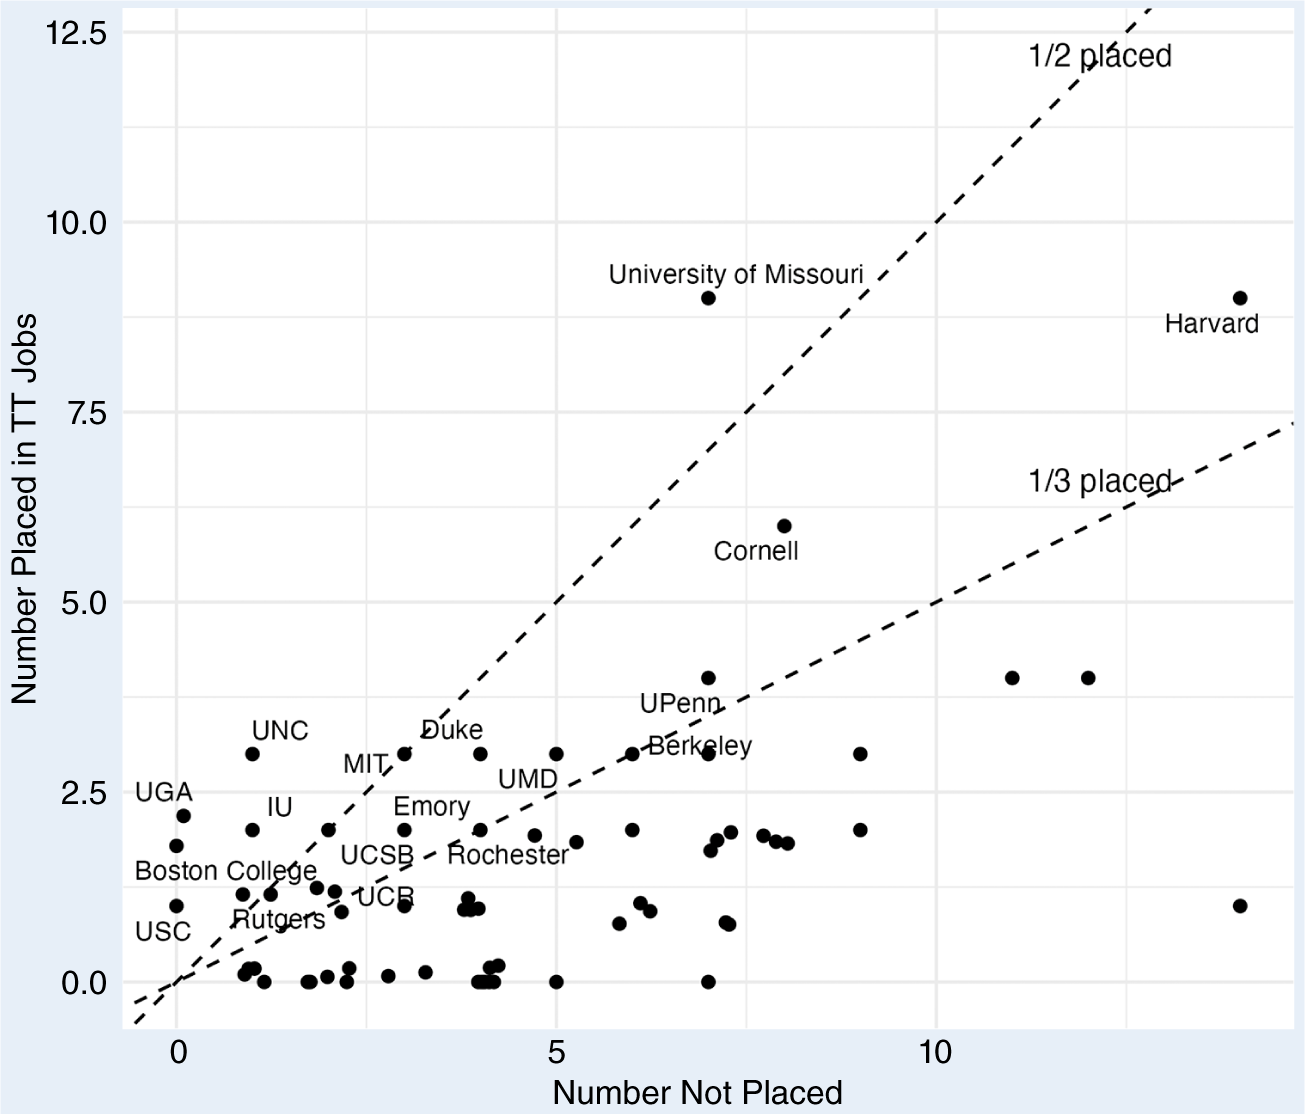
Figure 2 plots the number of placements against the number of non-placements by department and demonstrates the problem when using placement outcomes as a metric of institutional performance.Footnote 6 Harvard University had an impressive number of placements, with nine new assistant professors. However, it also was tied for the most non-placements of any department in 2023–2024, with 14 candidates not holding professorships by Fall 2024. Larger programs naturally have more placements, but they also often have more non-placements.
Placements and Non-Placements into Tenure-Track Positions by Institution
The figure shows the number of candidates not placed (x-axis) and placed (y-axis) into tenure-track positions after the 2023–2024 job-market cycle. The 45-degree line corresponds to institutions that placed half of their candidates. The lower line corresponds to institutions that placed one third of their candidates. Points that otherwise would overlap have been jittered slightly.

Figure 2 Long description
The x-axis represents the Number Not Placed, ranging from 0 to 15 plus. The y-axis represents the Number Placed in T T Jobs, ranging from 0 to 15. Two dashed reference lines originate from the bottom-left. The steeper line is labeled 1 forward slash 2 placed, indicating a 50 percent placement rate. The shallower line is labeled 1 forward slash 3 placed, indicating a 33 percent placement rate.
Data points are concentrated in the bottom-left quadrant between 0 and 5 on both axes. Notable outliers and labeled institutions include.
* Above the 1 forward slash 2 line. University of Missouri is at approximately 7 not placed and 9 placed. I U is at 5 not placed and 7 placed. Duke and M I T are clustered near 4 not placed and 4 placed.
* Between the two lines. Cornell is at 13 not placed and 9 placed. Yale is at 10 not placed and 5 placed. Stanford is at 7 not placed and 4 placed.
* Below the 1 forward slash 3 line. Harvard is the furthest right at 18 not placed and 10 placed. Other institutions clustered in the low-placement high-non-placement zone include Berkeley, U M D, Rochester, Emory, and Binghamton University dash dash S U N Y.
* Near the origin. Columbia, U G A, U N C, U C I, Boston College, U C R, U S C, T T U, and Rutgers are densely packed with fewer than 5 candidates in either category.
In figure 2, the 45-degree line corresponds to institutions placing half of their candidates. The lower line corresponds to institutions placing one third of their candidates. Only a few institutions were above the one-third line, and fewer still were above the one-half line. One standout institution was the University of Missouri: 16 candidates were listed on its website in Fall 2023; nine had tenure-track positions by Fall 2024. The three schools on the y-axis (with x=0) were departments that placed all their candidates.Footnote 7
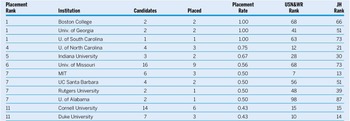
Table 2 ranks the top 12 departments according to their placement rates for ABDs and recent graduates in the 2023–2024 job-market cycle. The table includes the corresponding USN&WR and JH rankings. Only three of the “usual suspects” were in the top 12 in terms of placement rates: Massachusetts Institute of Technology, Duke University, and Cornell University. In fact, the correlations between placement rates and the USN&WR and JH rankings were close to zero, at -0.061 and -0.059, respectively.Footnote 8 These results were based on a single year of data, and schools with fewer candidates are expected to have higher variance in their placement rates; however, the lack of relationship between the placement rate and conventional rankings was striking.
Top 12 Institutions According to 2023–2024 Placement Rate

Table 2 Long description
The table consists of seven columns: Placement Rank, Institution, Candidates, Placed, Placement Rate, U S N and W R Rank, and J H Rank.
* Rank 1: Boston College; 2 candidates; 2 placed; 1.00 rate; U S N and W R 68; J H 66.
* Rank 1: Univ. of Georgia; 2 candidates; 2 placed; 1.00 rate; U S N and W R 41; J H 51.
* Rank 1: U. of South Carolina; 1 candidate; 1 placed; 1.00 rate; U S N and W R 63; J H 73.
* Rank 4: U. of North Carolina; 4 candidates; 3 placed; 0.75 rate; U S N and W R 12; J H 21.
* Rank 5: Indiana University; 3 candidates; 2 placed; 0.67 rate; U S N and W R 28; J H 30.
* Rank 6: Univ. of Missouri; 16 candidates; 9 placed; 0.56 rate; U S N and W R 68; J H 73.
* Rank 7: M I T; 6 candidates; 3 placed; 0.50 rate; U S N and W R 7; J H 13.
* Rank 7: U C Santa Barbara; 4 candidates; 2 placed; 0.50 rate; U S N and W R 56; J H 51.
* Rank 7: Rutgers University; 2 candidates; 1 placed; 0.50 rate; U S N and W R 48; J H 39.
* Rank 7: U. of Alabama; 2 candidates; 1 placed; 0.50 rate; U S N and W R 98; J H 87.
* Rank 11: Cornell University; 14 candidates; 6 placed; 0.43 rate; U S N and W R 15; J H 15.
* Rank 11: Duke University; 7 candidates; 3 placed; 0.43 rate; U S N and W R 10; J H 14.
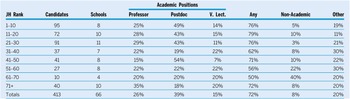
Table 3 further examines job-market outcomes for all departments by their JH rank. Overall, 26% of candidates accepted tenure-track assistant professorships (or equivalents) by Fall 2024. Furthermore, more than 70% of candidates held some type of academic job by Fall 2024—that is, a professorship, postdoctoral position, or visiting-professor position.
2023 Job-Market Outcomes by JH Rank

Table 3 Long description
The table contains 9 rows of data including a totals row. The columns are J H Rank, Candidates, Schools, Academic Positions (subdivided into Professor, Postdoc, and V dot Lect dot), Any academic position, Non-Academic, and Other.
* Rank 1 to 10: 95 candidates, 8 schools. Outcomes: 25% Professor, 49% Postdoc, 14% V dot Lect dot, 76% Any, 5% Non-Academic, 19% Other.
* Rank 11 to 20: 72 candidates, 10 schools. Outcomes: 28% Professor, 43% Postdoc, 15% V dot Lect dot, 79% Any, 10% Non-Academic, 11% Other.
* Rank 21 to 30: 91 candidates, 11 schools. Outcomes: 29% Professor, 43% Postdoc, 11% V dot Lect dot, 76% Any, 3% Non-Academic, 21% Other.
* Rank 31 to 40: 37 candidates, 7 schools. Outcomes: 22% Professor, 19% Postdoc, 22% V dot Lect dot, 62% Any, 8% Non-Academic, 30% Other.
* Rank 41 to 50: 41 candidates, 8 schools. Outcomes: 15% Professor, 54% Postdoc, 7% V dot Lect dot, 71% Any, 10% Non-Academic, 22% Other.
* Rank 51 to 60: 27 candidates, 8 schools. Outcomes: 22% Professor, 22% Postdoc, 22% V dot Lect dot, 56% Any, 22% Non-Academic, 30% Other.
* Rank 61 to 70: 10 candidates, 4 schools. Outcomes: 20% Professor, 20% Postdoc, 20% V dot Lect dot, 50% Any, 40% Non-Academic, 20% Other.
* Rank 71 plus: 40 candidates, 10 schools. Outcomes: 35% Professor, 18% Postdoc, 20% V dot Lect dot, 72% Any, 8% Non-Academic, 20% Other.
* Totals: 413 candidates, 66 schools. Outcomes: 26% Professor, 39% Postdoc, 15% V dot Lect dot, 72% Any, 8% Non-Academic, 20% Other.
Notes: The table shows the percentages of candidates occupying each type of position. Some candidates occupied more than one position—for example, a postdoctoral position and a tenure-track position. “V. Lect.” refers to temporary visiting-lecturer positions. “Any” refers to any academic position (i.e., tenure-track position, postdoctoral position, or visiting-lecturer position). The final category, “Other,” includes candidates without observable employment as well as candidates who remained at their home institution and were on the job market again the next year.
The rate of placement into professorships varied little with departmental rank. The top decile of departments placed 25% of candidates. The lowest-ranked institutions for which data were available had the highest placement rate: 35%. Placement rates varied for other cohorts between 15% and 29%, but with no clear association with rank. In summary, there is no evidence that only students from top-tier departments were finding faculty positions or that top-ranked programs were the most successful in placing students into tenure-track positions.
…there is no evidence that only students from top-tier departments were finding faculty positions or that top-ranked programs were the most successful in placing students into tenure-track positions.
Conversely, departmental rank was associated with other types of job-market outcomes. Rank was strongly associated with placement into postdoctoral positions. Almost 50% of candidates from top-ranked departments were in a postdoctoral position by Fall 2024. This percentage decreased to 18% for institutions ranked lowest by JH. Candidates from lower-ranked schools were more likely to be in temporary teaching positions or jobs outside of academia. By Fall 2024, 20% of candidates from departments ranked 71 or higher were in temporary teaching positions and 8% were in nonacademic jobs. Comparable rates for top-tier schools were slightly less at 14% and 5%, respectively.
In summary, table 3 reveals that the relationship between rank and placement varied across types of academic positions. Overall, rank did not appear to be associated with placement rates. However, this aggregate pattern masks two distinct labor markets. Graduates of top-ranked programs were more likely to find postdoctoral positions and professorships at PhD-granting institutions. Candidates from lower-ranked institutions were more likely to find visiting-lecturer or tenure-track positions at non-PhD-granting institutions.
The overall placement rate of 26% into tenure-track professorships warrants additional comment. As a measure of the job market, this percentage could be biased upward or downward due to measurement issues. The percentage reflects a single job-market cycle and undoubtedly missed some candidates and some placements. Moreover, many students expect a multiyear search, and many of those taking postdoctoral or visiting-lecturer positions will reenter the job market. These candidates may find a permanent professorship within one or two years. Although this study did not have the data to track candidates across multiyear searches, we can get a sense of outcomes by looking at the Fall 2023 candidates who already held temporary positions.
Table 4 shows placement rates by position held in Fall 2023. The highest placement rate was for candidates in postdoctoral positions. Overall, more than 90% of postdoctoral scholars were still in some type of academic position by Fall 2024, and 30% found professorships.Footnote 9 The second-highest placement rate was for candidates without any observed external position, most of whom were ABDs or recent PhDs. Of these candidates, 26% found tenure-track jobs, 36% found postdoctoral positions, and 12% were in visiting-lecturer or nonacademic positions. An additional 26% were not in any observable new position by Fall 2024. Among candidates who had nonacademic jobs, 25% found tenure-track jobs by Fall 2024; however, there were only eight such candidates.
Placements by Current Position

Table 4 Long description
The table consists of seven columns: Current Position, N (sample size), Professor, Postdoc, V. Lect. (Visiting Lecturer), Non-Academic, and Other.
* Graduate Student (N = 313): 26% Professor, 36% Postdoc, 12% V. Lect., 8% Non-Academic, 26% Other.
* Non-Academic (N = 8): 25% Professor, 12% Postdoc, 0% V. Lect., 62% Non-Academic, 0% Other.
* Post-Doc (N = 66): 30% Professor, 67% Postdoc, 8% V. Lect., 6% Non-Academic, 2% Other.
* Visiting Lecturer (N = 26): 15% Professor, 15% Postdoc, 73% V. Lect., 8% Non-Academic, 0% Other.
Note: 15 candidates who already held assistant professor positions were excluded.
Notes: The table shows the percentage placed into outcomes by current employment as of Fall 2023. The 15 candidates who already held assistant professor positions were excluded.
The lowest placement rates were for candidates who were in visiting-lecturer positions. Only 15% of visiting lecturers secured tenure-track positions. These results are not unexpected. Postdoctoral positions offer prestige, research experience, outside letters of recommendation, and time to advance their research agendas. Visiting lecturers may have significant workloads that make conducting research difficult. Thus, departmental rank may have an indirect effect on placement through these temporary positions: graduating from a highly-ranked department may help students obtain postdoctoral appointments. These positions may then provide an advantage in finding a tenure-track professorship. Students in visiting-lecturer positions may have more difficulty finding permanent positions and may drop out of the candidate pool at a higher rate.
The lowest placement rates were for candidates who were in a visiting-lecturer positions. Only 15% of visiting lecturers secured tenure-track positions.
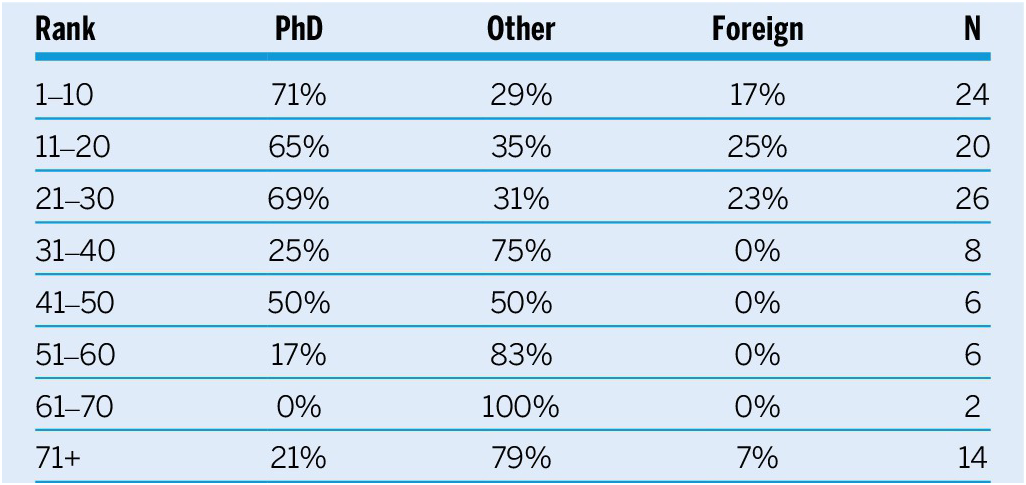
Table 5 compares the types of positions earned by candidates, considering only candidates who accepted professorships. The column labeled “PhD” shows the percentage of new professors in positions at PhD-granting institutions. The column labeled “Other” shows the percentage of new professors at schools without PhD programs or in teaching professorships at PhD-granting institutions.Footnote 10 Candidates from higher-ranked schools were most likely to take regular faculty positions at other PhD-granting institutions, which is consistent with previous research. At top-10 schools, more than 70% of those accepting tenure-track positions did so at a PhD-granting department. Percentages were almost as high for the second and third deciles. Among the lower-ranked institutions, most placed candidates had a position at an institution without a PhD program (or were teaching professors). This result also illustrates the problem with the extant literature: by looking only at placements in PhD-granting institutions, previous research does not observe placements at non-PhD-granting programs and erroneously concludes that candidates from these schools are not finding positions.
Types of Tenure-Track Positions by Rank of PhD-Granting Institution

Table 5 Long description
The table contains five columns: Rank, P h D, Other, Foreign, and N.
* Rank 1 to 10: 71 percent P h D, 29 percent Other, 17 percent Foreign, with an N of 24.
* Rank 11 to 20: 65 percent P h D, 35 percent Other, 25 percent Foreign, with an N of 20.
* Rank 21 to 30: 69 percent P h D, 31 percent Other, 23 percent Foreign, with an N of 26.
* Rank 31 to 40: 25 percent P h D, 75 percent Other, 0 percent Foreign, with an N of 8.
* Rank 41 to 50: 50 percent P h D, 50 percent Other, 0 percent Foreign, with an N of 6.
* Rank 51 to 60: 17 percent P h D, 83 percent Other, 0 percent Foreign, with an N of 6.
* Rank 61 to 70: 0 percent P h D, 100 percent Other, 0 percent Foreign, with an N of 2.
* Rank 71 plus: 21 percent P h D, 79 percent Other, 7 percent Foreign, with an N of 14.
Note: Other positions include M A, B A, and A A granting institutions or teaching professorships.
Notes: The table reports the types of positions earned by candidates who accepted a tenure-track position, by JH Rank. “Other” positions include institutions whose highest degrees were the MA, BA, and AA. These also include new professors at PhD-granting institutions who held “teaching professorships”—that is, a tenure-eligible, permanent position with a higher teaching load and evaluation primarily based on teaching rather than research.
International placements were more frequent among higher-ranked departments. Seventeen percent of placements from top-10 departments were to universities outside of the United States. Similar rates were observed for the second and third deciles. International placements were not observed for institutions ranked 31–70. Only one candidate from an institution ranked above 70 found an international position in this job-market cycle.Footnote 11
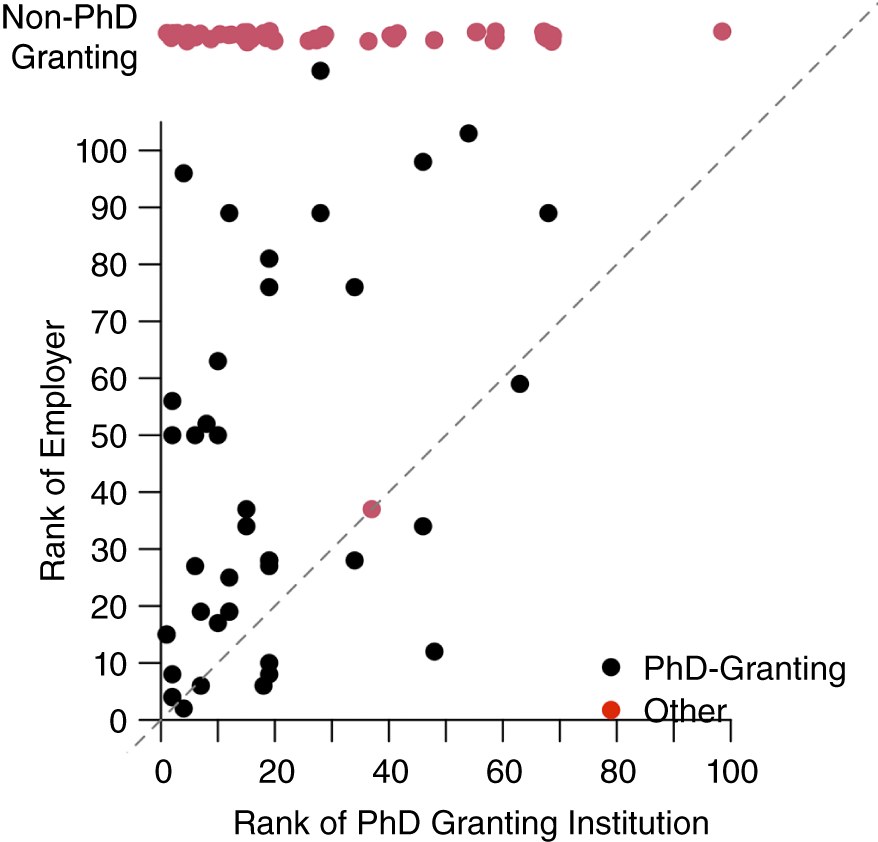
Figure 3 shows the USN&WR rank of candidates’ home and placement institutions for all candidates who found a tenure-track position. The rank of the PhD-granting institution is on the x-axis; the rank of the employer is on the y-axis. Unranked positions at non-PhD-granting institutions are represented above the graph with jittered red points. The red point in the body of the graph is for a teaching professorship at a PhD-granting institution. The dashed line is at a 45-degree angle; points on the line are candidates placed at equally ranked institutions. As noted by other researchers (Jepson and Hatemi Reference Jepson and Hatemi2025; Wapman et al. Reference Wapman, Zhang, Clauset and Larremore2022), most successful candidates were placed at lower-ranked institutions than their home institution: the majority of points were above the 45-degree line. Of those who placed at or below the 45-degree line—that is, candidates who moved to an institution ranked as high or higher than their PhD-granting institution—one found a teaching professorship. Those who found standard professorships generally had strong publication records.
Rank of Employer Versus Rank of PhD-Granting Institution
The figure shows the rank of the PhD-granting and -employing institutions for newly hired assistant professors after the 2023–2024 job-market cycle. Ranks are the USN&WR rank and apply only to departments with PhD programs based in the United States. The red symbols above the graph correspond to candidates hired into a tenure-track position at non-PhD-granting departments. Red symbols in the body of the graph are teaching professorships at ranked PhD-granting departments.

Figure 3 Long description
A scatter plot with the x-axis labeled Rank of P h D Granting Institution and the y-axis labeled Rank of Employer. Both axes range from 0 to 100, where lower numbers indicate higher prestige. A dashed diagonal line represents a one-to-one ratio where the rank of the granting institution equals the rank of the employer.
* Data Points: Black dots represent hires at P h D-granting departments. Most black dots are clustered in the bottom-left quadrant (high-rank granting institutions) but are spread vertically, indicating that graduates from top-ranked programs are hired across a wide range of employer ranks. Very few dots appear below the diagonal line, suggesting it is rare for a candidate to be hired by an institution ranked significantly higher than their P h D-granting institution.
* Teaching Professorships: A single red dot labeled Other is located within the main graph area near the diagonal line at approximately (38, 38).
* Non-P h D Granting Hires: A horizontal row of red dots is positioned above the main graph, aligned with a label on the y-axis for Non-P h D Granting. These dots are concentrated above the x-axis range of 0 to 20, showing that most candidates hired into tenure-track positions at non-P h D-granting departments graduated from top-20 ranked programs.
Taken together, these findings present a more nuanced picture of the relationship between departmental ranking and candidate outcomes. Overall, placement rates for candidates were similar across higher- and lower-ranked departments, with about 25% of candidates finding permanent academic positions in the 2023–2024 job-market cycle. However, higher-ranked departments had an advantage in placing candidates into postdoctoral positions that may improve their prospects in multiyear searches. In addition, candidates from higher-ranked departments were more likely to secure positions in PhD-granting and higher-ranked institutions, whereas candidates from lower-ranked schools were more likely to find employment at MA-/BA-granting departments.
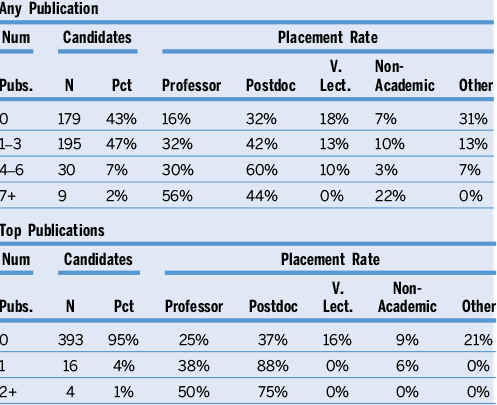
Other factors, of course, affect placements. Perhaps the most important is research productivity, especially high-impact publishing. Table 6 examines tenure-track placements by publications. The top half of the table shows results for publications in any journal. The bottom half shows results for publications in “top” journals.Footnote 12 Coauthored and solo-authored publications are grouped together in the table. Most candidates (57%) had at least one publication, although a few had four or more (9%). Only a few candidates had high-impact publications (5%).
Placement Rates by Publications

Table 6 Long description
The first sub-table, Any Publication, categorizes candidates by the number of publications: 0, 1 to 3, 4 to 6, and 7 plus.
- 0 publications: 179 candidates (43 percent). Placement rates: Professor 16 percent, Postdoc 32 percent, V. Lect. 18 percent, Non-Academic 7 percent, Other 31 percent.
- 1 to 3 publications: 195 candidates (47 percent). Placement rates: Professor 32 percent, Postdoc 42 percent, V. Lect. 13 percent, Non-Academic 10 percent, Other 13 percent.
- 4 to 6 publications: 30 candidates (7 percent). Placement rates: Professor 30 percent, Postdoc 60 percent, V. Lect. 10 percent, Non-Academic 3 percent, Other 7 percent.
- 7 plus publications: 9 candidates (2 percent). Placement rates: Professor 56 percent, Postdoc 44 percent, V. Lect. 0 percent, Non-Academic 22 percent, Other 0 percent.
The second sub-table, Top Publications, categorizes candidates by the number of top-tier publications: 0, 1, and 2 plus.
- 0 top publications: 393 candidates (95 percent). Placement rates: Professor 25 percent, Postdoc 37 percent, V. Lect. 16 percent, Non-Academic 9 percent, Other 21 percent.
- 1 top publication: 16 candidates (4 percent). Placement rates: Professor 38 percent, Postdoc 88 percent, V. Lect. 0 percent, Non-Academic 6 percent, Other 0 percent.
- 2 plus top publications: 4 candidates (1 percent). Placement rates: Professor 50 percent, Postdoc 75 percent, V. Lect. 0 percent, Non-Academic 0 percent, Other 0 percent.
Notes: The table shows the percentages of candidates in a tenure-track assistant professor position, by the number of publications of various types.
It is no surprise that publishing is associated with a reduced risk of having to find a nonacademic job. The placement rate increased with the number of publications. The placement rate for students without any publications was only 16%. For students with one to three publications, the rate doubled to 32%. For the few students with seven or more publications, more than half (56%) found permanent positions. For top-journal publications, one publication was associated with an increase in the placement rate from 25% to 38%. Candidates with two or more top-journal publications had a 50% placement rate, although there were only four such candidates.
The placement rate for students without any publications was only 16%. For students with one to three publications, the placement rate doubled to 32%. For the few students with seven or more publications, more than half (56%) found permanent positions.
Publishing was also associated with placement into other positions. One top-journal publication increased postdoctoral placements from 37% to 88%. Placement into visiting-lecturer positions was negatively correlated with publications. No candidates with seven or more publications of any type, and no candidates with any top-journal publications, were observed in a visiting lectureship by Fall 2024.
Table 7 shows placement rates by the number of TA and lead-instructor positions. There was no apparent benefit to teaching experience in this dataset. If anything, too much experience was associated with lower placement rates. Candidates with seven or more teaching experiences had lower placement rates than those with less experience. This may reflect the difficulty of finishing a dissertation or publishing while managing the demands of teaching.
Teaching Experience and Placement

Table 7 Long description
The table is organized into five columns. The first column lists the number of teaching positions held, categorized as 0, 1 to 3, 4 to 6, and 7 plus. The subsequent columns are grouped under two main headers: T A and Lead Instructor.
Under the T A header:
* For 0 positions: N is 26 with a 27 percent placement rate.
* For 1 to 3 positions: N is 119 with a 29 percent placement rate.
* For 4 to 6 positions: N is 122 with a 34 percent placement rate.
* For 7 plus positions: N is 51 with an 18 percent placement rate.
Under the Lead Instructor header:
* For 0 positions: N is 140 with a 26 percent placement rate.
* For 1 to 3 positions: N is 143 with a 31 percent placement rate.
* For 4 to 6 positions: N is 26 with a 31 percent placement rate.
* For 7 plus positions: N is 8 with a 13 percent placement rate.
Notes indicate that placement refers to candidates accepting a tenure-track assistant professorship by Fall 2024. C Vs were unavailable for approximately 15 percent of candidates.
Notes: The table shows the percentages of candidates accepting a tenure-track assistant professorship by Fall 2024 by the number of unique TA positions and the number of lead-instructor positions previously held by the job candidate. CVs were not available for approximately 15% of candidates; therefore, the total number of candidates is lower than in other tables.
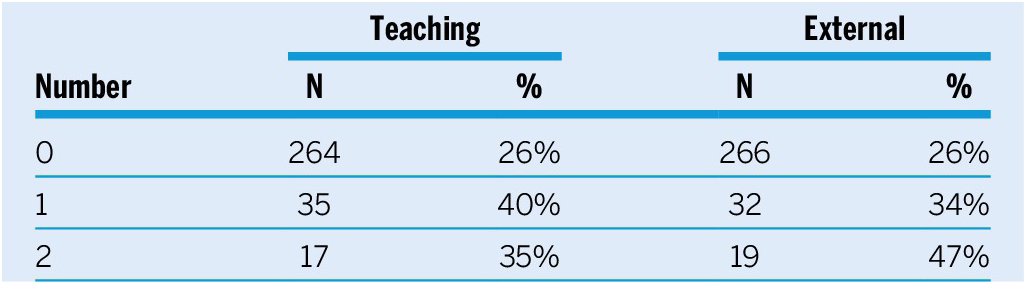
Table 8 presents the relationship between awards and placements. Teaching awards were associated with a modest increase in placements rates, which were approximately 10 percentage points higher for candidates with awards than for those without any awards. External awards—including awards for papers, dissertations, and presentations—had a stronger association with placement. Candidates with two or more of these awards had a 47% placement rate compared with 26% for candidates without any awards.
Placement Rates by Number of Teaching and External Awards

Table 8 Long description
The table is organized into five columns. The first column is labeled Number, representing the count of awards. The next two columns are grouped under the heading Teaching, subdivided into N and percent. The final two columns are grouped under the heading External, also subdivided into N and percent.
Row 1: Number 0. Teaching has N 264 and 26 percent. External has N 266 and 26 percent.
Row 2: Number 1. Teaching has N 35 and 40 percent. External has N 32 and 34 percent.
Row 3: Number 2. Teaching has N 17 and 35 percent. External has N 19 and 47 percent.
A footnote indicates that the data represents candidates accepting positions by Fall 2024 and notes that C V s were unavailable for approximately 15 percent of candidates.
Notes: The table shows the percentage of candidates accepting a tenure-track assistant professorship by Fall 2024 by the number of teaching awards and by the number of external awards. CVs were not available for approximately 15% of candidates; therefore, the total number of candidates is lower than in other tables.
Placement rates also varied by the candidate’s major field of study. Table 9 shows job listings and outcomes by core fields: American politics, comparative politics, IR, political theory, methods, and other fields. The listings data were provided by the American Political Science Association (APSA) from its eJobs platform and included listings for assistant and assistant/associate professors.Footnote 13 In the 2023–2024 job-market cycle, candidates in American politics had by far the highest placement rate: almost 40% found a tenure-track position. This was not unexpected given hiring patterns that year. There were the same number of American politics candidates as open positions (i.e., 118 candidates and 118 positions on eJobs). Other fields placed between 20% and 24% of candidates. Comparative politics experienced the largest mismatch of jobs and candidates, with 189 candidates and only 71 comparative-specific positions. Political theory had the fewest positions on eJobs (37) but also had the smallest cohort: 71 candidates in my dataset. Political theory also had the lowest placement rate at about 20%.Footnote 14
Outcomes by Field

Table 9 Long description
The table consists of six columns: Field, Jobs N, Jobs Percent, Candidates N, Candidates Percent, and Percent Placed.
* American Politics: 118 jobs (25.5 percent), 118 candidates (28.6 percent), 39.8 percent placed.
* Comparative Politics: 71 jobs (15.4 percent), 189 candidates (45.8 percent), 21.2 percent placed.
* I R: 85 jobs (18.4 percent), 126 candidates (30.5 percent), 21.4 percent placed.
* Political Theory: 37 jobs (8.0 percent), 71 candidates (17.2 percent), 19.7 percent placed.
* Methods: 13 jobs (2.8 percent), 105 candidates (25.4 percent), 23.8 percent placed.
* Other: 138 jobs (29.9 percent), 82 candidates (19.9 percent), 23.2 percent placed.
Notes indicate that candidate percentages exceed 100 percent because individuals may claim multiple fields. Placements refer to tenure-track positions secured by Fall 2024.
Notes: The table shows the number and percentages of APSA e-Job listings in major fields as well as the number and percentages of candidates in each field. The percentages of candidates total more than 1.0 because candidates may claim more than one field. Placements show the percentages of candidates in each field that secured a tenure-track position by Fall 2024.
Finally, table 10 shows outcomes by demographics. URM and female candidates were underrepresented in the pool of candidates. Female and URM candidates comprised 40% and 12% of the candidate pool, respectively. However, URM and female candidates were not placed into professorships at lower rates than other identities in 2023. In fact, they were more likely to find positions than non-URM, non-female candidates. The lowest observed placement rate was for non-URM male candidates, 19% of whom were assistant professors by Fall 2024. Placement rates were more than double (39%) for URM male candidates. Among women, 32% and 36% of non-URM and URM candidates found a position, respectively. For other types of positions, there were modest differences in placement across identities. Non-URM male candidates were more likely to take visiting-lecturer positions than other candidates, and URM female candidates were less likely to be in postdoctoral positions by Fall 2024. Rates of placement into other positions were similar across identities.
Outcomes by Demographics

Table 10 Long description
The table consists of eight columns: Demographic Category, Professor, Postdoc, V. Lect., Non-Academic, Other, Percentage, and N.
Row 1: U R M, Female. Professor 36.0 percent, Postdoc 32.0 percent, V. Lect. 8.0 percent, Non-Academic 8.0 percent, Other 28.0 percent, Percentage 6.1 percent, N 25.
Row 2: U R M, Male. Professor 38.5 percent, Postdoc 46.2 percent, V. Lect. 3.8 percent, Non-Academic 7.7 percent, Other 15.4 percent, Percentage 6.3 percent, N 26.
Row 3: Non-U R M, Female. Professor 32.1 percent, Postdoc 39.3 percent, V. Lect. 12.9 percent, Non-Academic 7.1 percent, Other 17.9 percent, Percentage 33.9 percent, N 140.
Row 4: Non-U R M, Male. Professor 18.9 percent, Postdoc 38.7 percent, V. Lect. 18.0 percent, Non-Academic 9.5 percent, Other 21.2 percent, Percentage 53.8 percent, N 222.
Notes: The table shows the percentages of candidates placed into different positions according to apparent gender and URM status.
MULTIVARIATE ANALYSIS
For a multivariate analysis, I first report on a set of logistic regressions examining placement into any tenure-track position. For the logistic-regression models, the dependent variable was coded “1” for candidates observed to be holding a tenure-track professorship by Fall 2024 and “0” for candidates not observed in such positions. The independent variables included those previously presented, with several adjustments. To measure publication success in the multivariate models, I used the journal impact scores of the candidate’s highest-placed coauthored and solo-authored articles.Footnote 15
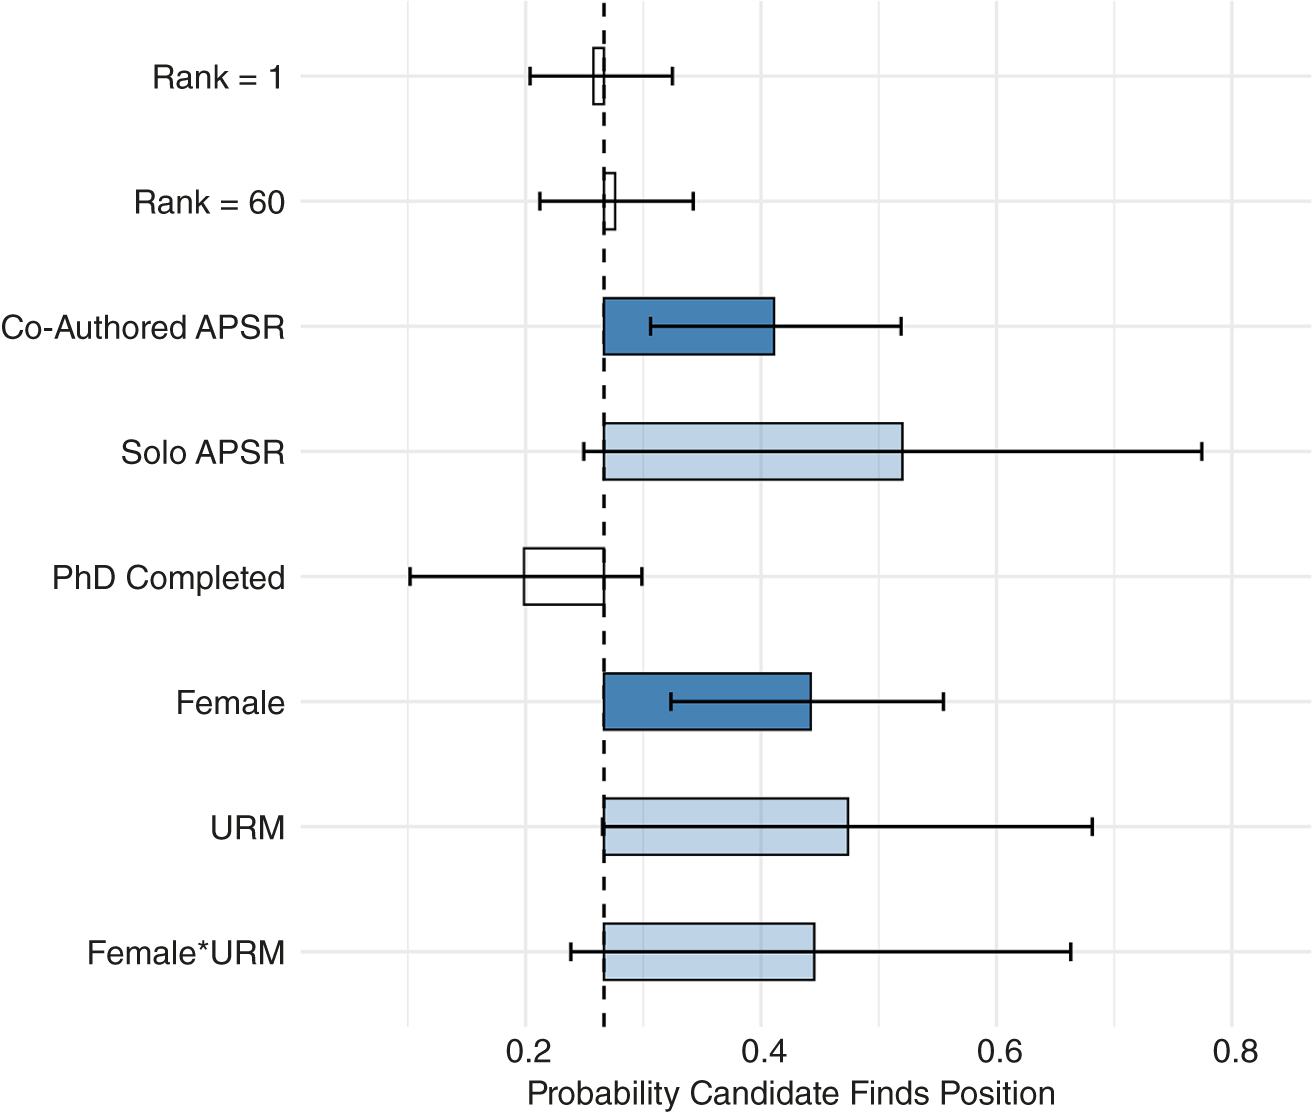
Table 11 presents results from three logistic regression models. Figure 4 shows the changes in predicted probability for hypothetical candidates when compared to a baseline candidate (using model 2). The baseline candidate was from a 30th-ranked institution, was an ABD, had no publications, focused solely on American politics, and was a non-URM male candidate. This profile had a predicted probability of 0.27 of holding a professorship by Fall 2024.
Predictors of Appointment to a Tenure-Track Position, All Institutions

Table 11 Long description
The table presents regression results for three models, labeled 1, 2, and 3. Each predictor includes a coefficient and a standard error in open parenthesis below it.
* Rank: Model 1 is -0.001 (0.005); Model 2 is 0.002 (0.006); Model 3 is -0.006 (0.007).
* Coauthored: Model 2 is 0.096 with three asterisks (0.035); Model 3 is 0.074 with two asterisks (0.037).
* Solo-Authored: Model 2 is 0.161 with one asterisk (0.089); Model 3 is 0.165 (0.103).
* A B D: Model 2 is 0.383 (0.282); Model 3 is 0.524 (0.331).
* Female: Model 2 is 0.780 with three asterisks (0.268); Model 3 is 0.923 with three asterisks (0.325).
* U R M: Model 2 is 0.908 with two asterisks (0.463); Model 3 is 1.261 with two asterisks (0.543).
* Female asterisk U R M: Model 2 is -0.896 (0.663); Model 3 is -1.228 (0.749).
* Comparative: Model 2 is -0.710 with three asterisks (0.258); Model 3 is -0.780 with three asterisks (0.300).
* Theory: Model 2 is -0.576 (0.385); Model 3 is -1.332 with two asterisks (0.529).
* International Relations: Model 2 is -0.417 (0.282); Model 3 is -0.689 with two asterisks (0.331).
* Methods: Model 2 is -0.306 (0.304); Model 3 is -0.389 (0.344).
* Other: Model 2 is -0.268 (0.320); Model 3 is -0.318 (0.391).
* Log open parenthesis Conferences close parenthesis: Model 3 is 0.239 (0.211).
* Teaching Experience: Model 3 is -0.053 (0.046).
* Teaching Awards: Model 3 is 0.168 (0.238).
* External Awards: Model 3 is 0.125 (0.137).
Summary statistics at the bottom:
* Observations: Model 1 is 413; Model 2 is 413; Model 3 is 311.
* A I C: Model 1 is 474.4; Model 2 is 458.5; Model 3 is 351.5.
* Log Likelihood: Model 1 is -235.194; Model 2 is -216.251; Model 3 is -158.734.
* F-Test: Model 1 is 0.047; Model 2 is 2.573; Model 3 is 2.437.
Notes: one asterisk p < 0.1, two asterisks p < 0.05, three asterisks p < 0.01.
Notes: *p<0.1, **p<0.05, ***p<0.01.
Candidate Profiles and Predicted Probability of Holding Assistant Professor Position by Fall 2024
The figure shows the predicted probability of holding a tenure-track position in Fall 2024 as a function of candidate profiles. Predicted probability was based on model 2, table 11. The dashed line shows the baseline predicted probability of a candidate securing a tenure-track position when the candidate was a non-URM non-female, was from a 30th-ranked department, had no publications, was studying American politics, and had not completed the PhD. Bars show predicted probability for each scenario. Shading reflects significance of change: solid for p < .05, shaded for .05 < p < .10, and empty for p > .10. Error bars cover 95% confidence intervals for change in predicted probability.

Figure 4 Long description
A horizontal dot plot with error bars and shaded confidence intervals. The X axis represents the Probability Candidate Finds Position, ranging from 0.2 to 0.8. A vertical dashed baseline is set at approximately 0.27.
From top to bottom, the profiles are
* Rank equals 1. The point is slightly left of the baseline at 0.26 with error bars from 0.15 to 0.42.
* Rank equals 60. The point is slightly right of the baseline at 0.28 with error bars from 0.18 to 0.42.
* Co-Authored A P S R. A light blue bar extends from the baseline to a point at 0.41, with error bars reaching 0.58.
* Solo A P S R. A light blue bar extends from the baseline to a point at 0.52, with error bars reaching 0.8.
* P h D Completed. The point is left of the baseline at 0.2, with error bars from 0.1 to 0.35.
* Female. A dark blue bar extends from the baseline to a point at 0.44, with error bars from 0.3 to 0.59.
* U R M. A light blue bar extends from the baseline to a point at 0.47, with error bars from 0.26 to 0.7.
* Female asterisk U R M. A light blue bar extends from the baseline to a point at 0.44, with error bars from 0.25 to 0.67.
In these models, I failed to reject the null that departmental rank was not associated with finding a tenure-track professorship. The estimated coefficient on rank was sometimes positive and sometimes negative across specifications, was small, and was never statistically significant. This was true with and without standard control variables, and was consistent with the descriptive statistics examined previously, in which the placement rate was fairly constant across higher- and lower-ranked institutions.
Although the rank of an institution was not a linear predictor of placement, perhaps where the PhD was earned “matters” in another nonlinear way. To test this, I ran several linear-probability models that included indicator variables for each institution (see the online appendix). An F-test comparing models with and without institution fixed effects revealed that the institution indicators did not jointly improve model fit (p=0.378).
What did matter in this model was publishing. The estimated coefficient for a coauthored article was positive and statistically significant in both models in which it was present and was substantively large. As shown in figure 4, a coauthored APSR article was associated with an increase in the predicted probability of placement for the hypothetical candidate from 0.27 to 0.41.Footnote 16 The estimated coefficient for a solo-authored article was even larger and was significant in model 2.Footnote 17 For the hypothetical candidate, publishing a solo-authored APSR article was associated with a predicted probability of obtaining a tenure-track position of almost 0.52, nearly double the baseline probability.Footnote 18
Both gender and URM status were associated with placement. Again, there was no evidence of discrimination against female or URM candidates. Indicator variables for these groups were associated with higher placement rates. As shown in figure 4, the baseline candidate had a predicted probability of 0.27 of securing an assistant professor position. A URM male’s predicted probability was 0.47, nearly double the baseline. Similarly, a female candidate’s predicted probability was almost 0.44 and a URM female’s was 0.45.
These results may be surprising to some, but they are consistent with recent empirical research on gender and academic hiring. For example, Williams and Ceci (Reference Williams and Ceci2015) conducted a series of randomized experiments and found a 2:1 preference for hiring female over male candidates in academia. Subsequently, Ceci, Kahn, and Williams (Reference Ceci, Kahn and Williams2023) reviewed the empirical literature on gender bias in academia. They observed a consistent advantage for women over men in tenure-track hiring.Footnote 19 I separately analyzed data from APSA’s Graduate Placement Survey and found similar results.Footnote 20
Regarding other variables, American politics (i.e., the excluded category) had the highest placement rate in this dataset, and indicator variables for all other fields had negative estimated coefficients. A likelihood ratio test of the restriction that all field coefficients were zero (not shown) was significant at the 0.10 level (p=0.08). An indicator for ABD was not statistically significant in these models. Conferences, awards, and teaching experience were not significant in this analysis.
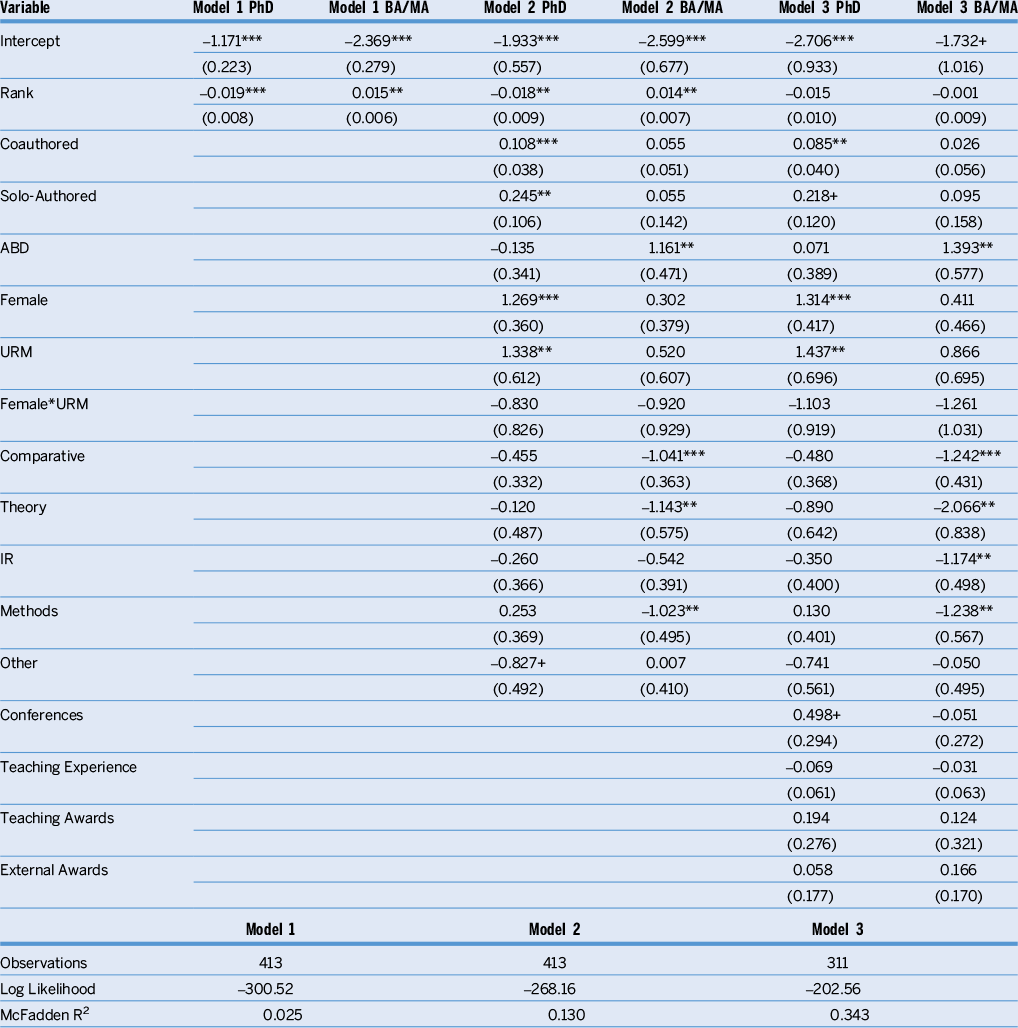
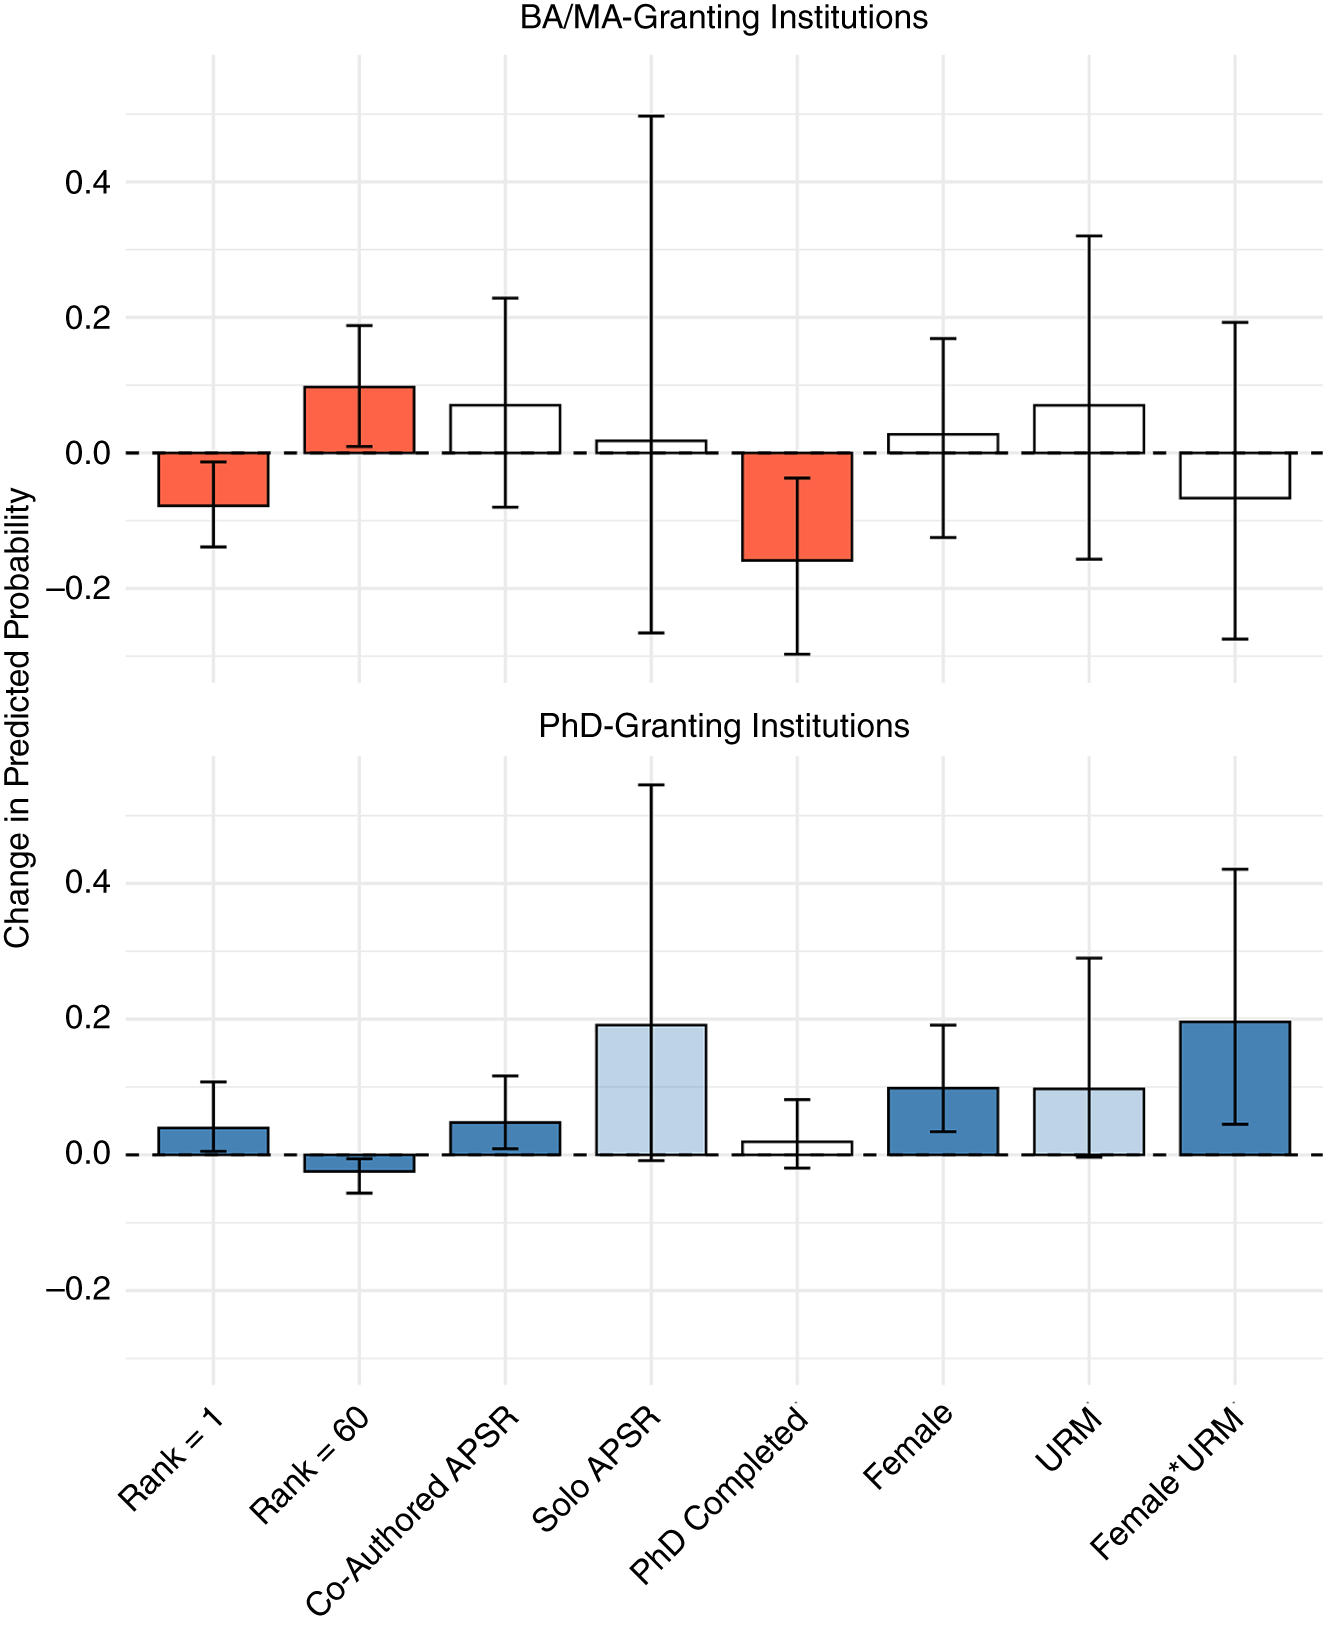
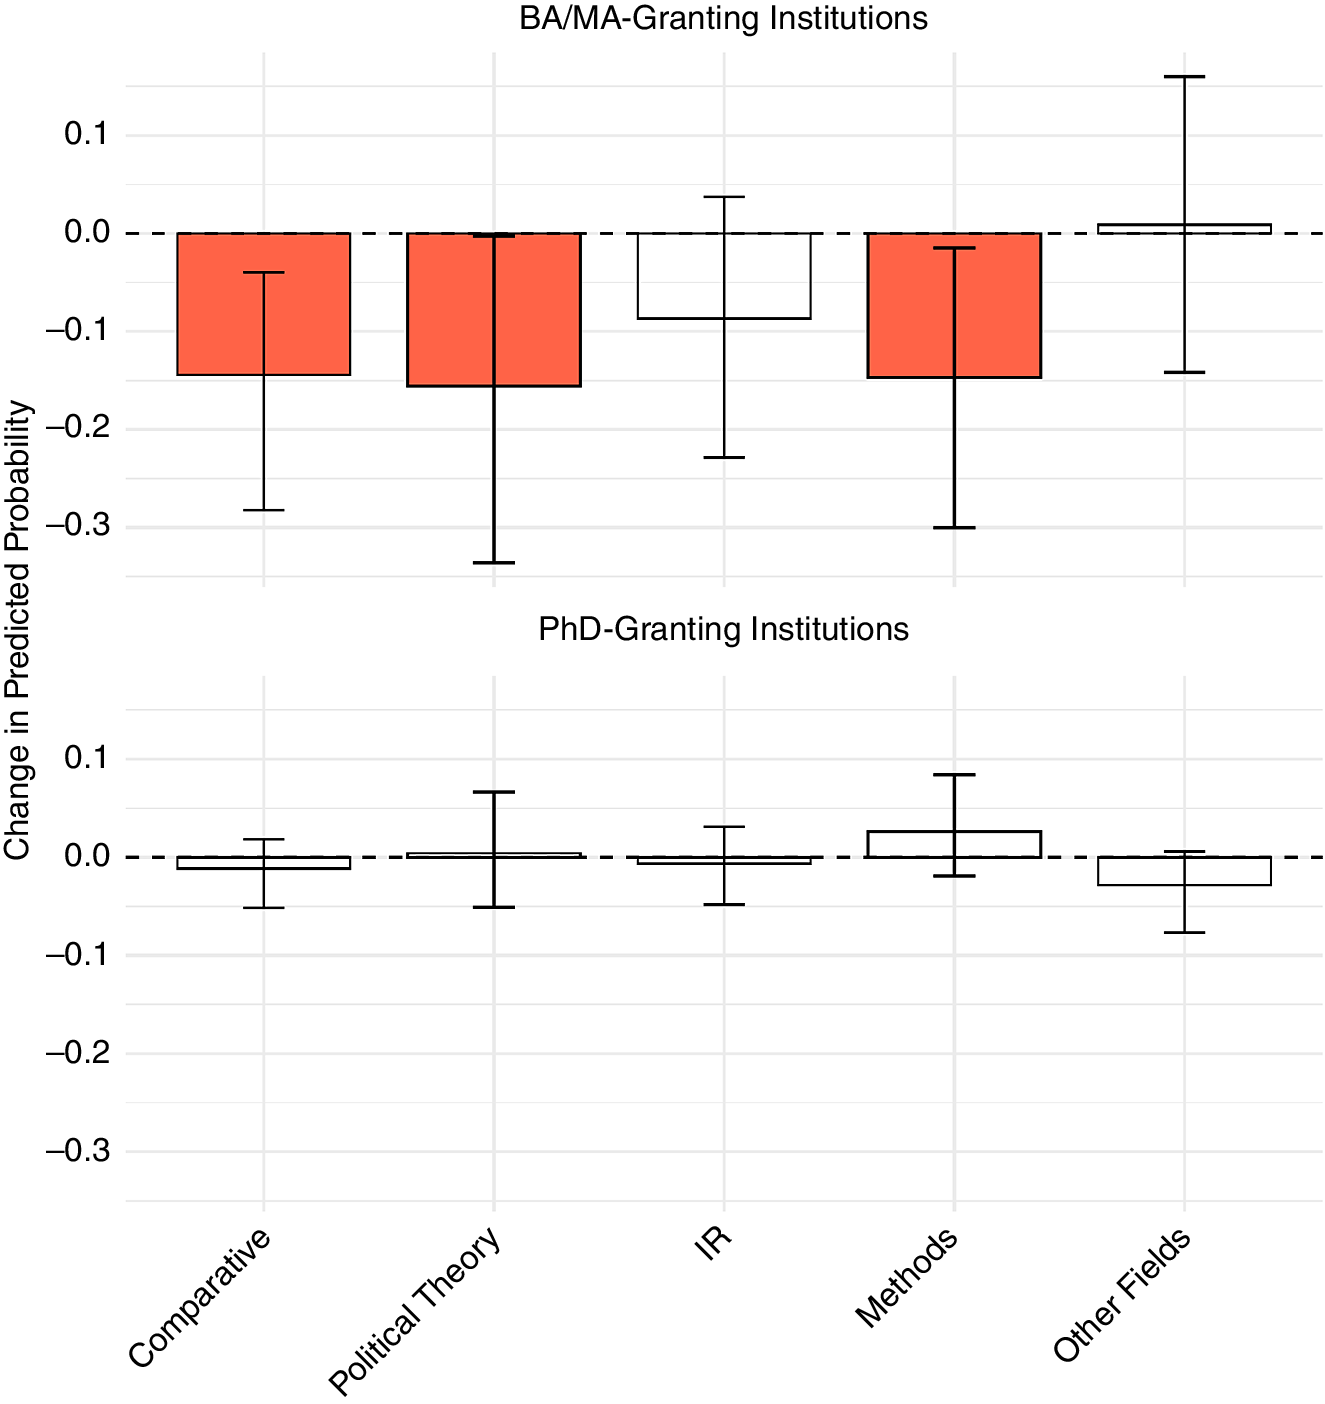
Table 12 presents a multinomial logit, separating placements into standard lines at PhD programs and other types of positions, including positions at BA-/MA-granting departments and teaching professorships. Figures 5 and 6 show corresponding changes in predicted probabilities for hypothetical candidates, calculated from model 2. The base category for the multinomial model was not holding a professorship in Fall 2024. The baseline hypothetical candidate was an ABD from a 30th-ranked department, studying American politics, with no publications, and coded as non-female and non-URM. For this candidate, the predicted probability of placement at a PhD-granting department was 0.051 and at a BA-/MA-granting department was 0.254.
Multinomial Results

Table 12 Long description
A table titled Multinomial Results with seven columns: Variable, M 1 P h D, M 1 B A or M A, M 2 P h D, M 2 B A or M A, M 3 P h D, and M 3 B A or M A.
Key variables and selected coefficients include:
* Intercept: Values range from negative 1.171 to negative 2.706 across models.
* Rank: Shows negative coefficients for P h D tracks (e.g., negative 0.019 in M 1) and positive for B A or M A tracks (e.g., 0.015 in M 1).
* Coauthored: M 2 P h D is 0.108 and M 3 P h D is 0.085.
* Female: Significant positive coefficients for P h D tracks (1.269 in M 2 and 1.314 in M 3).
* U R M: Significant positive coefficients for P h D tracks (1.338 in M 2 and 1.437 in M 3).
* Field variables: Includes Comparative, Theory, I R, Methods, and Other, showing mostly negative coefficients for B A or M A tracks.
* Professional variables: Conferences (0.498 in M 3 P h D), Teaching Experience, Teaching Awards, and External Awards are listed for Model 3.
Summary statistics at the bottom:
* Observations: 413 for M 1 and M 2; 311 for M 3.
* Log Likelihood: Decreases from negative 300.52 in M 1 to negative 202.56 in M 3.
* McFadden R super 2: Increases from 0.025 in M 1 to 0.343 in M 3.
Notes indicate coefficients are from multinomial logit models with no job as the base outcome. Standard errors are provided in parentheses below coefficients.
Notes: Coefficients are from multinomial logit models. Base outcome is no job. Standard errors are in parentheses. Significance levels: ***p<0.01, **p<0.05, p<0.10.
Candidate Profiles and Predicted Probability of Placement
The figure shows the change in predicted probability of outcomes associated with various candidate profiles. Outcomes are a professorship position at a PhD-granting institution, a professorship position at a non-PhD-granting institution, and the baseline category of no professorship position. The baseline-candidate profile was a non-URM, non-female candidate from the 30th-ranked department, with no publications and studying American politics. Predicted probabilities were calculated from model 2, table 12. Shading reflects significance of change: solid for p < .05, shaded for .05 < p < .10, and empty for p > .10. Error bars cover 95% confidence intervals.

Figure 5 Long description
The chart consists of two vertically stacked panels with a shared x-axis and y-axis. The y-axis represents the Change in Predicted Probability, ranging from negative 0.2 to 0.4. A dashed horizontal line marks the zero baseline. The x-axis lists eight profiles: Rank equals 1, Rank equals 60, Co-Authored A P S R, Solo A P S R, P h D Completed, Female, U R M, and Female asterisk U R M.
Top Panel: B A / M A-Granting Institutions.
- Rank equals 1: Red bar slightly below zero.
- Rank equals 60: Red bar slightly above zero.
- Co-Authored A P S R: White bar slightly above zero.
- Solo A P S R: White bar near zero with a very large vertical error bar.
- P h D Completed: Red bar below zero.
- Female: White bar slightly above zero.
- U R M: White bar slightly above zero with a large error bar.
- Female asterisk U R M: White bar slightly below zero.
Bottom Panel: P h D-Granting Institutions.
- Rank equals 1: Dark blue bar slightly above zero.
- Rank equals 60: Dark blue bar slightly below zero.
- Co-Authored A P S R: Dark blue bar slightly above zero.
- Solo A P S R: Light blue bar above zero with a large error bar.
- P h D Completed: White bar near zero.
- Female: Dark blue bar above zero.
- U R M: Light blue bar above zero with a large error bar.
- Female asterisk U R M: Dark blue bar significantly above zero.
Candidate Subfield and Predicted Probability of Placement
The figure shows the change in predicted probability of outcomes associated with various candidate profiles. Outcomes are a professorship position at a PhD-granting institution, a professorship position at a non-PhD-granting institution, and the baseline category of no professorship position. The baseline-candidate profile was a non-URM, non-female candidate from the 30th-ranked department, with no publications, and studying American politics. Predicted probabilities were calculated from model 2, table 12. Shading reflects significance of change: solid for p < .05, shaded for .05 < p < .10, and empty for p > .10. Error bars cover 95% confidence intervals.

Figure 6 Long description
The chart consists of two vertically stacked panels with a shared Y-axis labeled Change in Predicted Probability, ranging from negative 0.3 to 0.1. A dashed horizontal line at 0.0 represents the baseline. The X-axis lists five subfields: Comparative, Political Theory, I R, Methods, and Other Fields.
Top Panel: B A forward slash M A-Granting Institutions.
* Comparative: Red bar extending down to approximately negative 0.15 with a wide error bar.
* Political Theory: Red bar extending down to approximately negative 0.16 with a wide error bar.
* I R: White bar extending down to approximately negative 0.09 with a wide error bar.
* Methods: Red bar extending down to approximately negative 0.15 with a wide error bar.
* Other Fields: White bar sitting just above 0.0 with a very large error bar extending from negative 0.15 to 0.15.
Bottom Panel: P h D-Granting Institutions.
* Comparative: White bar slightly below 0.0.
* Political Theory: White bar slightly above 0.0.
* I R: White bar slightly below 0.0.
* Methods: White bar slightly above 0.0.
* Other Fields: White bar extending down to approximately negative 0.03.
All bars in the bottom panel have much smaller error bars compared to the top panel, clustered closely around the 0.0 baseline.
For PhD placements, rank was statistically significant but had modest effects. Moving from a 30th-ranked institution to a first-ranked institution was associated with an increase in the probability of such a placement from 0.05 to 0.09. Moving down from a 30th-ranked to a 60th-ranked institution reduced the probability to 0.03. Both coauthored and solo-authored publications were significant. Publishing a coauthored APSR article was associated with an increase in predicted probability from 0.05 to 0.10. Publishing a solo-authored APSR article was associated with a much larger increase, to 0.20. Demographic variables also were associated with substantial changes in the probability of placement. Being a URM male or a non-URM female was associated with an almost tripling of the predicted probability of a professorship, to 0.15. A URM female had an even higher predicted probability of placement of 0.24.
Reviewing results for non-PhD-granting institutions reveals a different pattern. In model 2, rank had a positive and significant coefficient: candidates from lower-ranked departments were more likely to be placed into a professorship than candidates from higher-ranked programs. Publications were not statistically significant. ABDs appear to have had a significant advantage. As shown in figure 5, a candidate without a PhD had a probability of placement of 0.25, compared with 0.10 for a candidate with a PhD. This unexpected result may reflect the strongest candidates from the class of 2023 finding positions the previous year as ABDs. Neither gender nor URM status were significant. This may be the result of candidate preferences, competition for these types of candidates by top-tier institutions, or other factors.
The relationship between field and outcomes also varied across types of placements. For positions at PhD-granting institutions, estimated coefficients for all fields except methods were negative, but generally not significant. For placements at other types of institutions, almost all of the estimated coefficients were negative. Results were significant in some specifications for comparative politics, political theory, IR, and methods. Substantively, the hypothetical candidate in American politics had a predicted probability of 0.25 for finding a position at a non-PhD institution. If the candidate were in political theory, the predicted probability fell to 0.10.Footnote 21 In a test that examined whether field “matters” (i.e., restricting coefficients on all fields to 0 and comparing with an unrestricted model), field was significant only for non-PhD-granting departments. This likely captures a greater need for instruction in American politics at non-PhD-granting institutions.
Among the remaining variables, teaching experience and awards were not significant. These factors may not be associated with outcomes, or there simply may not be sufficient variance in these factors to accurately estimate their relationship with placements. Almost every candidate had some teaching experience (i.e., TA or lead instructor) and few candidates had awards. There also were many missing observations for these variables because they were measured from candidates’ CVs, which were not available in some cases. The one exception was conference attendance: the estimated coefficient for this variable was positive and significant for placements into PhD-granting institutions. Substantively, attending five conferences was associated with a modest increase in the probability of a position at a PhD-granting institution when compared with a baseline candidate without any conference attendance.Footnote 22
Taken together, the multinomial results indicate two distinct job markets with different predictors of placement. For a tenure-track position at a PhD-granting institution, graduating from a higher-ranked doctoral program was associated with a greater probability of placement. However, the magnitude of the rank effect was modest. Candidates’ publication records had larger apparent effects: both coauthored and solo-authored publications were associated with higher predicted probabilities, and solo-authored publications in high-impact journals were associated with especially substantial gains. Female and URM candidates also exhibited significantly higher predicted probabilities of placement into these positions. In addition, conference attendance was positively associated with placement.
For placements at a non-PhD-granting institution, doctoral rank was negatively associated with placement, with candidates from lower-ranked programs more likely to occupy those positions. Publications and identity were not significant predictors for these placements. Specializing in American politics was associated with placement at these institutions. In addition, ABDs had a significantly higher placement rate than recent PhDs.
DISCUSSION
Previous research has concluded that one of the major predictors of placement is where the PhD was earned. This is only partly correct. When we consider the academic job market broadly, we cannot reject the null hypothesis that departmental rank was not associated with placement into a tenure-track position. Candidates from higher- and lower-ranked institutions were equally likely to find assistant professorships one year after entering the job market. The apparent advantage of prestige largely reflects the extant literature’s narrow focus on placements into PhD-granting departments and limiting analysis to the backgrounds of current faculty members.
However, rank was strongly associated with types of placements, reflecting two different segments of the academic labor market. Candidates from top-ranked programs were more likely to find professorships at PhD-granting institutions, although the impact of rank was modest. Rank had the opposite association with placements into non-PhD-granting departments: its estimated coefficient was positive and significant (in two of three models). In other words, lower-ranked departments (with higher-rank values) were more likely to place candidates into professorships at BA-/MA-granting departments.Footnote 23
Thus, perhaps just as important as where you earn your PhD is what you want to do with it. One of my advisors, John Petrocik, used to tell us that success was equal to achievement divided by ambition. If a satisfactory outcome includes teaching at a small liberal arts college, a community college, or another non-PhD-granting institution, then coming from a “lower-ranked” department might be better than coming from a “top-tier” program.
Several other trends warrant discussion. The first position after graduate school can be an important stepping stone to a permanent professorship, but some paths are more difficult than others. Postdoctoral scholars had a significantly higher placement rate than ABDs coming immediately from graduate school. However, candidates in visiting-lecturer positions had low placement rates into permanent positions. These findings are especially important because the academic job market is extremely competitive and likely to tighten further in the near term. Graduate students often face financial insecurity as well as stress and heavy workloads. Graduate students also report higher rates of depression than the general population.Footnote 24 In this challenging environment, departments can support PhD students in several ways.
Perhaps the most important step that departments can take is to be transparent about outcomes from their programs. Like JH, while collecting data for this study, I noted many departments’ claims of “excellent placement records,” often without supporting evidence. Asking students to spend years of their lives pursuing a PhD (while also supporting faculty teaching and research) based on vague references to placements risks misleading prospective students, especially given the demographic and budget challenges facing higher education. For these reasons, I support JH’s call for transparency and I urge that every graduate program post and regularly update data on (1) the percentage of entering students who finish the degree; (2) the average time to degree completion; (3) details about financial support; (4) the percentage of students who enter the academic job market; and (5) the percentage of candidates who find a position within three years.
In addition, recognizing that most PhD students will not become professors, departments should actively support transitions into nonacademic careers. Support may include job counseling, networking advice, and industry internships. Nonacademic placements are not necessarily a problem to solve—especially if departments are transparent about student outcomes. My colleagues who left academia have gone on to successful careers and do not regret their decisions. This also appears to be true more broadly. In a survey of political science PhDs 10 years after completing their degrees, 77.8% of those who left academia did not regret completing it and would do it over again. Another 11% would still earn a PhD—but in another field. Furthermore, those who did not find an academic position and became managers or executives reported slightly higher job satisfaction than tenured faculty (Main, Prenovitz, and Ehrenberg Reference Main, Prenovitz and Ehrenberg2019; Nerad and Cerny Reference Nerad and Cerny2003).
I offer two final points. First, I suggest caution when interpreting these patterns. These findings reflect a snapshot of a single job-market cycle and do not capture multiyear searches or longer-term career-development paths. In addition, results presented herein are not causally identified and are subject to many possible interpretations. Publishing may increase the probability of placement, or it simply may be correlated with dissertation quality. Differential placement rates across identities may reflect discrimination, mismeasurement, stronger students, or disproportionate selection into high-demand subfields. There was a lack of independence between observations since only one candidate may occupy each available position. Measurement relies on candidates’ self-presentation rather than a careful read of dissertations and recommendation letters. These are only a few of the issues with this data, and this audience should be well aware of the limitations of this type of analysis.
Second, and perhaps most important, other factors are not included in the analysis, and the models presented in this study explain only a small part of job-market outcomes. The analysis lacks measures of dissertation quality, presentation skill, and strength of recommendations, among other things. This undoubtedly explains why the overall explanatory power of the models generally is low. Some of the excluded variables are under the control of graduate students themselves, and their agency in this process should not be overlooked.
It is indeed difficult to find a permanent position and the number of these positions is declining. However, departmental rankings are only part of the story behind career outcomes.
SUPPLEMENTARY MATERIAL
To view supplementary material for this article, please visit http://doi.org/10.1017/S1049096526102182.
ACKNOWLEDGMENTS
I thank Bruno Hoepers, Michael Joseph, Amie Kreppel, Umberto Mignozetti, Daniel O’Neil, and Seth Hill for helpful suggestions and Lucas de Carvalho de Amorim, Annika Dengel, and Nam Nguyen for excellent research assistance.
DATA AVAILABILITY STATEMENT
Research documentation and data that support the findings of this study are openly available at the PS: Political Science & Politics Harvard Dataverse at https://doi.org/10.7910/DVN/FHNKUL. The replication dataset has been deidentified. Please contact the author to request an identified copy of the dataset.
CONFLICTS OF INTEREST
The author declares that there are no ethical issues or conflicts of interest in this research.







 Open access

