


1. Introduction
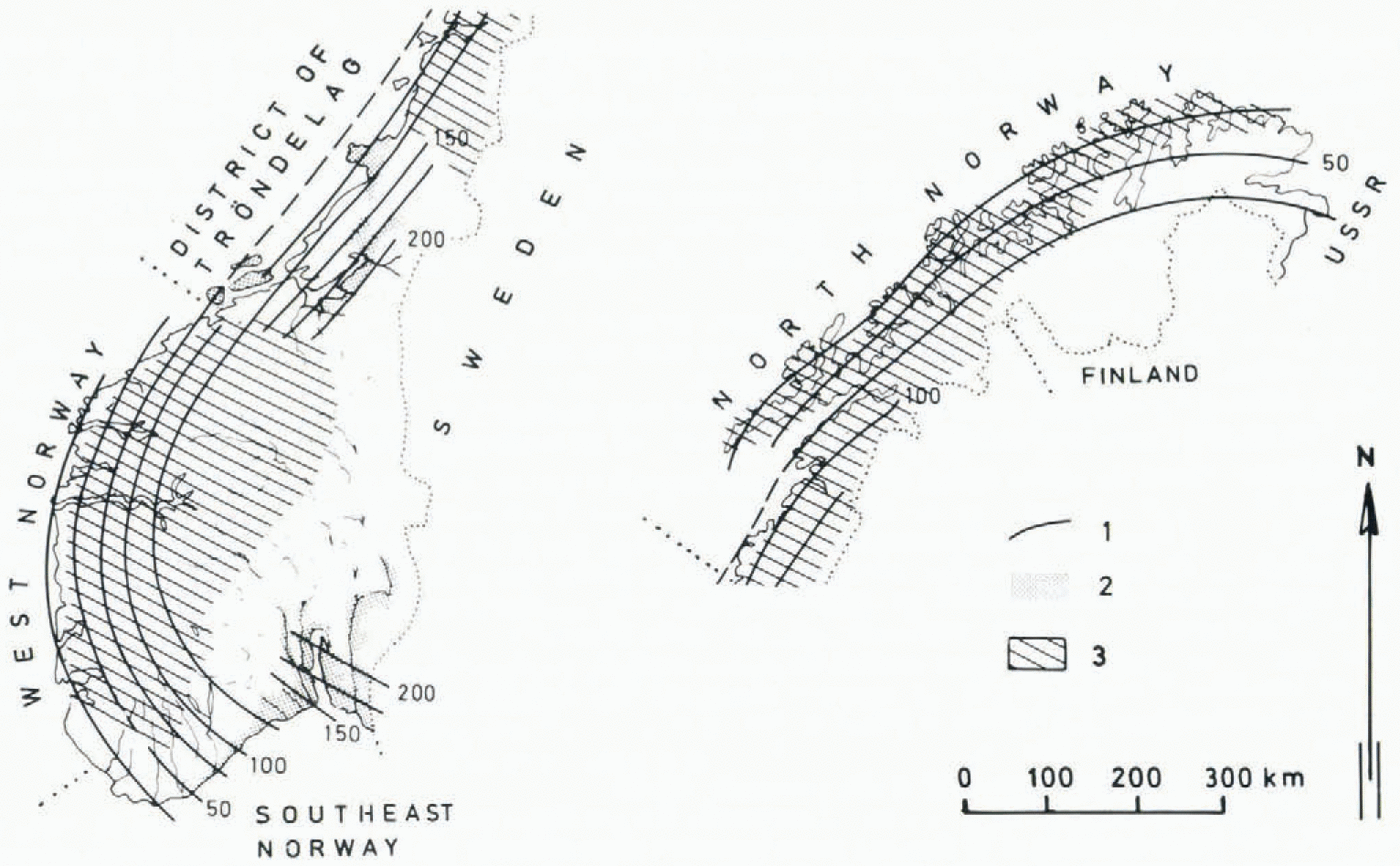
Narrow valleys and steep mountain slopes and cliffs are common topography in Norway, and landslides and avalanches are relatively common phenomena especially in the fjord and valley districts in western and northern Norway (Fig. 1). During the last decade it has become common practice to plan housing in concentrated building areas. At the same time these areas have been increased towards the valley sides, due to the desire to preserve arable land. As a result, housing is subjected to an increasing slide and avalanche risk.
Not only the mountainous parts of Norway exhibit slide danger to housing. On the flat lowland areas of eastern Norway and Trøndelag, quick-clay slides may occur in marine deposits, which are located up to 220 m above sea-level due to the isostatic uplift after the ice age (Fig. 1).
Main areas of Norway exposed to natural hazards. (1) Isobases showing heights of the marine limit (m a.s.l). (2) Main areas of marine deposits. (3) Fjord and valley districts.
The Norwegian National Building Code states: “Ground can only be built on if there is sufficient safety against subsidence, inundation, landslides, etc.’’ This implies that areas which are not obviously safe should be regarded as insecure until an evaluation of natural hazards has been accomplished. This again makes zoning necessary.
In Norway the governmental organization, National fund for Natural Disaster Assistance (NFNDA) is responsible for damage compensation and safety structures against natural hazards. This organization has been active in preventing development in areas which could be subjected to damage. The Norges Geotekniske Institutt (NGI) has been engaged by NFNDA to accomplish three pilot projects on natural hazard mapping.
The first project had a general character with three main purposes (Hestnes, unpublished [a]): (1) Elucidate problems connected with registration and mapping of terrain exposed to natural hazards. (2) Evaluate methods to define risk degree and boundaries for different types of hazard areas. (3) Suggest methods of natural-hazard zonation in Norway.
The second and third projects involve: zonation of dangerous marine deposits (Løken, unpublished [a], [b]) and zonation of areas subjected to other hazard types (Hestnes, unpublished [b]). The main purposes of these projects are: (1) Evaluation of professional and practical problems connected with the production of hazard-zoning maps, scale 1 : 50000. (2) Preparation of a schedule for future production of such maps.
An approach to these problems and the practical solutions are presented in this paper.
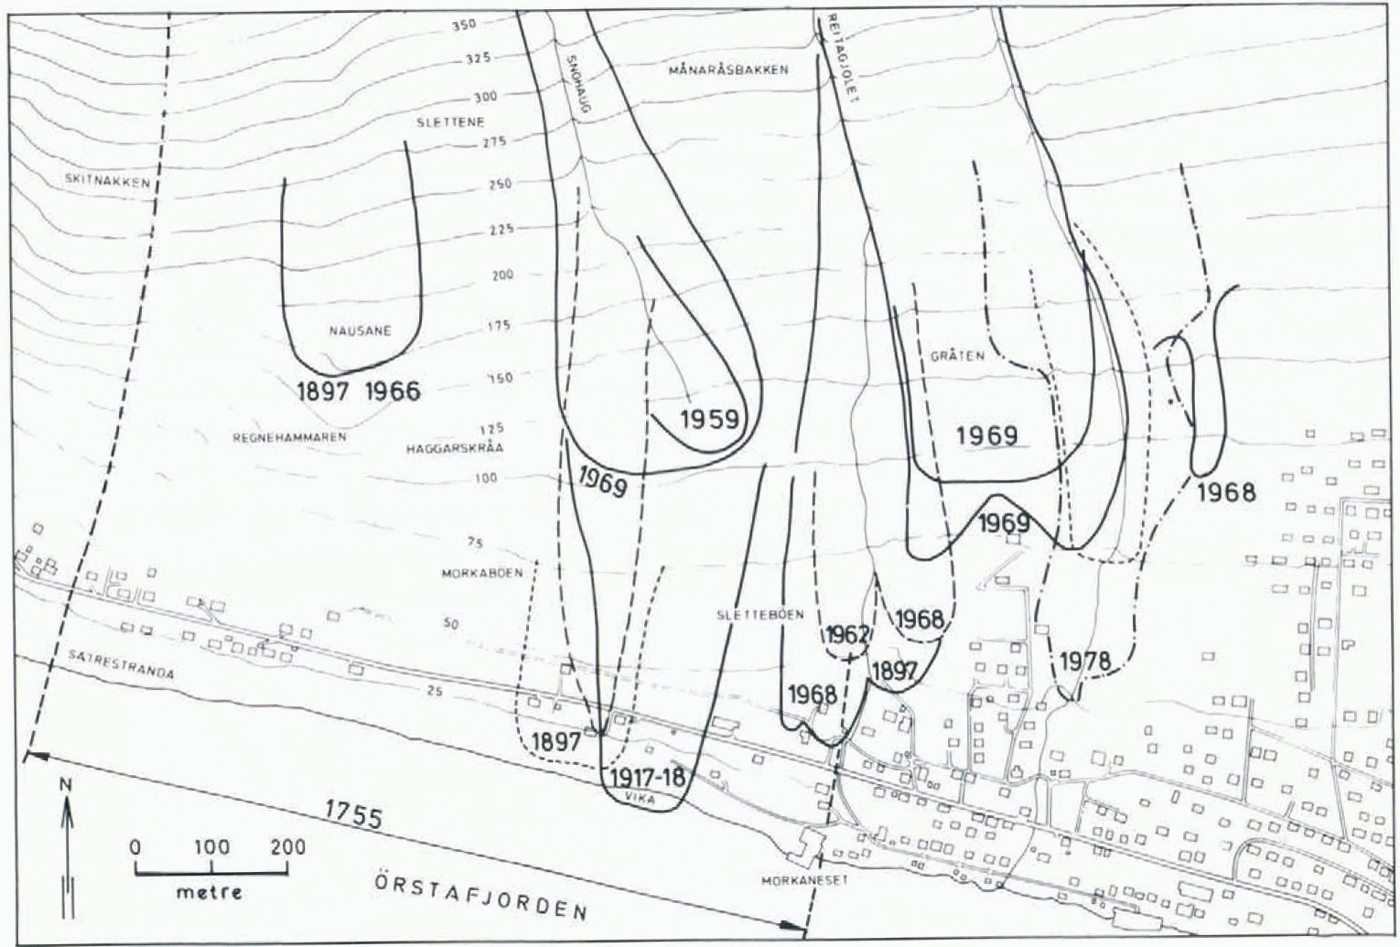
A section of a hazard-registration map (snow avalanches). The original map is at a scale of 1:5 000 with a contour interval of 5 m.
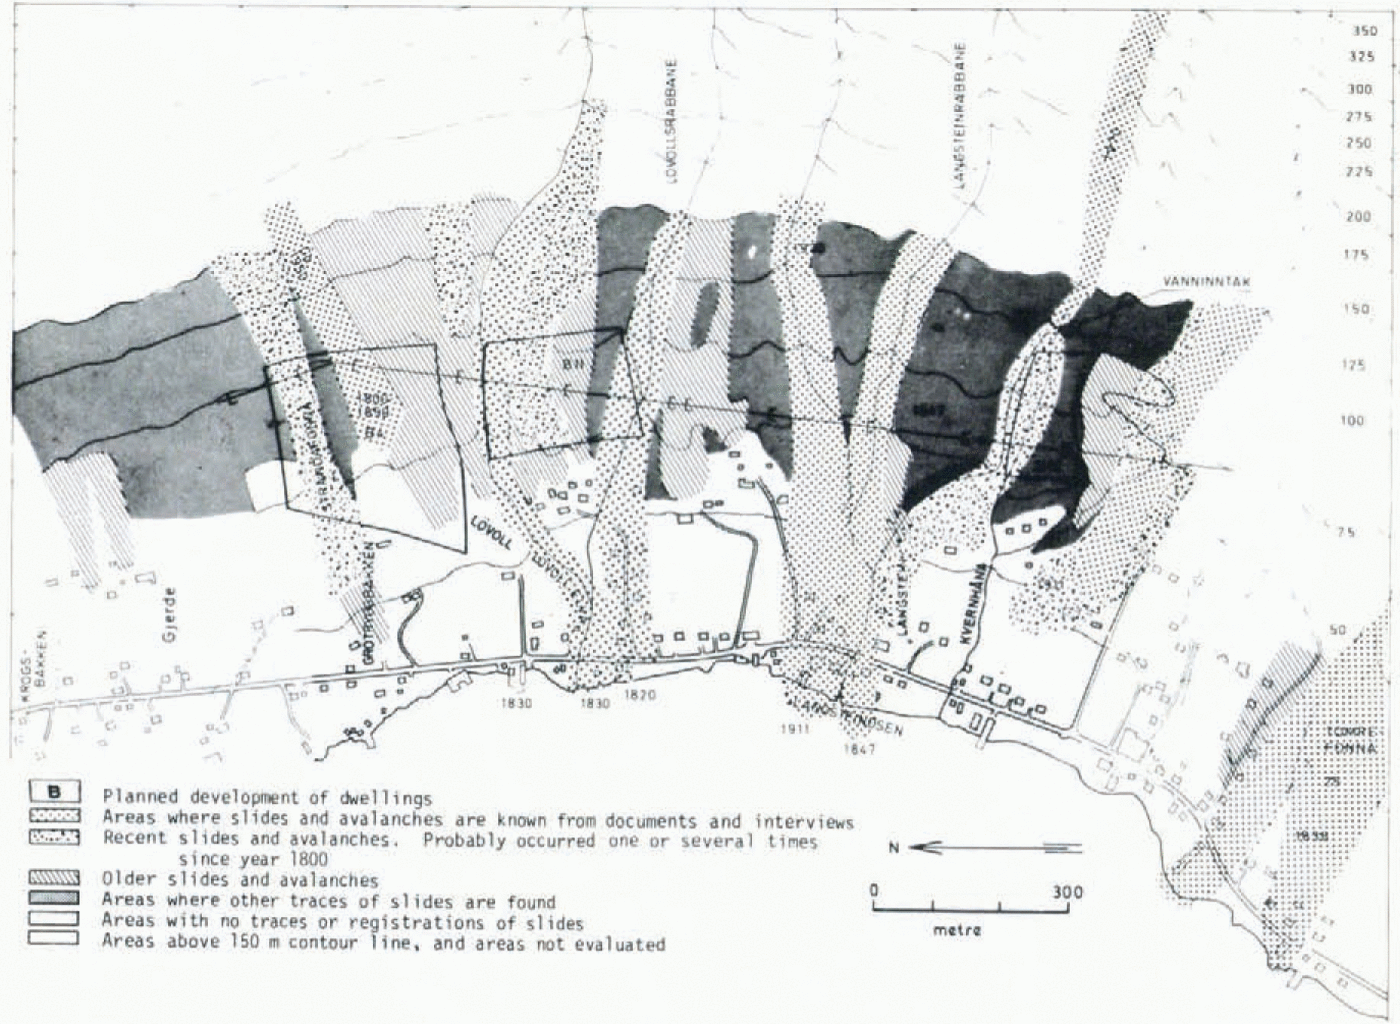
A section of a geomorphic hazard map. The original map is at a scale of 1:5000 with a contour interval of 5 m (Larsen, unpublished).
2. Definitions
2.1. Types of maps
Depending on map content and methods used in data collection and data processing, the Norges Geotekniske Institutt found it appropriate to distinguish between three types of natural-hazard maps (Hestnes, unpublished [a]):
Hazard-registration maps. Maps containing historically known slides and avalanches, compiled from literature and documents, interviews and field work (Fig. 2).
Geomorphic hazard maps. Maps including historically known slides and avalanches, and areas exposed to natural hazards identified by gcomorphological investigations (Fig. 3).
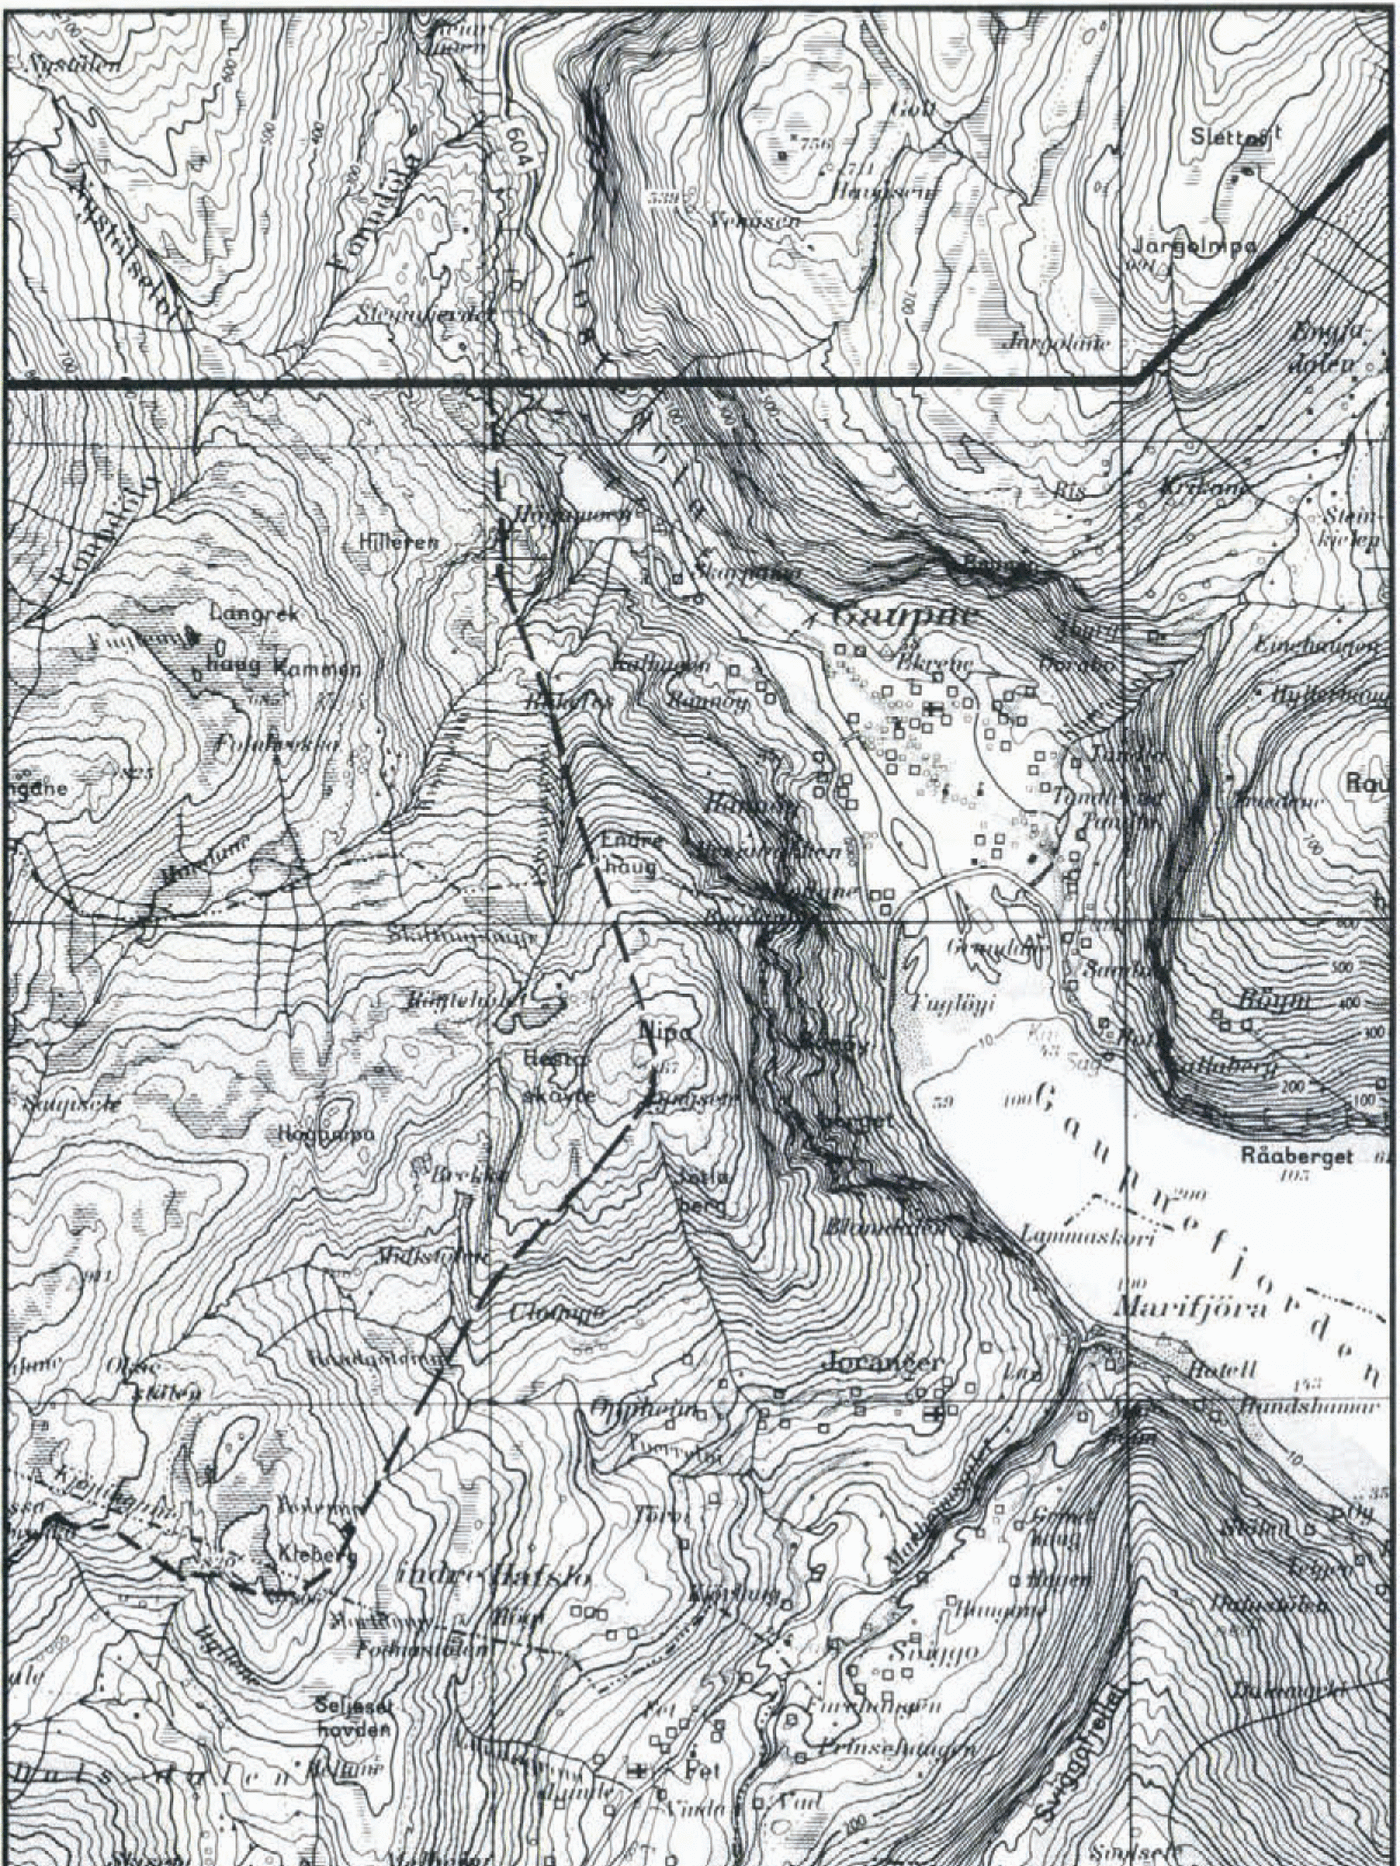
Hazard-zoning maps. Maps which show potential risk areas, compiled on the basis of geomorphological investigations and known historical events. Mathematical- statistical methods are applied to predict potential run-out zones (Fig. 4).
A section of a hazard-zoning map; the original is at a scale of 1: 50000 and in three colours. For the legend see Figure 8. (Printed by permission of the Norwegian Geographical Survey.)
2.2. Mapping standard
It is appropriate to distinguish between detailed maps and survey maps (Hestnes, unpublished [a], [b]).
Detailed maps should have a high degree of accuracy. These maps demand comprehensive field work and they are time-consuming to produce. They are based on the Norwegian economic map series at a scale of 1 : 5000 (Figs 2 and 3). In certain cases other scales may be used, for instance 1 : 1000.
Survey maps are meant to give general information of hazard risks and will cover a fairly large area in a short lime and at a low production cost. It is estimated that each map sheet at a scale of 1 : 50 000, which covers an area of c. 600 km2, should be evaluated in 4 weeks (150 h) (Fig. 4). The basic maps for this work are the national topographic map series (Series M711), compiled by the Norwegian Geographical Survey.
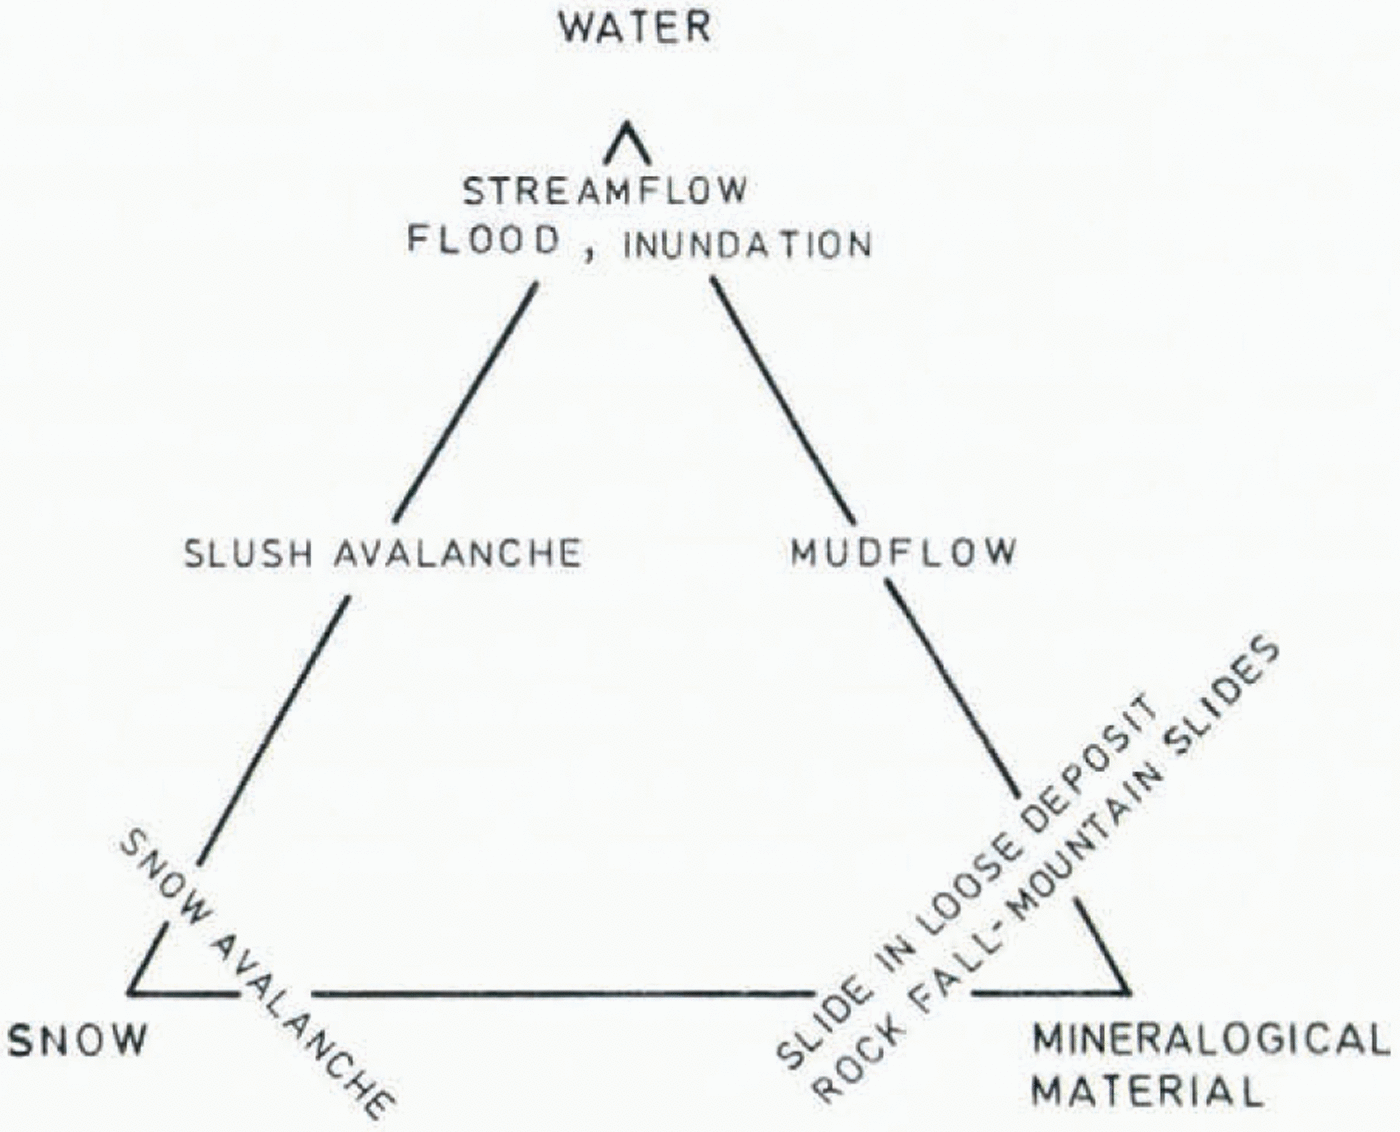
Classification of natural hazards (modified after Reference NoblesNobles (1966)).
2.3. The different hazard types
In Figure 5 natural hazards are classificated in main types based on their material content. However, in nature, one may find all kinds of transitional forms between the different hazard types. Slides and avalanches may also generate waves if they terminate in lakes or fjords and powerful air waves may be created by major snow avalanches and mountain slides.
The types of natural hazard which should be taken into account in the planning of housing areas are:
Snow avalanches, slush avalanches.
Rockfalls (<100 m3), rock slides, mountain slides (>10000 m3).
Slides in loose deposits: clay slides, submarine slides, slides in other loose deposits
Mudflows, inundations.
Waves generated in air by avalanches and slides.
Waves generated in water by avalanches and slides.
This classification is used by the Norges Geotekniske Institutt (Reference HestnesHestnes, 1979[a], [c]).
3. Selection of map type, map content and mapping standard
Hazard-zoning maps are the only type of hazard maps that include an estimate of potential risk areas. This means: predicts future natural-hazard activity and damage. The other maps mentioned in Section 2.1, hazard-registration maps and geomorphic hazard maps, give less information of the potential slide danger.
Hazard-zoning maps, which include as many hazard types as possible, have the greatest value. For planning and development, both detailed maps and survey maps may be useful.
4. Discussion
4.1. Principal problems concerning hazard-zoning maps
Optimally, boundary lines between areas of different risk levels should be drawn on hazard-zoning maps. Ideally, these boundaries should be based on mathematical and statistical methods in which all relevant field parameters are taken into account. The definitions of the hazard zones could then be based on what risk level the community is willing to accept. However, their nature is difficult to quantify, and exact criteria for rupture conditions, run-out distances, and so forth, are not available for the different hazard types. The hazardzoning maps are therefore based on mathematical-statistical models, combined with empirical and geomorphological knowledge.
The hazard types defined are more or less difficult to evaluate. Rockfalls, rock slides, and mountain slides, for instance, may occur whenever the angle of a mountain slope exceeds the angle of friction, which is difficult to quantify. Run-out distance of mountain slides also seems to increase with increasing slide volumes (Reference ScheideggerScheidegger, 1975).
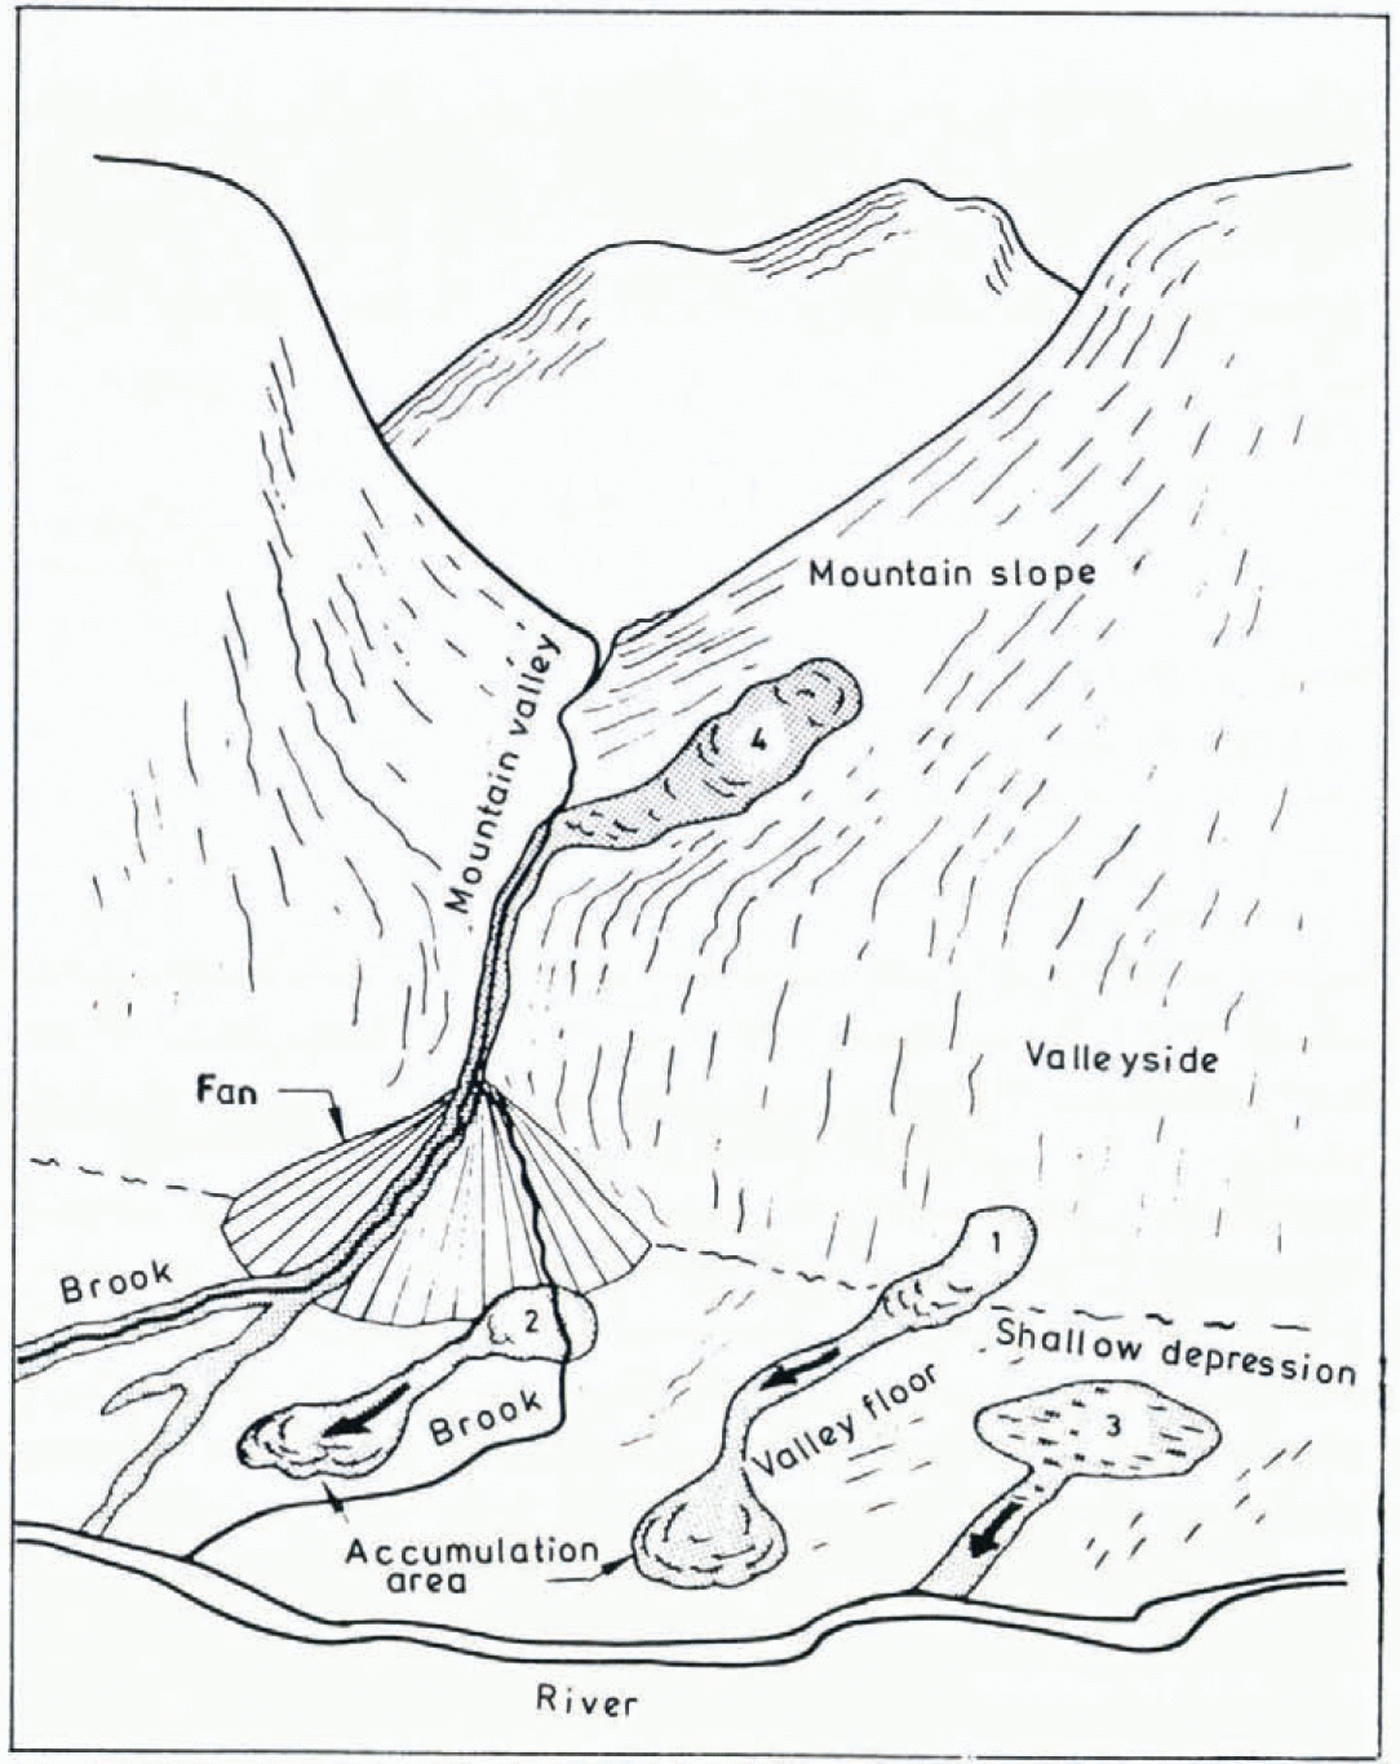
Slush avalanches may in certain cases start moving almost everywhere on sloping terrain. Consequently, risk areas for slush avalanches are difficult to identify (Fig. 6). A third hazard type which is difficult to identify is debris slides of different consistency, ranging from moraine material to block talus. Only in certain cases do older slides give information about these hazard types.
Concerning quick-clay slides, it is usually necessary to perform sounding, sampling, and laboratory tests to evaluate the slide risk. Such investigations are always costly and timeconsuming.
The possibility of mapping areas subject to inundation depends upon the existing information on topography and of river discharge.
Maximum wave heights generated by avalanches and slides are to a certain degree possible to calculate. On the other hand, it is almost impossible to predict the probability of mountain slides, and consequently there is little possibility of taking into account the risk and consequences of potential mountain slides in hazard zoning.
The above-mentioned aspects indicate the limitations in the value and usefulness of the hazard-zoning maps. However, the advantage of hazard-zoning maps is obviously higher than of registration maps and geomorphic maps, which only include incidents that have occurred.
Hazard maps should comprise a description of the limitations of the maps, what kinds of natural hazards are treated, and the accuracy of the zone boundaries (Hestnes, unpublished [b]).
4.2. Discussion of risk level
In land-use planning it would be unrealistic to guarantee 100% safety against avalanches and slides. Especially in the narrow valleys and fjord districts of western and northern Norway, such an aim would be too costly, because housing would then have to be kept far away from all kinds of slopes, and most of the arable land would have to be occupied by (Fig.6.)buildings. All activities include some risk, and some risk from natural hazards also have to be accepted.
Starting zones of slush avalanches.
How safe housing areas should be is a political question, and the authorities have to decide the risk level which should be accepted. The role of the experts on natural hazards is limited to quantifying the degree of danger (Reference LiedLied, 1979). It is important that both the authorities and the experts respect this.
Acceptable risk level for housing areas should be evaluated by comparison with other types of social risk. The average probability of being killed by natural hazards in Norway is about 3–10-6 per year. Fatal risk in fires is about 1.25–1o-5 and the average risk for all kinds of fatal accidents is 5–10-4(Reference Jenssen and SandeJenssen and Sande, 1973).
Based on accident statistics, Reference StarrStarr (1969) has proposed a general international standard of acceptable annual risk level of about 1–10-6 concerning “planned activities”. (Death risk per hour is less or equal to 1–10-10.) The proposed highest tolerable risk level for dwelling houses in Norway is 3–10-3 per year (Reference LyngLyng, 1979). Our accident statistics show that five to ten houses are destroyed for every person killed in a house by snow avalanches. This corresponds to a personal death risk of 6–10-4 to 3–10-4 per year. The difference between this risk level and 1–10-6 proposed by Starr for “planned activities” is considerable. However, in certain districts of Norway it would be impossible to find suitable development areas which satisfy that high degree of safety which corresponds to the “1000000 year” avalanche.
5. Current zoning situation
For many years, different types of hazard mapping and registration have been carried out, especially for snow avalanches and quick-clay slides (Reference RamsliRamsli, 1953, unpublished; Reference BjerrumBjerrum, 1971; Reference HestnesHestnes, 1979[b]; Haug, unpublished; Hutchinson and Jørstad, unpublished; Lied, unpublished; Rye, unpublished).
About 1000 snow-avalanche paths are recorded in detail on maps at scales of 1 : 50000 and 1 : 5000, and about 2000 on older topographic maps. All the avalanches are recorded to their known maximum extent. To some degree, other types of landslides are recorded in connection with certain projects. Traditionally, slides in marine deposits have been handled and mapped separately mainly because of professional and practical reasons (Fig. 1). This is also the case today, because the mapping of quick-clay hazards and other hazard types is treated by two independent project groups at NGI. A composite hazard-zoning map should be compiled where all hazard types appear within the same map sheet. In relation to other countries which experience natural-hazard problems, systematic mapping in Norway has been carried out to a small extent only.
1424 people were killed by natural hazards in Norway during the 100-year period 1871—1970. 55% of these lost their lives because of snow avalanches, slush avalanches, and air waves generated by snow avalanches. 175 people (12%) perished in waves generated by the mountain slides at Loen in 1905 and 1936, and Tafjord in 1934 (Reference JørstadJørstad, 1968). In the quick- clay slide at Verdalen in 1893, 112 people (8%) lost their lives. These statistics demonstrate that snow and slush avalanches are responsible for most of the death’s caused by avalanches and slides in Norway.
5.1. Survey mapping of marine deposits
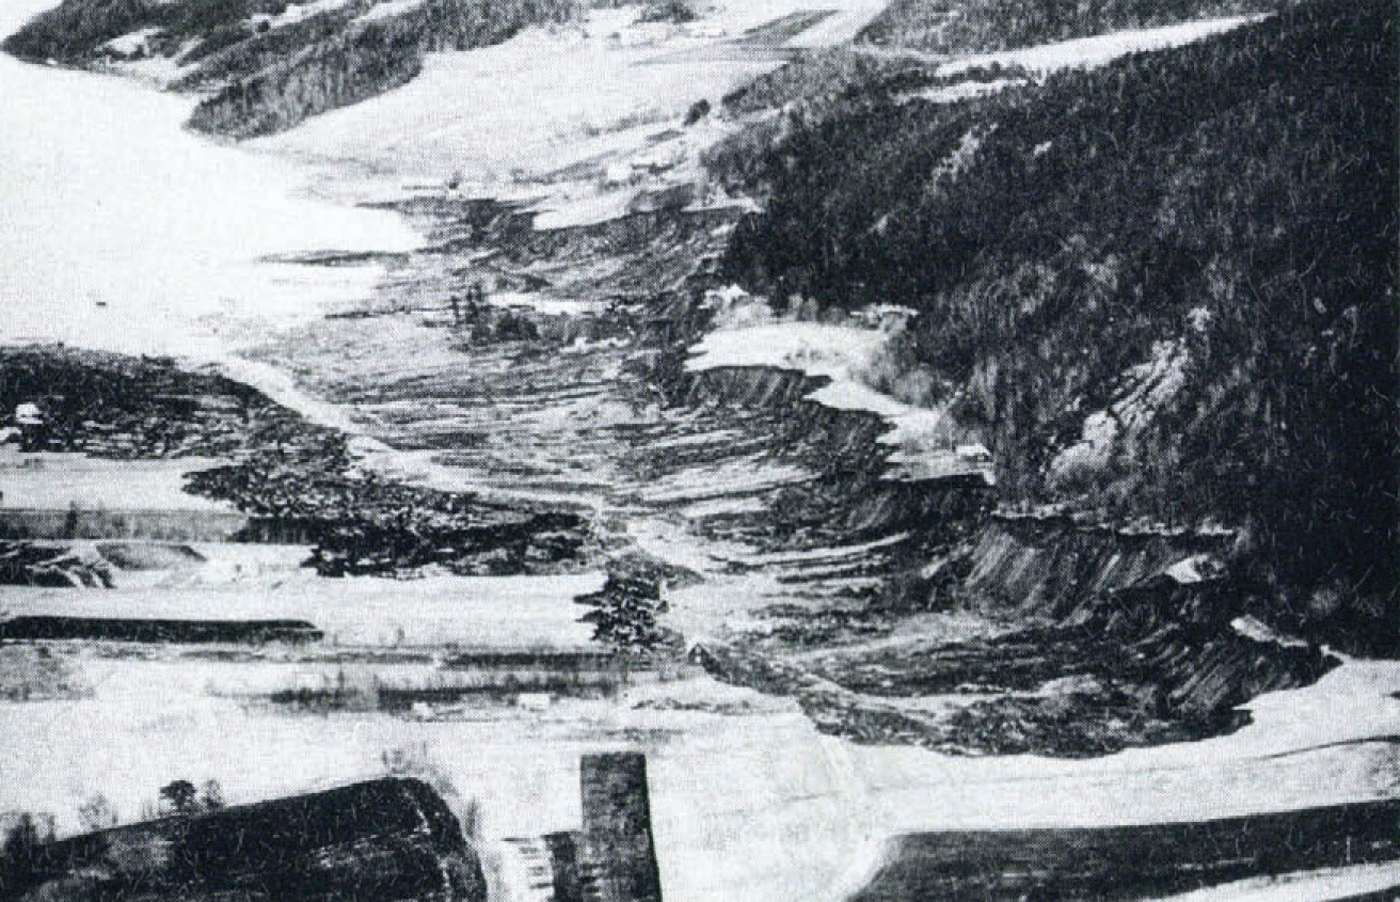
Methods of recording areas subject to quick-clay hazards were prepared in the period 1967-71 (Reference BjerrumBjerrum, 1971). The quick-clay slide at Rissa, Trøndelag, on 29 April 1978 emphasized the problems connected with such slides (Fig. 7).
A pilot project is planned to start in 1979-80. This will further elucidate the professional and practical problems connected with survey mapping (scale 1 : 50000), and establish criteria and guidelines for the future survey mapping (Løken, unpublished [a], [b]). The evaluation methods will mainly be based on: (1) Quaternary maps covering marine-clay deposits, (2) geomorphological interpretation of vertical air photographs at a scale of 1 : 20000 (infra-red photographs), (3) field investigations and (4) simple core drilling and soil testing.
The plan is to divide the marine-clay areas in two main groups:
Areas where development may be carried out without further investigations. Areas where light buildings may be constructed and where smaller fills and excavations can take place without geotechnical investigations. Quick-clay deposits may be present, but the topography is such that quick-clay slides will probably not occur.
Areas where investigations should be carried out before development starts. Areas where the topography implies that the collapse of ground may trigger quick-clay slides.
Directions for use that explain aim of map, content, and limitations, will also be discussed. Defining the exact boundary between safe and dangerous areas has to be undertaken by detailed mapping.
Quick-clay slide at Rissa, Trendelag, 29 April 1978. 33 ha of cultivated land disappeared. Length of slide 1 500 m. Seven farms and five dwellings were damaged or completely destroyed. Only one person was killed. (Photograph by Aften posten, 1978.)
5.2. Survey mapping of other hazard types
A method of mapping hazard types exclusive of slides in marine deposits was worked out by the NGI in 1978 (Hestnes, unpublished [b]). Experience from this project showed that if a survey map were to be produced in 150 h of work the mapping must be based mainly on interpretation of air photographs and topographic maps (Section 2.2). Air-photograph interpretation is most conveniently done by using the instrument Interpretoshop B (Carl Zeiss, Jena, Germany (DDR)).
The main principle of the mapping is the evaluation of potential hazard zones, based on terrain gradient and topographic formations (Reference Lied and BakkehøiLied and Bakkehøi, 1980; Reference HestnesHestnes, 1979[c], unpublished [b]). Field work and the use of historical documents should be kept to a minimum. It is underlined that this type of survey map does not give information on the real danger but of potential danger only. The exact boundaries of the hazard zones must be evaluated by detailed mapping.
It was further concluded that the only hazard types which could be identified by this type of mapping are the potential danger of rockfalls, rock slides, and snow avalanches. Other hazard types have to be defined as “not investigated”. However, quite obviously risks of the other hazard types will have to be taken into account.
It is not possible to guarantee absolute safety against rockfalls, rock slides, and snow avalanches outside the hazard zone. The map scale, technical aids and time at disposal are limiting factors. Usually, cliffs and slopes lower than 10 m and with a horizontal extent of less than 30-50 m are impossible to identify on air photographs and mark off on the maps. An uncertainty of ±50 m must also be considered when information is transferred from the air photographs to the maps.
Based on the results from this project, it is proposed that the survey map should include the following four types of areas:
i Areas where developments may be undertaken without further investigations.
ii Areas where investigations should be carried out before development starts.
iii Areas which are supposed to be without developmental interest.
iv Areas not evaluated,
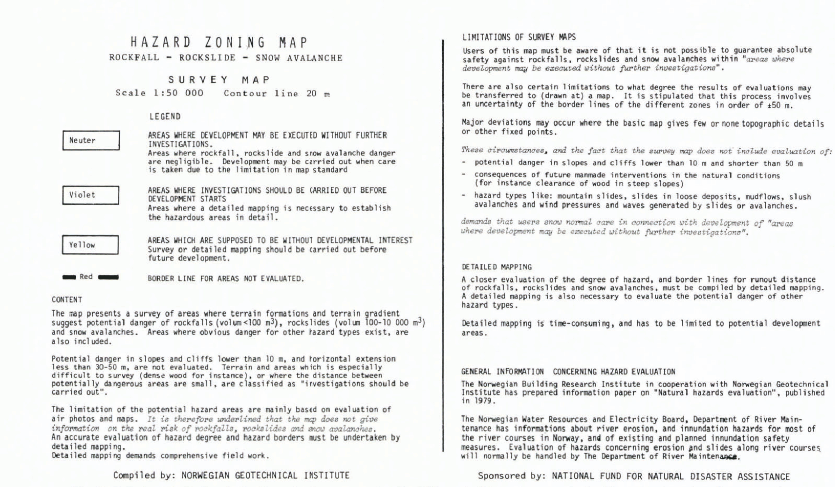
A section of a map of this type is given in Figure 4 and a preliminary draft of user’s directions is shown in Figure 8.
5.3. Detailed mapping of marine deposits
Sampling and soil testing are necessary to establish the location and extent of hazard zones, and the relative danger of different parts of an area. Guidelines for detailed mapping have not yet been worked out.
The geotechnical investigations in connection with detailed mapping might be done by private consultant companies or the municipal technical service. Sometimes it might be more economic to carry out stabilizing improvements directly instead of undertaking timeconsuming investigations.
Submarine slides occur because of structural collapse in loose deposits of fine sand or coarse silt, and in weakly consolidated clay deposits. The possibility of a satisfactory hazard evaluation is limited for such slides, but some idea of the potential danger may be gained by boring, acoustic profiling, the use of explosives, and investigations of mass content and porosity (Reference KarlsrudKarlsrud, 1979).
5.4. Detailed mapping of other hazard types
At present the following routines for detailed hazard zoning are used at the NGI (Reference HestnesHestnes, 1979[b], unpublished [a]): (1) Systematic collection of data concerning avalanche and slide frequency, and earlier run-out distances, based on interviews and documents (Fig. 2). (2) Geomorphological recording of slide and avalanche activity, deposits, tracks, and rupture conditions (Fig. 3). (3) Geomorphological investigations with the intention of predicting future avalanche and slide activity. (4) Evaluation of avalanche frequency, maximum run-out, and consequences of potential hazards based on collected material and climatic data. (5) Calculation of run-out distance based on mathematical-statistical criteria if possible.
By using these routines, it should be possible to evaluate the relative degrees of hazard between the different hazard types within an investigated area.
As long as the exact criteria for the calculation of run-out distance and frequency are not available, the calculation methods have to be supplemented by subjective judgements based on personal experience.
The main aim in detailed mapping is to establish hazard zones with a high degree of accuracy. To do this, we have to discuss how to define the degree of hazard based on a consequence analysis of the different hazard types. An intensified research programme on avalanche run-out and rupture conditions is also needed.
Detailed maps, which take account of all kinds of hazard and record accurate zones for different risk levels, will probably never be possible to construct.
6. Future zoning programme
The political authorities have not given any standards for tolerable risk level against natural hazards. Based on the Norwegian National Building Code, it is the local municipality boards which decide what should be accepted. However, a new national regulation is planned which specifies a highest tolerable risk level for buildings equal to 3–10-3 per year (Section 4.2).
Preliminary draft of user's directions printed on survey maps of rockfalls, rock slides, and snow avalanches (hazard-zoning map, scale 1: 50000).
The introduction of these quantitative regulations means that a first step in hazard zonation in principle has to be based on these criteria. However, it is beyond doubt that in most cases it will be impossible to evaluate a boundary line with exactly the degree of hazard. On the other hand, most parts of an investigated area dearly will either be safer or more hazardous. The political authorities, therefore, will have a better chance of making decisions concerning the development of areas. By these standards, the same degrees of hazard will be practised for the whole country.
6.1. Survey maps
On the basis of the pilot projects mentioned in Section 1, the National Fund for Natural Disaster Assistance, in co-operation with the Norges Geotekniske Institutt, has planned two series of survey maps. NFNDA’s goal is that these series should be an aid in municipal development.
When the methods and classifications for survey mapping of marine deposits are clarified, 80% of these areas will be evaluated in 5 years (1980-84). The last 20% are spread all over the country. Rational surveying of these areas will be difficult and might require special methods (Løken, unpublished [a], [b]).
The methods for survey mapping of rockfalls, rock slides and snow avalanches have been mentioned in Section 5.2. The National Fund for Natural Disaster Assistance has requested that one-third of the country (120000 km2) should be mapped within 10 years. The most hazardous parts of the country will have first priority.
6.2. Detailed maps
In the last few years there has been a rising demand for detailed hazard-zoning maps from local communities and other authorities. It is presumed that the need for such maps will increase in the future. It is also believed that the survey maps themselves will create an accelerating demand for detailed studies in connection with development.
Detailed mapping of marine deposits potentially exposed to sliding could be limited to “areas where investigations should be carried out before development starts” (Section 5.1).
The limitations of the survey maps of rockfalls, rock slides, and snow avalanches, demonstrate, however, that detailed hazard zoning in these maps requires that no areas are excluded.



