Implications
The results of our study confirm that the interconnectedness of farm variables is very complex and highly farm specific. Farmers and advisors need a profound understanding of the characteristics of and the driving forces within the respective farm to translate their knowledge into on-farm application and support herd health-related decision making. Graph-based impact analysis has the potential to support this understanding by considering direct and indirect relationships and identifying the most important levers in a farm. Using this method, farm advisors could improve their advice by suggesting management measures that are most likely to have the desired effect in the farm context.
Introduction
Production diseases, such as mastitis, lameness and metabolic disease, are major problems in conventional and organic dairy farms alike (Hovi et al., Reference Hovi, Sundrum and Thamsborg2003; LeBlanc et al., Reference LeBlanc, Lissemore, Kelton, Duffield and Leslie2006). They are a risk for organic dairy farms in particular by posing a threat to their image, which promises good animal health (International Federation of Organic Agriculture Movements, 2006; Hughner et al., Reference Hughner, McDonagh, Prothero, Shultz and Stanton2007). Improvements are crucial in both organic and conventional farms and must be achieved by targeted management actions because production diseases are primarily caused or amplified by management factors (Nir, Reference Nir2003).
Decisions made and actions taken by farmers are based on their understanding of the farm, in particular on their understanding of the (underlying) relationships between farm components. Such relationships are not easily understood as a farm is a complex system consisting of numerous factors (or variables) and a vast number of interactions between them (Dillon, Reference Dillon1992). System modelling can help to disentangle this complexity and identify levers expected to improve animal health on the farm level by linking technical and biological information with knowledge of farmers’ decisions and practices (Béranger and Vissac, Reference Béranger and Vissac1994). By integrating social and ecological aspects, systemic approaches acknowledge, in particular, the interdependency of farm, farmer and context (Darnhofer et al., Reference Darnhofer, Lamine, Strauss and Navarrete2016). With respect to animal health planning, this means improvement measures are selected not solely in terms of their technical appropriateness, but in terms of their conformity to the behaviour, goals, needs and socio-economic circumstances of the targeted farm as well (Sands, Reference Sands1986). Although the farmer as final decision-maker is central to animal health management, often veterinarians and advisors are also strongly involved (Vaarst et al., Reference Vaarst, Winckler, Roderick, Smolders, Ivemeyer, Brinkman, Mejdell, Whistance, Nicholar, Walkenhorst, Leeb, March, Henriksen, Stöger, Gratzer, Hansen and Hubner2011). Therefore, all of them need a profound understanding of the dairy farm as an integrated system to be able to translate their knowledge into on-farm application (Kristensen and Jakobsen, Reference Kristensen and Jakobsen2011). Quite a number of different livestock farming systems approaches have been described in the literature (Gibon et al., Reference Gibon, Sibbald, Flamant, Lhoste, Revilla, Rubino and Sørensen1999). However, only a few of them focus on the complex relationships between farm variables and incorporate a stakeholder perspective as well.
Hoischen-Taubner and Sundrum (Reference Hoischen-Taubner and Sundrum2012), to our knowledge, were the first to apply a relational approach in the context of animal health, studying interdependencies between factors in organic pig farms by means of an impact analysis. Impact analysis is a generic term for studying the potential impacts a given change would have on a system. The impact (or cross-impact) analysis applied was mainly based on two techniques that were developed for the assessment of relationships between variables within a system, namely the MICMAC method and the Network Thinking method. Both methods use an impact matrix, where scores are inserted based on people’s knowledge and which is evaluated mathematically to arrive at graphical representations. They are characterised by different qualities. The Network Thinking method considers impact strengths but only of direct impacts (Vester, Reference Vester2007), whereas MICMAC neglects the strengths of impacts but assesses indirect impacts through matrix multiplication (Godet, Reference Godet1979). Linss and Fried (Reference Linss and Fried2009) attempted to integrate both qualities by developing the ADVIAN method. This method, by multiplying matrices that contain impact strengths (values higher than 1), tends to overestimate indirect impacts, which is why we see the need for a more advanced method. Our aims were to (i) develop the impact analysis further in order to consider both impact strengths and indirect relationships between farm factors, and (ii) based on the knowledge of farmers, veterinarians and advisors identify variables related to production diseases on the farm level.
Material and methods
Farms
Farms were recruited through advisors involved in the project in France and Germany, and by phone or mail in Spain and Sweden (for more details see van Soest et al., Reference van Soest, Mourits and Hogeveen2015). A total of 54 French, 60 German, 23 Spanish and 55 Swedish organic dairy farms participated. The median herd size was 60 cows with herds largest in Sweden (104 dairy cows) and smallest in Spain (45 dairy cows). Milk performance was 6886 kg energy-corrected milk per cow and year (median) and corresponded with herd size; Swedish farms had the highest milk yield (8979 kg) and Spanish farms had the lowest milk yield (5742 kg). Cows were mainly kept in loose housing (93%) with access to pasture (92%). For a more detailed description of the sample see Krieger et al. (Reference Krieger, Hoischen-Taubner, Emanuelson, Blanco-Penedo, de Joybert, Duval, Sjöström, Jones and Sundrum2017b).
Impact analysis
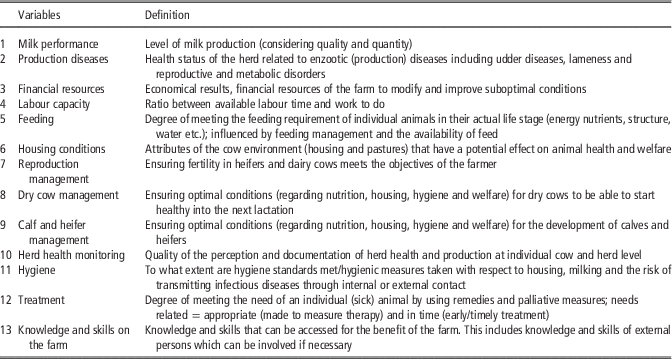
A set of variables related to animal health on the farm level was developed within a multidisciplinary framework, involving stakeholder workshops in all participating countries, and tested in two pilot farm visits before the actual assessments. The final set, as shown in Table 1, enlisted 13 variables and was applied in all farms. The relationships between all pairs of variables in each farm were assessed during on-farm round-table discussions between farmer, veterinarian and advisor that were facilitated by a trained researcher. Impacts were scored with 0 (no obvious influence), 1 (weak influence), 2 (medium influence) or 3 (strong influence), and inserted in a matrix, whereby variables, by definition, could have no impact on themselves. The definition of variables and the on-farm application of the impact matrix are described in more detail by Krieger et al. (Reference Krieger, Sjöström, Blanco-Penedo, Madouasse, Duval, Bareille, Fourichon, Sundrum and Emanuelson2017a).
List of farm variables

Graphs
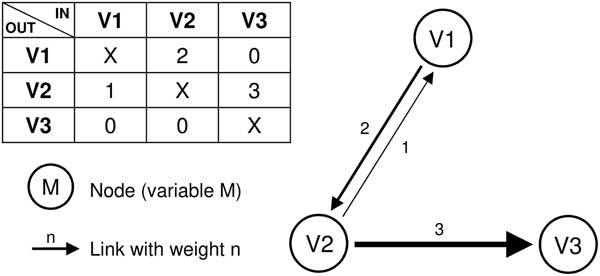
Similar to the procedure described by Brand (Reference Brand2013), weighted, directed graphs were created for all farms based on their impact matrices using Mathematica (Wolfram Research, 2015). Thereby variables were regarded as nodes and cell values as links (Figure 1), and it was made sure that in case of an existing impact between two variables (cell value>0) its strength (1 to 3) was considered. Nodes in the graph are positioned automatically depending on the number of outgoing (out-degree) and incoming links (in-degree), disregarding strength, and according to aesthetic criteria (minimal edge crossing and even spacing between vertices). Thus, the most integrated variables inherit central positions, whereas variables with few links, that is a low total degree, are placed in the periphery.
Example of an impact matrix and the according graph; variables V1, V2 and V3 are displayed as nodes and impacts as arrows (directed links).

Paths
In graph theory, a path is a sequence of links which connect a sequence of nodes which are all distinct from one another (Gross and Yellen, Reference Gross and Yellen2004). By this definition paths are never loops and do not contain loops. Paths between pairs of variables were evaluated on farm level by specifying start and end nodes as well as the length(s) of the paths under investigation and applying a function that returns the number of specified paths in each graph. Path length in this study was restricted to a maximum of seven nodes (equals six links) due to restricted computing capacity. Path weight (or impact strength) was defined as the geometric mean of the individual weights (or strengths) of all links involved (Onnela et al., Reference Onnela, Saramäki, Kertész and Kaski2005).
Density was determined as an index of connectivity and calculated for all farms by dividing the number of links by the maximum number of possible links (Özesmi and Özesmi, Reference Özesmi and Özesmi2004). In order to assess the overall impact of variables within a farm the sum of the impact strengths of all their outgoing/incoming paths was computed. Relative values for comparing variables’ overall impact across different path lengths and across farms were obtained by assigning ranks and by computing the proportional impact of/on one variable using R (r-project.org). Variables were ranked on the farm level whereby the most influential (exerting most impact) or most influenced variable (receiving most impact) was assigned rank one. Ties (equal values) were replaced by their minimum. The distribution of ranks across farms was calculated for each variable and visualised as boxplots.
All variables’ outgoing and incoming impacts were further examined by determining impact shares. The proportional outgoing impact (PO) of one variable on another variable was computed by dividing its impact on that variable by its total outgoing impact. For example, if variable i had an impact of 2 on variable j and a total outgoing impact of 17, PO ij was 0.118. In contrast, the proportional incoming impact (PI) was defined as the share of one variable in all incoming impact of another variable. So, if variable j from the above example had a total incoming impact of 24, PI ij was 0.083. PO and PI were determined for all variable pairs on the farm level. In order to compare the most influencing and most influenced variables across farms, the median of all farms was used.
Results
Graphs
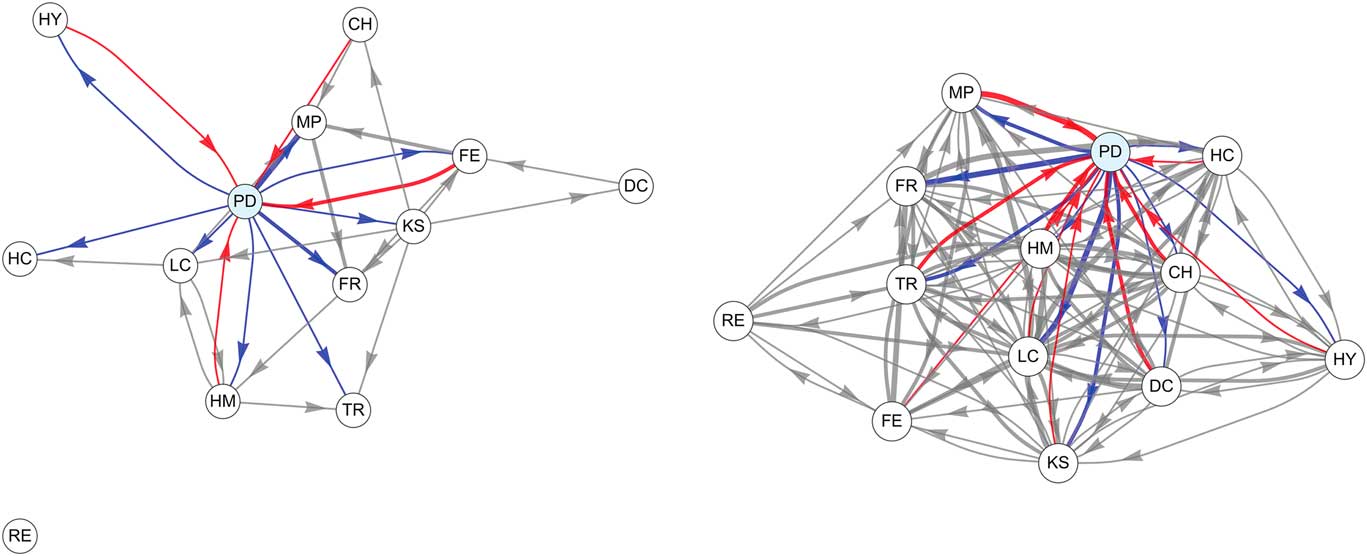
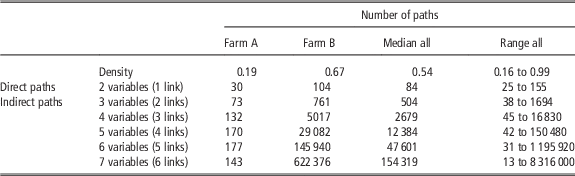
Graphs were created for all farms based on the pre-defined variables and impact matrix cell values. Two examples are displayed in Figure 2. Farm A is characterised by low density (0.19) and thus a lightly branched network, with the variable reproduction management being completely disconnected. The variable ‘production diseases’ has a central position and is most interlinked with a total degree of 13 (total number of outgoing and incoming links). Density, in comparison, was much higher in farm B (0.67). The variable ‘production diseases’, here, is also strongly integrated (total degree of 20), but central positions are inherited by the variables ‘herd health monitoring’ and ‘labour capacity’. The study farms varied widely in the number of identified interactions, that is density (see Table 2). With increasing path length the number of paths in a graph increases. Until a length of 6 the increase in farm A is almost linear, whereas it is more or less exponential in farm B.
Directed graphs of farms A (left) and B (right) with arrow thickness indicating impact strength; variable ‘production diseases’ (PD) is highlighted with outgoing (blue) and incoming links (red); other variables are ‘milk performance’ (MP), ‘financial resources’ (FR), ‘labour capacity’ (LC), ‘feeding’ (FE), ‘housing conditions’ (HC), ‘reproduction management’ (RE), ‘dry cow management’ (DC), ‘calf and heifer management’ (CH), ‘herd health monitoring’ (HM), ‘hygiene’ (HY), ‘treatment’ (TR) and ‘knowledge and skills’ (KS).

Density and numbers of paths of different length in farms A and B with median and range (min.–max.) of all farms (n=192)

Outgoing and incoming impacts
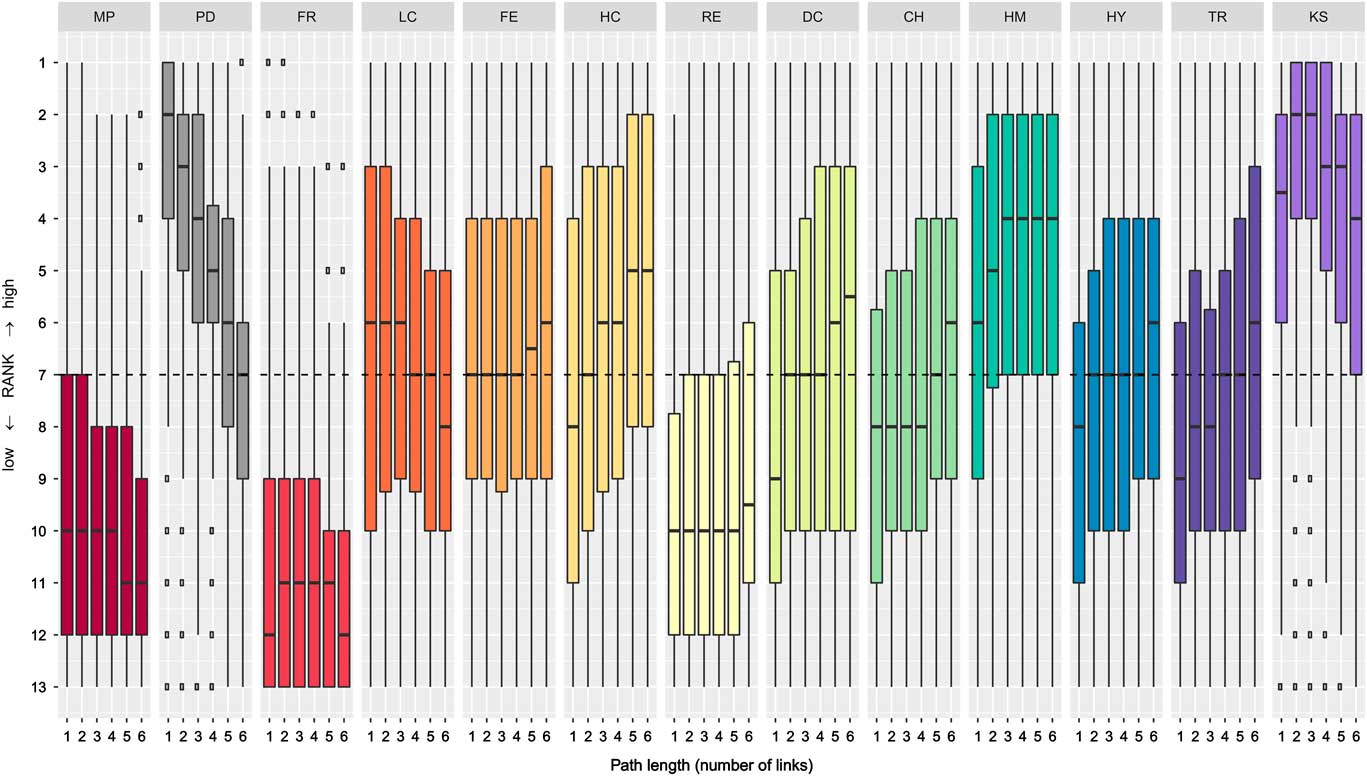
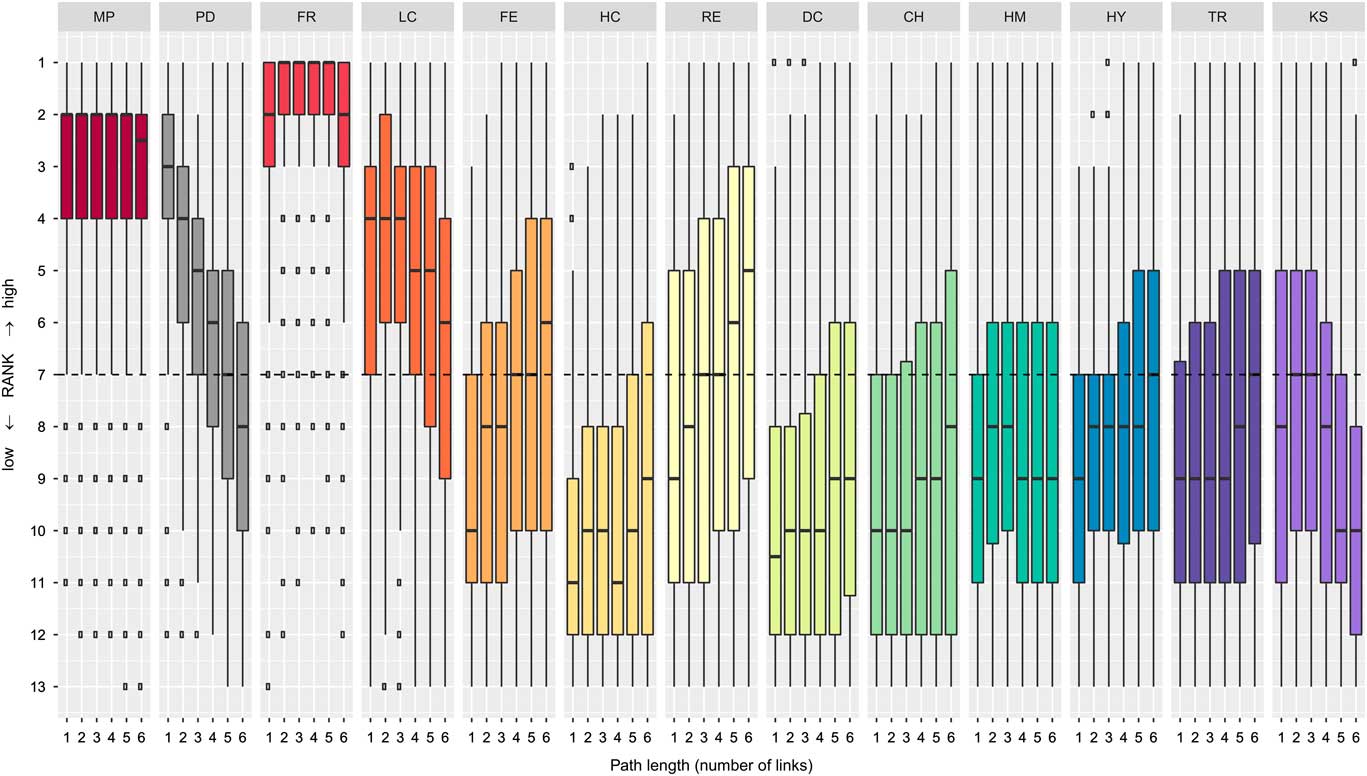
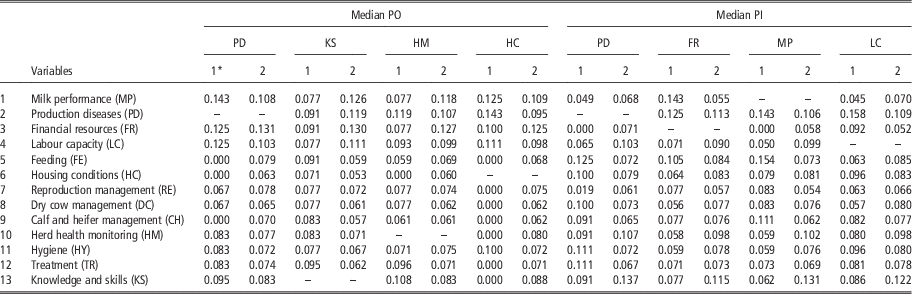
The boxplots present the rank distributions for the farm variables in terms of their outgoing (Figure 3) and incoming impacts (Figure 4) with increasing path length (for absolute values see Supplementary Table S1). Considering only direct impacts (path length 1), ‘production diseases’ was the most influential variable across all farms, reaching a median rank of 2, followed by ‘knowledge and skills’ with a median rank of 3.5 (Figure 3). The directly most influenced variables across farms were ‘financial resources’ and ‘milk performance’, both with a median rank of 2, followed by ‘production diseases’ and ‘labour capacity’ (Figure 4). With increasing path length, the relative importance of ‘production diseases’ as influencing variable declined, whereas other variables gained influence, for example ‘herd health monitoring’ and ‘housing conditions’ (Figure 3). A similar reduction in rank for ‘production diseases’ was observed with regard to incoming impacts (Figure 4). With increasing path length, ‘feeding’ and ‘reproduction management’ became more susceptible to influence although ‘milk performance’ and ‘financial resources’ remained the most highly ranked variables until length 6. On the farm level, rank changes with respect to both outgoing and incoming impacts occurred up until a length of 6, irrespective of the graph being weakly interconnected or very dense (see Supplementary Table S2). The extent to which variables’ ranks changed was highest between length 1 and 2 (median=1) and less when path length increased above 2 (median=0). The PO of the four most influencing variables and the PI of the four most influenced variables across farms was calculated until a path length of 6. Between one and two links values varied considerably, whereas consideration of paths longer than two links did not result in substantial changes. This is why Table 3 only displays proportional impacts until length 2.
Rank development with increasing path length of farm variables in terms of their outgoing impacts across farms (n=192); variables are ‘milk performance’ (MP), ‘production diseases’ (PD), ‘financial resources’ (FR), ‘labour capacity’ (LC), ‘feeding’ (FE), ‘housing conditions’ (HC), ‘reproduction management’ (RE), ‘dry cow management’ (DC), ‘calf and heifer management’ (CH), ‘herd health monitoring’ (HM), ‘hygiene’ (HY), ‘treatment’ (TR) and ‘knowledge and skills’ (KS).

Rank development with increasing path length of farm variables in terms of their incoming impacts across farms (n=192); variables are ‘milk performance’ (MP), ‘production diseases’ (PD), ‘financial resources’ (FR), ‘labour capacity’ (LC), ‘feeding’ (FE), ‘housing conditions’ (HC), ‘reproduction management’ (RE), ‘dry cow management’ (DC), ‘calf and heifer management’ (CH), ‘herd health monitoring’ (HM), ‘hygiene’ (HY), ‘treatment’ (TR) and ‘knowledge and skills’ (KS).

Proportional outgoing impact (PO) of the most influencing variables and proportional incoming impact (PI) of the most influenced variables expressed as median across farms (n=192) at different path lengths (1 to 2 links)

* Path length (number of links).
Most influencing variables
The four most influencing variables were ‘production diseases’, ‘knowledge and skills’, ‘herd health monitoring’ and ‘housing conditions’. A large proportion of the direct impact exerted by ‘production diseases’ went into ‘milk performance’, ‘financial resources’ and ‘labour capacity’. In sum, these three variables received an impact share of 0.375 (median of farm sums) which decreased slightly when only paths of length 2 were taken into account (0.344). ‘Feeding’, ‘housing conditions’ and ‘calf and heifer management’ were least directly influenced by ‘production diseases’ (median 0). With increasing path length their impact shares became less distinguished from the other variables reaching 0.079, 0.063 and 0.07, respectively. Considering direct impacts, ‘knowledge and skills’ affected ‘treatment’, ‘production diseases’, ‘financial resources’ and ‘feeding’ most. This changed considerably when indirect impacts were taken into account. ‘Feeding’ and ‘treatment’ were then replaced by ‘milk performance’ and ‘labour capacity’. ‘Herd health monitoring’ showed the greatest direct impact on ‘production diseases’, ‘knowledge and skills’, ‘treatment’ and ‘labour capacity’. At length 2, however, its main influence was on ‘financial resources’ (0.127) and ‘milk performance’ (0.118). The largest impact share of ‘housing conditions’ was exerted on ‘milk performance’, ‘production diseases’, ‘financial resources’ and ‘labour capacity’, both directly and indirectly. Via direct paths, ‘hygiene’ was also influenced by ‘housing conditions’ (0.1). The impact share, however, decreased significantly when indirect paths were considered (0.072).
Most influenced variables
The four most influenced variables were ‘production diseases’, ‘financial resources’, ‘milk performance’ and ‘labour capacity’. Variables with the highest direct impact share on ‘production diseases’ were ‘feeding’ (0.125), ‘hygiene’ and ‘treatment’ (both 0.111). Considering indirect impacts, however, ‘knowledge and skills’ (0.137), ‘herd health monitoring’ (0.107) and ‘labour capacity’ (0.103) had the highest proportional impact. Direct impacts on ‘financial resources’ originated from three variables in particular, that is ‘milk performance’, ‘production diseases’ and ‘feeding’. Indirectly most affecting were ‘knowledge and skills’, ‘production diseases’ and ‘herd health monitoring’. ‘Milk performance’ was directly most influenced by ‘feeding’, ‘production diseases’ and ‘calf and heifer management’. In terms of indirect influences ‘knowledge and skills’ dominated (0.131) followed by ‘production diseases’, ‘herd health monitoring’ and ‘labour capacity’. ‘Labour capacity’ was strongly influenced by ‘production diseases’, both directly and indirectly (0.158 and 0.109, respectively). ‘Housing conditions’ and ‘hygiene’ also directly affected ‘labour capacity’. More indirect effects on ‘labour capacity’ were exerted by ‘knowledge and skills’ and ‘herd health monitoring’.
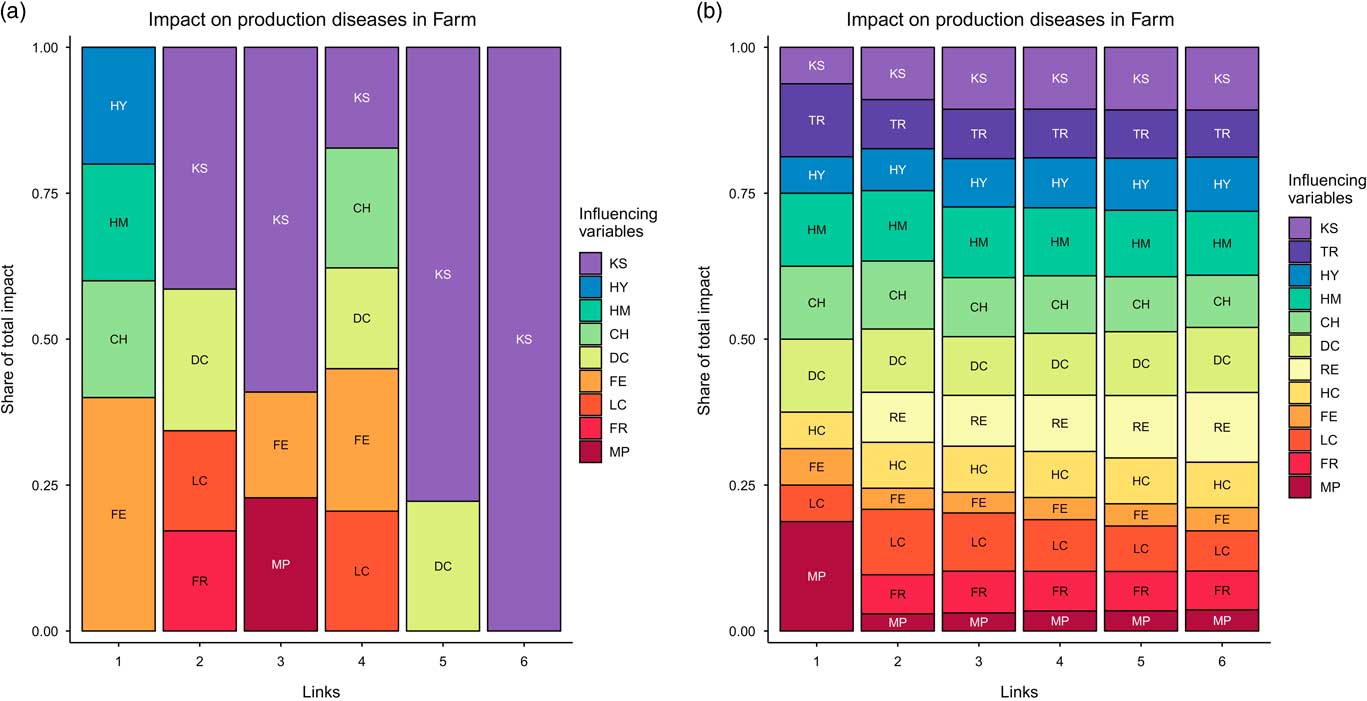
Changing PI of ‘production diseases’ with increasing path length in farms A and B (as in Figure 2) is depicted in Figure 5. Four variables exerted direct influence on ‘production diseases’ in farm A, namely ‘feeding’, ‘calf and heifer management’, ‘herd health monitoring’ and ‘hygiene’. Entirely different variables affected ‘production diseases’ via two links, that is ‘financial resources’, ‘labour capacity’, ‘dry cow management’ and ‘knowledge and skills’. ‘Housing conditions’, ‘reproduction management’ and ‘treatment’ had no impact on ‘production diseases’ whatsoever. In farm B, the variable ‘production diseases’ was directly influenced by all except two variables (‘financial resources’ and ‘reproduction management’) and indirectly by all variables, whereby impact shares varied considerably. ‘Knowledge and skills’ represented the most radiating variable in farm A and was estimated to have a large effect on ‘production diseases’. In farm B the picture was somewhat more heterogeneous. At 6 links the largest impact was expected from a combination of ‘knowledge and skills’, ‘herd health monitoring’, ‘dry cow management’ and ‘reproduction management’. All four variables together made up 44.6% of the influence working on ‘production diseases’ in that farm.
Proportional incoming impact of ‘production diseases’ in farm (a) and (b); variables are ‘milk performance’ (MP), ‘financial resources’ (FR), ‘labour capacity’ (LC), ‘feeding’ (FE), ‘housing conditions’ (HC), ‘reproduction management’ (RE), ‘dry cow management’ (DC), ‘calf and heifer management’ (CH), ‘herd health monitoring’ (HM), ‘hygiene’ (HY), ‘treatment’ (TR) and ‘knowledge and skills’ (KS).

Discussion
For the purpose of ranking variables according to their anticipated effect on production diseases on the farm level, impacts between a set of system variables were scored on the farm level. The scoring was done by practitioners who are familiar with the farm and knowledgeable in general mechanisms in organic dairy farming, that is farmers, veterinarians and herd advisors. This approach has several implications. For once, due to involvement of different observers, the estimation of potential impacts is not purely subjective but intersubjective, based on the knowledge of the participants and their agreement, and thus validated to a certain extent (Velmans, Reference Velmans1999). However, this still means that misconceptions and biases which were not eliminated by combining different perspectives are included in the models. Therefore, when interpreting the results of the performed graph-based impact analysis, it must be borne in mind that all identified influences are based on perceived correlations between variables.
An important aspect of the performed approach is that the farm-specific context is taken into account. This means that interrelationships are not scored based solely on general knowledge (‘feeding has an impact on milk performance’) but also the relevance of such knowledge for the specific farm (‘on this farm, a change in feeding would cause a change in milk performance’) is considered. The latter involves information on the farm conditions (current feeding management, current milk performance, potential for change, potential effects of change) which has a great effect on the estimated impacts and thus on the graphs produced by the impact matrix. The variability of impacts (caused by different farm conditions) is reflected in the graphs of different farms and is also seen in the variability of their variable ranking. Although the variable ‘knowledge and skills’ was highly influential in many farms, this being its general tendency, it also occupied the lower ranks in a distinct number of farms. This re-ranking of variables according to the farm context may be compared with the re-ranking of breeding traits because of genotype-environment interactions (Ismael et al., Reference Ismael, Strandberg, Berglund, Kargo, Fogh and Lovendahl2016).
The graph analysis applied in this study builds upon previous systems approaches while making progress by enabling the follow-up of actual paths. The focus on paths has several advantages. For once, it allows for the consideration of indirect impacts which are important characteristics of complex networks (Baldwin et al., Reference Baldwin, MacCormack and Rusnak2014). Our results show that the systemic role of variables can change substantially when indirect interactions are taken into account as compared with only considering direct impacts. As opposed to matrix multiplication which results in an overestimation of indirect impacts if strengths are included, we used the geometric mean of the impact strengths involved in a path which comes fairly close to impact behaviour in reality (Onnela et al., Reference Onnela, Saramäki, Kertész and Kaski2005). Second, the follow-up of paths is beneficial when dealing with system models where variables can be both dependent and independent (Barreto and Howland, Reference Barreto and Howland2006) for it allows the extraction of all paths where a chosen variable is the end node (dependent) and all paths where that same variable is the start node (independent). Evaluating paths, a lot can be learned about the behaviour of a particular variable in a system.
‘Production diseases’ was found to be a highly influencing and highly influenced variable across farms. The main reason for this is probably that the other 12 variables describing the system ‘organic dairy farm’ were selected in the context of reducing production diseases. Another reason may be that production diseases are persistent, also in organic dairy farming (Krieger et al., Reference Krieger, Hoischen-Taubner, Emanuelson, Blanco-Penedo, de Joybert, Duval, Sjöström, Jones and Sundrum2017b). The fact that the central variable (‘production diseases’) was strongly interlinked with the other variables does not lower the quality of the models and was also the case for core elements in comparable studies, for example ‘climatic change’ in the climate network by Vester (Reference Vester2007), and ‘agricultural expansion’ in the deforestation model by Kok (Reference Kok2009).
Most of ‘production diseases’ impact was exerted on ‘milk performance’, ‘financial resources’ and ‘labour capacity’ (directly and indirectly). Thus, reducing the prevalence of production diseases, in many farms, is expected to have an effect on factors that are closely related to economic success, that is production, income and labour (Huirne et al., Reference Huirne, Harsh and Dijkhuizen1997). It follows that even if reducing disease rates is not the primary farm goal, it may be a way of reaching other farm objectives. One specific characteristic of production diseases is that they emerge from the complex interactions between other farm factors (Sundrum, Reference Sundrum2014), which means they can only be changed indirectly via other variables. It is therefore no surprise that ‘production diseases’ also was one of the most influenced variables. Variables affecting ‘production diseases’ most in the studied farms were ‘feeding’, ‘hygiene’ and ‘treatment’ (directly) as well as ‘knowledge and skills’, ‘herd health monitoring’ and ‘labour capacity’ (indirectly).
The effect of feeding on production diseases has been shown by numerous studies. Nutrition is an important aspect of the animal–environment interaction that does or does not lead to disease, depending on the adaptation capacity of the animal to its living conditions (Sundrum, Reference Sundrum2015). Therefore, it is not surprising that in many of the studied farms a change in feeding management was expected to have the potential of reducing production diseases. Another such aspect is hygiene, which also was one of the variables most affecting production diseases in our farm models. Hygiene measures control the introduction and spread of infectious agents and thus determine to which extent the animal is exposed to (potential) pathogens (Noordhuizen and da Silva, Reference Noordhuizen and da Silva2009). In a considerable number of farms it was estimated that a change in the implementation of hygiene measures could help to control production diseases, hence the high mean PI of that variable. The variable ‘treatment’ also reached high PI values in lots of farms with regard to ‘production diseases’, which can be explained by early and effective treatment being an important component of disease control (LeBlanc et al., Reference LeBlanc, Lissemore, Kelton, Duffield and Leslie2006). This is an indication that many farm assessors saw potential effects from changing the treatment strategy with benefits for animal health.
In terms of indirect effects, ‘knowledge and skills’, ‘herd health monitoring’ and ‘labour capacity’ had the highest proportional impact on ‘production diseases’. This rating acknowledges the fact that preventive and curative measures can only be applied if problems are recognised as such. Identification of health areas not under control requires good monitoring in terms of regular planned observations and documentation (Brand et al., Reference Brand, Noordhuizen and Schukken1996). Implementation of (health-related) improvement measures is likely to be higher if the person in charge knows what to do and why, feels capable and has sufficient labour capacity at his/her disposal (Lam et al., Reference Lam, Jansen, van den Borne, Renes and Hogeveen2011). These interdependencies were recognised and considered by the persons doing the impact assessments, therewith increasing the degree by which the farm specific situation is reflected.
Via ‘production diseases’ and other variables, ‘knowledge and skills’ and ‘herd health monitoring’ were shown to indirectly affect ‘financial resources’ and ‘milk performance’ to a large extent. Thus, their changing was expected to have far-reaching implications in many farms. Again, the identified relationships do not imply that more knowledge will generally lead to low disease prevalence, high milk yields and good income. It illustrates that a lot of farmers, veterinarians and advisors saw a potential benefit deriving from increasing the knowledge and skills on the farm. This assessment considers the knowledge and skills actually present on the farm and the current level of disease, yield and income. Both the required input (in terms of knowledge) for unfolding this potential and the expected output (improvement) is highly farm specific. In a considerable proportion of farms, the variables with a strong general impact were estimated to contribute much less to the prevalence of disease than others. Farm A, for example, reflects the general tendencies with respect to the variables ‘feeding’ (large direct impact on production diseases) and ‘knowledge and skills’ (large indirect impact). ‘Treatment’, in contrast to general findings, has no significance whatsoever. In farm B, ‘milk performance’ is perceived to have a large direct impact on ‘production diseases’ which is different to the general trend. In terms of indirect influences, farm B is in line with general findings but, in addition to general impact factors, dry cow, young stock and reproduction management should be considered in herd health planning. Thus, the strength of the approach is its ability to point out deviations from general expectations and thereby enabling a farm specific selection of strategies, or as Bawden (Reference Bawden1991) puts it: ‘Improvements come about as a result of all the participants exploring unanticipated patterns in unanticipated ways, but all from a framework that respects interconnectedness and the sense of wholeness’.
The method used in this study clearly has its limitations. Although it can be used to model ‘what-if’ relationships, ‘why’ questions and ‘if, then’ statements are beyond its scope as are changes which depend on co-occurrence of multiple causes or which vary under different conditions or in time (Özesmi and Özesmi, Reference Özesmi and Özesmi2004). The need to reduce the number of variables in the matrix to a manageable number implied that, applying the method on-farm, some important variables and impacts may have been ignored. Deriving management actions from highly aggregated variables is delicate and needs to be considered if the method was to be used for advisory services. The tool does not provide real-value parameter estimates or inferential statistical tests and, to date, involves no concept of time or direction of shift (positive or negative). These apparent disadvantages are counteracted by considerable advantages, such as the ability to deal with many fuzzy variables, the ability to model unquantified impacts that can be described in degrees such as a little or a lot, and the ability to model systems where scientific information is limited but where expert/local knowledge sources can be accessed and combined (Özesmi and Özesmi, Reference Özesmi and Özesmi2004). With this ability, the presented method has great potential in aiding farmers and advisors to translate their knowledge into on-farm application and in supporting the right management decisions with respect to herd health.
Conclusion
Graph-based impact analysis was used as a framework for incorporating practitioner knowledge in dairy herd health management. The interactions between farm variables, as perceived by farmer, veterinarian and herd advisor, were assessed and a model created for each farm. Based on each model, farm factors most strongly related to production diseases and thus with the potential to improve herd health could be identified. With this ability, the approach has great potential in aiding on-farm decision making. In future, the method should be tested using more specific problem-oriented variable sets than applied in the current study and following up the resulting changes in order to evaluate the effectiveness of the approach.
Acknowledgements
The authors would like to thank Isabel Blanco-Penedo (Institute for Food and Agricultural Research and Technology, Spain), Manon de Joybert (French National Institute for Agricultural Research (INRA), Oniris, France), Julie Duval (INRA, Oniris) and Karin Sjöström (Swedish University of Agricultural Sciences, Sweden) for their great efforts in farm recruitment and in the preparation and application of the impact assessments. The authors would like to express the gratitude to all farmers for participating in the study and for sharing their views and ideas. All veterinarians and advisors attending the farm visits are gratefully acknowledged for granting us their time, their expertise and their critical feedback. Frank Brand (Berlin School of Economics and Law, Germany) is kindly acknowledged for his thoughts on the impact matrices and for pointing us towards the miraculous world of Mathematica.
This project has received funding from the European Union’s Seventh Framework Programme for research, technological development and demonstration under grant agreement n° 311824, project IMPRO (Impact matrix analysis and cost-benefit calculations to improve management practices regarding health status in organic dairy farming).
Supplementary material
To view supplementary material for this article, please visit http://dx.doi.org/10.1017/S1751731117002105