Yogi Berra might have said it: the best predictor of an election is, well, an election. Not a trial-heat conducted by opinion polls, but a real election of voters going to the polls. In the U.S., at least, what is known as a “general” election is preceded by a “primary” election, and that has been the case for presidential contests since 1912. So is the voting in presidential primaries a leading indicator of the vote in November? Remarkably so, as it turns out. How well presidential candidates do in primary elections foretells their prospects in the November election with great accuracy. What is more, the use of primaries as a vote predictor makes it possible to include in the forecast model both the candidate of the incumbent party and the candidate of the party out of the White House. The forecast for 2004 uses candidate vote shares in primaries, not just a win-lose dichotomy as done in the model used to predict the vote in 2000 (Norpoth 2001).1
For an excellent overview of forecast models of presidential elections, see Jones 2002, as well as Lewis-Beck and Rice 1992. For a review and critique of such models in 2000 and 1996, see the contributions in the March 2001 issue of PS: Political Science & Politics, <www.apsanet.org/PS/March01/election2000.cfm>, and Campbell and Garand 2000.
In addition, this forecast model relies on the familiar cycle of the presidential vote (which taps previous elections of the general sort) and newly incorporates long-term partisanship. The data for the model cover elections all the way back to 1912, more (23) than any other forecast model. With a standard error of 2.5%, the vote model correctly picks the winner in all but one election. The lone miss occurs in 1960, the closest contest in the 20th century. With all the predictors known for certain, the model is able to make an unconditional forecast of the Bush-Kerry race. The prediction is that George W. Bush will defeat John Kerry by 54.7 to 45.3% of the major-party vote, with the odds of a Bush victory being about 20 to 1. The model also allows for alternate forecasts in the event that Democrats other than Kerry had won their party's presidential nomination. These forecasts all predict that Bush would win by an even wider margin.
Candidate Support in Primaries
Ever since presidential primaries were introduced, in 1912, the ultimate nominees have played a key role in those contests. Only once (1920) did neither party give the presidential nomination to its primary winner.2
For the elections of 1952 and 1968, this analysis enters the primary vote received by sitting presidents (Truman and Johnson, respectively) who later withdrew from the race. The ultimate nominees (Stevenson and Humphrey, respectively) did not compete in primaries.
How primary support for a presidential nominee translates into general election support is best examined separately for the party with a president in the White House and the out-party. In the party holding the White House at the time of a presidential election, many of the nominees, of course, are presidents seeking reelection. Or they are incumbent vice presidents winning their party's nomination (Richard Nixon in 1960, George H. W. Bush in 1988, and Al Gore in 2000), turning the presidential contest into a “succession election” (Weisberg and Hill
2004). During the period of interest (1912–2000), it was quite rare for the incumbent party to nominate a presidential candidate lacking any official connection to the outgoing administration (Democrats in 1920 and 1952).
Until 1952, no single state with a primary could count on playing the lead role in the presidential-selection drama. That changed with swift and lasting impact when the state holding the first contest decided to put presidential candidates rather than convention delegates on the ballot. Since 1952, New Hampshire has allowed primary voters to check their preferences for would-be presidents rather than delegates. That switch “gave presidential hopefuls an opportunity to demonstrate early strength” (Buell 2000, 93), and they seized on it immediately. The beauty-contest format also propelled New Hampshire into the most coveted spot of the primary season, attracting more media attention than any other state (Adams 1987). To win in New Hampshire, however small and unrepresentative, meant a boost for a presidential hopeful that a victory in no other state could match since 1952. At the same time, many of the subsequent primaries have lacked competition, proving little about the electoral appeal of the leading candidate in the general election. So, beginning with 1952, only the vote in the New Hampshire primary will be used, whereas for elections from 1912 to 1948 the vote of all primaries is used.
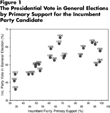
Figure 1 plots the vote in the general election against primary support in the incumbent party. To establish a standard measure, the primary support of the nominee in each party is computed based on the sum total of votes received by that candidate and his chief primary rival (the one with the next most votes, or the leading vote-getter if the nominee did not win the primary battle). That rule will also be applied to primary contests of the opposition party, where it is actually far more compelling.
The Presidential Vote in General Elections by Primary Support for the Incumbent Party Candidate
As for the vote in the general election, the share of the incumbent-party candidate is based on the major-party vote only; votes for third-party candidates are excluded.3
For the 1912 election, the two-party vote was approximated by the congressional vote. The intrusion of Teddy Roosevelt's third-party campaign was so severe that the Republican candidate ended up in third place with only 23.2% of the total popular vote while Wilson, the Democrat, won with 41.8%. In those days, the correlation between the two-party vote for president and House was extremely high (.95 for the 20 elections from 1872 to 1952, excluding 1912). The House vote in 1912 is a reasonable estimate of what Wilson might have obtained in a straight contest with Taft.
As shown by Figure 1, primary support offers a strong, though not perfect, predictor of electoral support for incumbent-party candidates in the general election. Any time primary support falls below 50% (by the standard measure adopted here), the presidential candidate of the party holding the White House loses in the general election (getting less than 50% of the major-party vote). The precedent was set by President William Howard Taft in 1912: he lost the primary battle and went on to lose the general election. By the same token, nearly every time primary support exceeds 50%, the candidate of the White House party goes on to victory in November. That precedent was set by President Woodrow Wilson in 1916: he won the primary battle and went on to win the general election. But there are exceptions to this rule. Several times an incumbent candidate was defeated in the general election despite winning most of the primary support. Case in point: President George H. W. Bush in 1992: ahead in the primary count, but behind in November of 1992. It appears that for sitting presidents 50% is not a safe mark. Significant opposition in the primaries hints at trouble for re-election. Yet regardless of whether or not a sitting president is running, incumbent-party candidates appear to gain little further in general-election safety once they reach about 75% of support in the primary battle. In other words, the predictive relationship between primary support and November vote is not linear, or is linear only within a restricted range of primary support. That is a point to consider for the estimation of the forecast model.
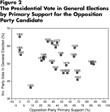
Turning to the primary battle within the out-party, Figure 2 suggests that the better the opposition-party candidate does in primaries, the worse the incumbent party fares in the November election. Primary success and general election victory go hand in hand for the out-party. That was the precedent set by Wilson in 1912. But it did not always hold. Most notably, it did not do so for Al Smith (1928) or Michael Dukakis (1988); but then in each of those instances the incumbent party had nominated its primary winner. By the same token, the electoral prospects for the out-party in November are gloomy when the primary support of its candidate falls short of 50%. In most of those elections, the incumbent party has won the general election. One exception is the 1920 election. The Democrats lost the White House in a landslide to a Republican candidate (Warren Harding) who barely registered in his party's primaries that year. As Figure 2 makes clear, the 1920 case is an outlier, but it is also the only outlier. Even in the old days—contrary to much conventional wisdom—winning general elections without strong primary support was not common. In sum, the predictive power of primary success for general election performance is impressive for the out-party, competing with that of the incumbent party in some cases and complementing it in others.
The Presidential Vote in General Elections by Primary Support for the Opposition Party Candidate
The Forecast Model
As before, the forecast model also enlists a cyclical dynamic of the presidential vote familiar to readers of PS (Norpoth 1995; 2001; also Midlarsky 1984). One explanation for that dynamic, as subsequent research has suggested, may be the existence of a term limit in presidential elections (Norpoth 2002). Except for Franklin Delano Roosevelt, American presidents have eschewed running for more than two terms; and have been barred from doing so since then. The rule guarantees that incumbent presidents are missing from those contests in some periodic fashion, the latest instance being the 2000 election, when the two-term limit barred Bill Clinton from trying to keep the White House in Democratic hands. A second-order autoregressive process with a positive sign for the vote at lag one (the preceding presidential election) and a negative sign for the vote at lag two (the presidential election two terms back) captures that kind of periodicity.
The forecast model for 2004 also includes a new predictor that is nonetheless familiar to every student of elections: longterm partisanship (Campbell et al. 1960). The overall balance of party identification in the electorate creates a normal-vote baseline that remains stable over long stretches save for rare realignments. The stability of party identification lets many forecast models get away with ignoring this factor. But that is less defensible for one that covers elections as far back as 1912. There is no question that the basic party division of the American electorate has changed since then. The 1930s, by all accounts, witnessed a major realignment that requires an adjustment of the normal-vote baseline of partisan support. A time series analysis of the congressional vote from 1828 on, in presidential as well as midterm years, shows a long-term partisan shift from about 54–46 in favor of the Republican Party to 53–47 in favor of the Democratic Party during the 1930s (Norpoth and Rusk 2003). The forecast model incorporates this shift of the partisan baseline owing to the 1930s realignment.
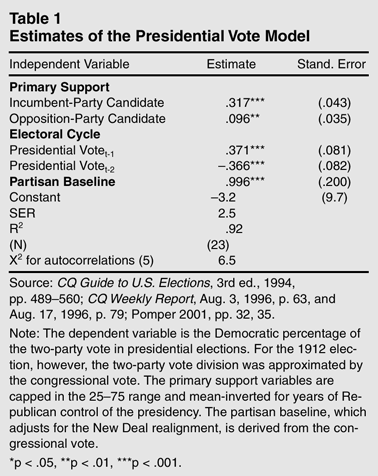
The parameters of the model are statistically estimated with data from presidential elections since 1912. Note that the dependent variable is the Democratic percentage of the majorparty vote, regardless of whether that party was in the White House or not. As a result, the primary-support variables had to be inverted for elections with Republicans in control.4
The inversion was done around the means of the variables: 61.3 for incumbent-party candidates who were sitting presidents; 56.6 for other incumbent-party candidates; and 45.8 for out-party candidates.
The evidence in
Table 1 confirms that all predictors prove significant. The effect of primary support for the incumbent-party candidate is enormous and far more significant than is the effect of primary support for the opposition-party candidate. Partisanship also exerts a powerful influence on the vote. The adjustment of the normal-vote baseline for the New Deal realignment pays off handsomely. So does, once again, the cyclical dynamic of presidential elections.
So what outcome does the model predict for the 2004 election? The key is the New Hampshire primary where George W. Bush took 87% against token opposition in the Republican race, while John Kerry beat his closest rival, Howard Dean, 59.3 to 40.7% of the Democratic vote for those two candidates.5
In the Democratic primary in New Hampshire, John Kerry received 84,229 votes, compared to 57,788 for Dean, his closest rival. That translates into a two-candidate share of 59.3% for Kerry and 40.7% for Dean. In the Republican primary in New Hampshire (yes, there was one in 2004), Bush received 87% of the votes, which places him safely into the 75+ category. Clark, Edwards, and Lieberman each received less than the 25% threshold. So any forecast involving them against Bush would all be the same. Source of the 2004 New Hampshire primary results: http://www.primary.monitor.com, January 29, 2004.
Along with the other predictors of the model, that leads to the forecast that Bush will defeat Kerry by 54.7 to 45.3% of the major-party vote.
6 The prediction equation for the Kerry vote in 2004, entering the predictors in the order in which they are featured in Table 1, is: .317(75-61.3) (–1) +.096(59.3-45.8) +.371(50.3) –.366(54.7) +.996(53) –3.2. Note that Bush's primary support of 87% is capped at 75 and inverted (–1) around the mean for sitting presidents (61.3). Kerry's primary support of 59.3% is adjusted for the mean for out-party candidates (45.8). The Democratic share of the major-party vote in the presidential election of 2000 was 50.3%, and 54.7% in 1996. The estimate of the partisan baseline for 2004 is 53%. The forecast of a Bush win over Kerry (54.7 to 45.3%) was first posted on January 29, 2004.
Given his victory in the Democratic primary in New Hampshire, Kerry nonetheless would do best among all possible Democratic contenders. For Bush to face defeat in November, his primary showing in New Hampshire would have had to be around 50%, as was the case with his father in 1992. With the Democratic nominee garnering around 60% (of the top 2 candidates), the forecast of the November vote in that case would be a Bush defeat. Kerry would beat Bush 53.3 to 46.7%. The forecast model is even-handed. It has no partisan favorite. All that matters in the short run is how the major-party candidates do in the primaries. It is true, though, that the showing of the in-party candidate matters far more than the showing of the out-party candidate.
How much confidence does this forecast of a Bush victory inspire? The estimate of the forecast error, given the model standard error and the values of the predictors, comes to 2.7. That would allow us to reject the hypothesis of Bush losing (falling below 50% of the major-party vote) at the .05 level. In other words, the forecast of a Bush victory over Kerry has a 95% certainty. The certainty of a Bush win over other Democratic nominees would be even higher.
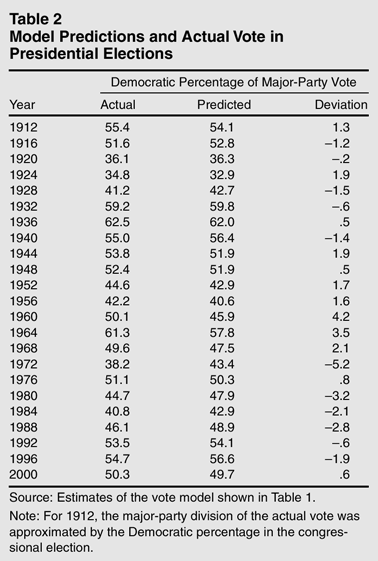
How well has the model done in forecasting presidential elections so far? Earlier versions of this model predicted Democratic victories in 1996 and 2000. The forecast of the Clinton vote in 1996 (57.1%) was off by 2.4 points (in Campbell and Garand 1996, 8) whereas the Gore forecast in 2000 (55.0%) was off by 4.7 points (Norpoth 2001, 45). While in both cases the forecast model relied on the cyclical dynamic, primary support was handled differently than it was in the current model. For 2000, only incumbent-party support entered into the forecast and simply as win-lose dichotomy. That may have given Al Gore an undue boost in the November forecast. The current model with primary support measured as the relative vote share of the nominee comes very close to the 2000 result, as Table 2 shows, at least retroactively. All in all, these “in-sample” predictions (the fitted vote of elections included in the model estimation) point to the right winner in all but one election (1960), while getting Bush's victory in the electoral college right in 2000. In most elections, the prediction deviates from the outcome by no more than 2 points. Other than the 1960 contest, only the 1972 and 1964 elections produce large errors, which do not hurt much, however, since those outcomes were landslides.
Conclusion
The forecast model presented here makes George W. Bush an almost 20-1 favorite to defeat John Kerry this November. The forecast of a Bush victory—by 54.7 to 45.3% of the majorparty vote—is derived from a model whose predictors are candidate support in presidential primaries (only New Hampshire since 1952), partisanship, and a presidential vote cycle. The reliance on primary elections as a predictor of the vote in the general election has several advantages. One, it puts the model estimation on a firmer footing by letting us include elections all the way back to 1912. Two, it allows one to include both incumbent and opposition candidates. Granted, the incumbent candidate's performance proves more powerful, but the out-party's primary showing is not negligible. Three, primary support is not just a proxy or a trial heat, but a real-life test of the candidates' electoral performance. And finally, the use of primaries as a predictor permits an unconditional forecast of the November vote at a very early moment. No ifs and buts. Once both majorparty candidates have clinched their parties' nominations all the information needed to make the forecast is known for certain.