




No CrossRef data available.
Schistosome genetic diversity: the implications of population structure as detected with microsatellite markers
Published online by Cambridge University Press: 15 March 2004
Abstract
Blood flukes in the genus Schistosoma are important human parasites in tropical regions. A substantial amount of genetic diversity has been described in populations of these parasites using molecular markers. We first consider the extent of genetic variation found in Schistosoma mansoni and some factors that may be contributing to this variation. Recently, though, attempts have been made to analyze not only the genetic diversity but how that diversity is partitioned within natural populations of schistosomes. Studies with non-allelic molecular markers (e.g. RAPDs and mtVNTRs) have indicated that schistosome populations exhibit varying levels of gene flow among component subpopulations. The recent characterization of microsatellite markers for S. mansoni provided an opportunity to study schistosome population structure within a population of schistosomes from a single Brazilian village using allelic markers. Whereas the detection of population structure depends strongly on the type of analysis with a mitochondrial marker, analyses with a set of seven microsatellite loci consistently revealed moderate genetic differentiation when village boroughs were used to define parasite subpopulations and greater subdivision when human hosts defined subpopulations. Finally, we discuss the implications that such strong population structure might have on schistosome epidemiology.
Information
- Type
- Research Article
- Information
- Copyright
- © 2002 Cambridge University Press
GENETIC POLYMORPHISM IN SCHISTOSOMES
The interactions between hosts and parasites can be viewed as a co-evolutionary contest between the interacting species; numerous factors – both biotic (e.g. reciprocal genetic change) and abiotic (e.g. changes in the environment) – contribute to the outcome of the contest. Over the course of an infection, the host's genetic background and associated adaptive immune responses provide it with the means to avoid or combat parasite invasion. Conversely, the parasite's genotype may make the difference between successful propagation and elimination; this sort of co-evolutionary arms race is embodied in the ‘Red Queen Hypothesis’ (Van Valen, 1973). The genetic variation present in each of the respective populations can be viewed as the arsenal for each of the species involved in this never-ending contest.
An entire range of micro-evolutionary forces, which serve to alter the genetic composition of the competing populations, further complicates these interactions at the population level. Typically, parasites can only mate with conspecifics that have managed to coinfect their host, many of which could be closely related due to the transmission dynamics of the parasite's life cycle. The stochastic nature of parasite transmission dynamics may eliminate otherwise fit parasite genotypes from isolated populations. Finally, in the case of parasites of humans, hosts may take action that selects for parasite genotypes that are less susceptible to treatment with anti-parasitic drugs.
If the three major components of any host-parasite interaction are the abiotic environment, host genetics (whether human or snail host) and parasite genetics, it can easily be argued that the latter has been the least studied, even though it surely contributes to exposure outcomes as much as either of the other two. In our studies of schistosome parasites in Brazil, it is common to find households where there is significant among-host variation in infection intensity. While immunology and the environment certainly play a role in shaping such outcomes, parasite genetics is the other piece of the puzzle.
Our analyses of parasite genetics focus on Schistosoma mansoni, a trematode parasite of the mammalian blood system. These worms are responsible for human schistosomiasis, a debilitating disease in South America, the Caribbean, Africa and the Middle East. Schistosomes undergo sexual reproduction in human hosts and this presumably generates parasite genotypic diversity. The eggs laid by the female worm pass in the host's faeces and hatch in water to release miracidia. These free-swimming larvae must find and penetrate a freshwater snail (Biomphalaria spp.). The larval stages grow and multiply asexually within the snail (i.e. a single miracidium gives rise to many clonal offspring), emerging after several weeks as free-swimming cercariae that are infective to human hosts, thus completing the life cycle. A number of features of this life cycle may have interesting ramifications for the maintenance and distribution of parasite genetic diversity. Different schistosome genotypes may be brought together in space and time as: (1) male and female worms mate in the human host, (2) eggs representing the outcome of matings between different worm pairs are passed by defaecation of the host and (3) larval stages coinfect the same snail host and simultaneously release cercariae available for infection of human hosts.
In order to assess the relative role of various evolutionary forces on natural schistosome populations, we must determine the distributions of schistosome genotypes in these populations and their change over time. However, for populations of S. mansoni, little is known of the distribution of different parasite genotypes within and among populations (Curtis & Minchella, 2000). This dearth of knowledge has been due both to the lack of appropriate polymorphic genetic markers (Nadler, 1995) and to the difficulty in obtaining representative samples of schistosomes from natural populations. Infected intermediate hosts (B. glabrata) often occur at very low frequencies in the field and, because adult worms are sequestered within human hosts, they are not available for direct genetic characterization.
With the application of modern genetic methods, however, elucidation of the genetic structure of schistosome populations is gradually being realized. Using a highly polymorphic repetitive DNA marker, substantial genetic heterogeneity was detected among isolates from a single local site in Brazil (Minchella et al. 1994). High genotypic diversity has also been reported for parasites within rat definitive hosts in Guadeloupe using randomly amplified polymorphic DNA (RAPD) markers (Barral et al. 1996; Sire et al. 2001), though further studies are needed to compare this diversity with that found in humans. Schistosome genotypic diversity within molluscan host populations has also been characterized, often through infection of laboratory mice with cercariae shed from field-collected snails (Minchella, Sollenberger & deSousa, 1995; Dabo et al. 1997; Davies et al. 1999; Sire et al. 1999). These studies have sampled snail populations with a range of infection prevalences. Results support the hypothesis that a single intermediate host may harbour a number of different parasite genotypes and that these genotypes may represent a significant fraction of the parasite genotypic diversity at a collection site. As infection prevalence increases at a site, the distribution of the number of genotypes found within each snail becomes more uniform and thus the phenomenon of genotypic overdispersion appears to diminish (Eppert et al. 2002).
MEASURING POPULATION STRUCTURE INSCHISTOSOMES
In studies of genetic variation in natural populations, the first step is to quantify the genetic variation present. While it is of value to know the variety of schistosomes that exist within a defined area, it would be even more advantageous to know how genotypes are distributed within and among parasite populations, and the epidemiological factors that determine these distributions. For schistosome populations infecting human hosts, it is possible to define subpopulations at a variety of hierarchical levels: all the worms within a patient, within all of the patients in a particular ‘neighbourhood’, within all of the ‘neighbourhoods’ that make up a village, within all of the villages that make up a region. The extent to which gene flow is restricted between these subpopulations determines the degree of population structure at each of the hierarchical levels (Wright, 1978; Slatkin, 1995).
Just as the schistosome life cycle affects genotype movement through biotic and abiotic environments, it also plays an important role in determining schistosome population structure. Infection foci for schistosomiasis must have three characteristics: (1) suitable snail habitat, (2) contamination of freshwater with host faeces and (3) areas where humans have contact with water containing infective parasite larvae. Areas that do not meet all of these criteria are not likely to become stable infection foci, and will serve as parasite population ‘sinks’ in the host-parasite landscape. Gene flow between parasite subpopulations will then depend on the rate at which schistosomes are transferred between infection foci, which in most cases, would depend on the movement of infected human hosts.
Two aspects of the snail host populations also contribute to the expectation of schistosome population structure. First, parasite infections are typically overdispersed in natural Biomphalaria populations, such that a minority of the snails in the population harbours the majority of the infections (summarized in Eppert et al. 2002). As described above, multiple genotypes of the parasite could then be transmitted through one or a few snails in a very localized area. Second, recent analyses of snail populations have indicated that these are themselves strongly subdivided, perhaps due to the ability of those snails to undergo self-fertilization (Langand et al. 1999). Strong subdivision of snail populations makes it more likely that local adaptations may develop, including resistance to the most common parasite genotypes. This could be followed by frequency-dependent selection such that hosts and parasites co-evolve on a short-term localized scale (Manning, Woolhouse & Ndamba, 1995; Dybdahl & Lively, 1996).
Early studies of population structure in schistosomes used isozymes to look for genetic differences between populations of S. mansoni: those that are transmitted through rodents, and populations that infected humans (Rollinson, 1986; Sene et al. 1997). More recently, other molecular markers have been employed for analyses of schistosome population subdivision. We have reported the population structure of schistosome parasites within 21 patients from a Brazilian village using a mitochondrial marker with a variable number of tandem repeats (mtVNTR), which is reviewed in more detail below (Curtis et al. 2001a). Population structure of Biomphalaria snail hosts and adult schistosomes from rat definitive hosts have been compared on Guadeloupe using RAPD markers, with significant population structure being detected for both (Sire et al. 2001). The subdivision of S. haematobium in human patients has also been studied using RAPD markers (Brouwer et al. 2001). This latter analysis found little evidence of population structure, although most of the patient isolates came from schoolchildren who might have been infected at the same set of local transmission sites. When transmission sites are not widely separated (e.g. on separate watercourses), the expectation of subdivision due to geographic factors diminishes.
It is evident from these preliminary studies of schistosome population structure that the nature of the sampled host population will influence the amount of subdivision detected. Cross-sectional surveys of communities are more likely to reveal population structure than, for example, a population of schoolchildren. Studies of population structure in non-human vertebrates, while allowing for direct genetic characterization of adult worms, carry the caveat that schistosome transmission may be quite different in these systems due to patterns of host movement. In addition, the methods used in characterizing the schistosome genotypes may well influence the degree of population structure that is detected.
Population structure can be estimated by several different methods. For molecular analyses using markers such as RAPDs or DNA fingerprinting, genetic differences between individuals are generated in the form of presence/absence data (i.e. non-allelic data). Population structure is then inferred when different subpopulations exhibit varying frequencies for the different variants that make up each individuals profile (e.g. bands produced by gel electrophoresis). Estimating population structure with such data requires just the right amount of genetic polymorphism: insufficient levels do not provide sufficient resolution, but it is also possible that highly variable markers will make all individuals appear equally distant from one another, regardless of their true relationship (Estoup & Cornuet, 1999; J. Curtis, unpublished observations).
The S. mansoni mitochondrial genome contains a highly variable mtVNTR. The repeats in this polymorphic element, called pSM750, are 62 bp long, and the entire repeat region is flanked by restriction sites for the endonuclease RsaI (Spotila, Rekosh & LoVerde, 1991). Each mitochondrial genome has the potential to carry a different number of these repeats and individual worms often contain multiple versions of the element (Curtis et al. 2001a; Bieberich & Minchella, 2001), implying that there are a number of distinct mitochondrial haplotypes in the organelle population of each cell in the worm (i.e. the worms are heteroplasmic). By using pSM750 as a probe of genomic DNA from individual worms it is possible to detect a substantial amount of variation within a relatively small sample (Minchella et al. 1994, 1995), which in turn allows for the identification of differences between individual parasites within a single host. Population subdivision, based on the distribution of different haplotypes within subpopulations, can then be estimated using a class of hierarchical statistics designed for genetic data from organelles (Cpt: Lewontin, 1972; Birky, Fuerst & Murayama, 1989).
In order to utilize more advanced population genetic methods, schistosome population structure must be estimated using the observed number of heterozygotes among subpopulations; deficiencies in heterozygosity indicate potential cases of restricted gene flow or inbreeding (Wright, 1978; Slatkin, 1995). Thus, studies of population structure demand molecular markers that display allelism (Curtis & Minchella, 2000). Microsatellite loci – markers that meet these criteria – are DNA sequences characterized by a variable number of very short repeats (2–6 nucleotides each). Microsatellites have been effective tools for detecting genetic structure at limited spatial scales (Lougheed et al. 2000). A number of microsatellite loci have been described from the genome of S. mansoni (Durand, Sire & Théron, 2000; Curtis et al. 2001b).
Allele frequency data for a population of worms can be used to calculate FST (Wright, 1969) by the method of Weir & Cockerham (1984), as well as ρST (Michalakis & Excoffier, 1996), an unbiased estimate of the equivalent statistic (RST: Slatkin, 1995) that accounts for repeat length variation present in microsatellite data. Using the frequencies of the different alleles and the assumption that closely related alleles will have small size differences, population subdivision can be estimated for each of the loci; a final estimate can also be inferred across all loci. Higher values of FST (alternatively, ρST for microsatellites, or Cpt for mtVNTR data) indicate greater differentiation of subpopulations (i.e. restricted gene flow), and thus more population structure.
FIELD STUDIES OF BRAZILIAN SCHISTOSOMES
In October 1997, we sampled parasite diversity in patients who live in the Brazilian village of Melquiades in the state of Minas Gerais. The prevalence of S. mansoni among the 800 citizens of the village was very high (75%). The village consists of a collection of boroughs along several independent waterways with clusters of houses separated by 1–2 km of intervening agricultural land. Given this, it seemed unlikely that there could be a single intense focus of transmission. A total of 21 patients were sampled, representing each of the seven boroughs. The patient isolates were obtained by hatching miracidia from faecal samples and these miracidia were used to infect lab-reared snails. After 4–5 weeks, the cercariae emerging from these infected snails were used to infect mice. Once the schistosomes had matured, they were harvested from the mice by perfusion and used in the genetic analysis of each patient isolate.
DNA was extracted from 25–30 individual male schistosomes from each patient isolate (after Sorensen, Curtis & Minchella, 1998). As none of the molecular markers shows evidence of sex-linked inheritance, males are used exclusively because their larger bodies provide more DNA for the analysis. Worms were placed in 1.5 ml microcentrifuge tubes and pulverized on dry ice with a chilled pestle. The pestle was rinsed with a buffer containing 100 mM NaCl, 25 mM sucrose, 10 mM EDTA, and 2% (m/v) SDS in 50 mM Tris, pH 8.0 (Brindley et al. 1989). This mixture was lysed at 65 °C for 30 min, then 8 M KOAc was added to a final concentration of 1 M, and lastly, it was chilled on ice for 30 min. Salts were removed from the mixture by spinning at 12000 rpm for 10 min. Standard ethanol precipitation practices (Sambrook, Fritsch & Maniatis, 1989) were used to pellet the DNA from the supernatant. Pellets were resuspended in 16 μl of water, with 13 μl being used in the DNA profiling analysis with the mtVNTR marker. The remaining 3 μl aliquot (approximately 150 ng of DNA) was diluted 1[ratio ]10 with water and used in the microsatellite analysis.
The schistosomes comprising the patient isolates from Melquiades were first analysed by DNA profiling with the pSM750 mtVNTR marker (Curtis et al. 2001a). Although this study analysed the subsequent generation after rearing through laboratory snails and mice, the marker's pattern of maternal inheritance (Bieberich & Minchella, 2001) allowed direct inference of mtVNTR haplotype diversity for the population within a single human host. On average, patients were infected with approximately 10 different schistosome genotypes (i.e. genotypes distinguished on the basis of distinct haplotype profiles), and very few genotypes were found in more than one patient isolate. We detected no correlation between the clustering of worm genotypes and any other epidemiological parameters (e.g. geography, patient age, patient sex, household or worm burden). Among the individual schistosomes, 72.5% had heteroplasmic haplotype profiles, such that individual worms represented 46.9% of the genetic variation present in the population. With so much of the variation described at the within-worm level of the population structure hierarchy, differentiation between patient isolates was low (Cpt = 0.060) and subdivision between the seven boroughs was even less (Cpt = 0.025). The apparent lack of population structure within schistosomes from Melquiades, despite a wealth of genotypic diversity, seemed to support the hypothesis that human hosts move throughout the village, acquiring infections from a variety of transmission sites, thereby creating the opportunity for different genotypes to mate.
Alternatively, a phenomenon such as an increased mutation rate or another feature of the genetic marker might be contributing to the apparent lack of population structure. In fact, we have evidence that the mutation rate for pSM750, which lies within the highly variable D-loop of the S. mansoni mitochondrial genome, may be as high as 10−1 events per generation (Bieberich & Minchella, 2001). This led us to suspect that haplotypes with an identical number of pSM750 repeats might not be the products of a common ancestor, but rather the result of a homoplasy-inducing mutational event (Estoup & Cornuet, 1999). This suspicion was further supported by the observation that many of the haplotypes fell within a narrow range of repeat sizes that appeared to be most common. Thus, the genotypes of many of these individual worms were comprised of one of the common haplotypes along with one or more of the less frequent haplotypes.
In an attempt to correct for the homoplasy present in the distribution of the common haplotypes, we recalculated the hierarchical statistics using only the ‘rare’ haplotypes (those present in 10 or fewer genotypes in the entire population) (Slatkin, 1985). Under this analysis, the within-worm component of the population's genetic variation dropped to 17%, and much more of the variation was distributed within and among subpopulations (Table 3 in Curtis et al. 2001a). Substantial differentiation was found among patient isolates (Cpt = 0.365), and moderate subdivision was even detected among boroughs (Cpt = 0.138). Thus, the two analyses using the mtVNTR as a marker provided conflicting results: little evidence of subdivision was detected when all haplotypes were considered, whereas rare haplotypes alone implied strong subdivision.
To resolve this ambiguity regarding the schistosome population structure in Melquiades, we re-analysed the schistosome isolates with a set of seven nuclear microsatellite loci as markers (Table 1; Durand et al. 2000; Curtis et al. 2001b) as these provide allelic data, so that levels of heterozygosity could be assessed. These loci were chosen on the basis of consistent and reproducible amplification under standard conditions (Curtis et al. 2001b).

Alleles from at least five of seven loci were scored for a total of 295 worms. For four of the 21 patient isolates, fewer than 10 worms could be scored at any of the loci. These isolates were omitted from the analysis, and while all seven boroughs were still represented, some were represented by a single patient isolate. Also, prior to the calculation of allele frequencies, 29 worms were removed from the analysis on the basis of redundancy with other worms in the data-set from the same patient. The assumption underlying this removal was that if worms from the same patient isolate were indistinguishable with 7 microsatellite loci, then they were most likely clonal siblings produced asexually during passage through laboratory snails and should only be counted once to avoid pseudo-replication. Interestingly, the occurrence of clonal siblings within samples from patient isolates was relatively uncommon. A single worm pair within a patient could generate large numbers of multi-locus microsatellite genotypes among their offspring, and it seemed that many of these different offspring genotypes occurred in our sample. Because microsatellite loci are assumed to be selectively neutral, it is assumed in our analysis that any loss of genotypes that may occur during the laboratory passage is random (i.e. no selection occurs).
The schistosome population sample from Melquiades exhibited considerable allelic diversity at all of the loci sampled (mean = 18.9 alleles/locus). Observed heterozygosities were calculated at several different levels: at each locus within each patient isolate, across all loci within each patient isolate, across all patient isolates for each locus, and averaged for all loci across all worms within each isolate. The average within-worm heterozygosity values for each of the isolates ranged between 0.34 and 0.69 (Table 2), and were not correlated with the number of maternal genotypes previously estimated from each patient isolate using pSM750 (R2 = 0.08, P = 0.29). This would seem to imply that the level of heterozygosity in the offspring was independent of the genetic diversity of worm pairs that were producing the eggs in the patient.

Heterozygosities at each of the loci ranged between 0.33 and 0.73 (Table 2). There was no correlation between the number of alleles detected at a locus and the average heterozygosity at that locus (R2 = 0.15, P = 0.39). Worms were heterozygous at an average of 57% (S.D. 19%) of their loci. Heterozygosities (at all loci scored) within each of the 17 patient isolates ranged between 0.33 and 0.69.
Values for FST and ρST were calculated using ‘Genepop on the Web’ (Rousset & Raymond, 1995; as implemented at http://wbiomed.curtin.edu.au/genepop). The value for Wright's FST varied between loci (Table 3). FST values were higher when individual hosts were treated as subpopulations (FST, all loci = 0.11) than when boroughs were treated as subpopulations (FST, all loci = 0.06) (paired t test, D.F. = 12, P<0.01). The values for ρST also varied across loci (Table 3), and were again higher when human hosts were used to define the subpopulations (ρST, all loci = 0.19) than when boroughs were used to define the subpopulations (ρST, all loci = 0.07) (paired t test, D.F. = 12, P = 0.01). Because they are both measures of population structure, values for ρST and FST were also compared under the two hierarchical regimes. FST and ρST did not differ significantly either when hosts were used as subpopulations (paired t test, D.F. = 12, P = 0.25) or when boroughs were used (paired t test, D.F. = 12, P = 0.15).

The values for FST and ρST indicate that there is some degree of population structure for the schistosomes from this single village. While the overall values (Table 3) indicate that gene flow is restricted between some or all of the subpopulations, this single measurement does not indicate whether all of the subpopulations are equally differentiated, or whether parasites from some areas are more genetically distinct than others. In order to examine the extent of separation between parasites from the different boroughs, we calculated FST for all possible pairs of boroughs. Recalling that FST is inversely related to gene flow, these data can be used to infer which boroughs are experiencing migration of schistosomes to/from other boroughs. The results of this analysis (Fig. 1) indicate that certain boroughs (e.g. I, II and III) are essentially undifferentiated, while others (e.g. IV and V) are much more distinct. The observation that parasites in the ‘upstream’ boroughs are closely related, while those ‘downstream’ appear to be more independent, would seem to imply that schistosome gene flow is not strongly influenced by movement of aquatic larval forms or snails, but rather a product of human movement. In fact, human residents in the upstream boroughs frequent the same areas (school, church, etc.), but have little occasion to travel to the more distant boroughs. These results demonstrate that a substantial amount of genetic differentiation can develop in schistosome populations, even over small geographic scales, and that the micro-evolutionary forces that produce such separation are most likely to be countered by migration facilitated by human hosts. Further analyses are needed to examine the persistence of this pattern of differentiation over greater geographic scales (i.e. among different villages and geographic regions).

Fig 1. Schematic representation of schistosome gene flow within the Brazilian village of Melquiades. The relative positions of the seven boroughs of the village that were sampled are shown. The thickness of the arrow connecting a pair of boroughs reflects the amount of gene flow between their respective schistosome populations. More gene flow between boroughs would result in a lower value for FST. Lack of a connection between boroughs indicates that those boroughs are at least moderately differentiated (FST>0.05). Major watercourses and direction of flow are shown in grey.
Thus, the microsatellite analysis of schistosome isolates collected from human hosts in the Brazilian village of Melquiades revealed an impressive amount of allelic diversity even though all of the patients came from a fairly small geographic area (<50 km2). For all of the seven loci used in this study, the number of different alleles detected at Melquiades exceeded the diversity reported from sample populations when those loci were characterized (Durand et al. 2000; Curtis et al. 2001b). The amount of allelic diversity present, in combination with the fact that many of the rare alleles at the extreme of the size range were found in a single patient isolate, provided ideal conditions for an examination of population structure. The hierarchical statistics for schistosomes from Melquiades indicate moderate genetic differentiation among the subpopulations in the seven boroughs and greater genetic differentiation between the schistosomes that comprise an individual human host's infection. The extent to which these microsatellite data corroborate the results of the rare haplotype analysis seems to confirm that the common haplotypes are generating ‘noise’ that might obscure the detection of population subdivision, and suggests that there is reduced gene flow among the subpopulations that comprise the schistosome population of Melquiades.
IMPLICATIONS OF POPULATION STRUCTURE
It has been suggested that the high genetic diversity of schistosomes within individual vertebrate hosts may reflect the tendency of these hosts to move about the environment, sampling a number of transmission sites, thereby becoming ‘genetic mixing bowls’ for the parasites (Curtis & Minchella, 2000). However, patients in Melquiades appear to be ‘under-sampling’ the range of schistosome genetic variation in the village. Two alternative explanations are possible: either (1) patients are sampling a large number of sites throughout the village, but because of the stochasticity of infection processes, only a subset of the genotypes are able to successfully infect each patient; or (2) patients are more likely to be infected at transmission sites close to their home, with a rapidly diminishing probability of infection at more distant sites. The latter explanation would appear to be supported by the following two observations. First, a majority of the contact that humans have with cercariae-contaminated water is likely to occur within a short distance of their home (e.g. while performing household duties for adults, while playing for children). This pattern of infection is reflected in the higher similarity of parasite genotypes from adjacent boroughs (Fig. 1). Second, the subpopulations within patients are even more strongly differentiated than the subpopulations of their respective boroughs. Thus, it would appear that patients are not even sampling their local area exhaustively.
If schistosome populations are strongly subdivided, along with populations of the snail intermediate hosts, then the conditions are right for localized adaptation between the parasites and their snail (and potentially, even human) hosts. The results presented here, along with those from other recent studies, indicate that the potential for local adaptation is present. What remains unknown are the mechanisms involved, the rate at which this co-evolution could occur, and the types of genes that are likely to be affected by the selective pressures of co-adaptation. Such local adaptation cannot be examined with the same markers that are used in studies of population structure, as these markers are, by necessity, selectively neutral.
The widespread application of a large set of microsatellite markers will not only contribute to a more complete understanding of schistosome biology; a number of important issues in the study of epidemiology will also become more tractable for study. For instance, schistosome populations that exhibit a polymorphism in response to chemotherapy (Feng, Curtis & Minchella, 2001) might also have demonstrable genetic differentiation at one or more microsatellite loci. At this point, these loci cease to become neutral genetic markers appropriate for population genetic studies; however, these loci would then become useful markers for resistance and might aid in genomic searches for resistance genes. Thus, more studies of natural populations with microsatellite markers are required to further our understanding of schistosome genetic structure and transmission dynamics.
Recent years have seen significant elucidation of the extent and distribution of genetic variation in natural S. mansoni populations. Thus far, the data depict only static moments in what is one of the most dynamic micro-evolutionary processes. The current studies need to be extended to quantify the magnitude of parasite genetic change over time and space. Long-term epidemiological studies in several natural host-parasite systems will allow for accurate modeling of infection and transmission dynamics. Estimates of parasite gene flow, derived from genetic analyses of the parasite sub-populations across many levels of the population structure hierarchy, have the potential to further our understanding of a number of disease processes: how super-infection (i.e. co-infection by multiple genotypes) may affect pathogenicity or the evolution of virulence, the genetic consequences of various control strategies for the parasite population, and the distribution of variation for genetic markers relevant to vaccine development throughout the range of this cosmopolitan parasite.
We would like to thank L. A. Fraga, C. P. de Souza, and R. Correa-Oliveira for assistance with our field studies in Brazil. This work received financial support from the National Institutes of Health (NIH RO1-A1 42768) and the National Science Foundation (DMS-9974389).
References
BARRAL, V., MORAND, S., POINTIER, J. P. & THÉRON, A. (1996). Distribution of schistosome genetic diversity within naturally infected Rattus rattus detected by RAPD markers. Parasitology 113, 511–517.CrossRefGoogle Scholar
BIEBERICH, A. A. & MINCHELLA, D. J. (2001). Mitochondrial inheritance in Schistosoma mansoni: mtVNTR mutation produces noise on top of the signal. Journal of Parasitology 87, 1011–1015.CrossRefGoogle Scholar
BIRKY, C. W. JR., FUERST, P. & MARUYAMA, T. (1989). Organelle gene diversity under migration, mutation, and drift: equilibrium expectations, approach to equilibrium, effects of heteroplasmic cells, and comparison to nuclear genes. Genetics 121, 613–627.Google Scholar
BRINDLEY, P. J., LEWIS, F. A., MCCUTCHAN, T. F., BUEDING, E. & SHER, A. (1989). A genomic change associated with the development of resistance to hycanthone in Schistosoma mansoni. Molecular and Biochemical Parasitology 36, 243–252.CrossRefGoogle Scholar
BROUWER, K. C., NDHLOVU, P., MUNATSI, A. & SHIFF, C. J. (2001). Genetic diversity of a population of Schistosoma haematobium derived from schoolchildren in east central Zimbabwe. Journal of Parasitology 87, 762–769.CrossRefGoogle Scholar
CURTIS, J., FRAGA, L. A., DE SOUZA, C. P., CORREA-OLIVEIRA, R. & MINCHELLA, D. J. (2001a). Widespread heteroplasmy in schistosomes makes a mtVNTR marker ‘nearsighted’. Journal of Heredity 92, 248–253.Google Scholar
CURTIS, J. & MINCHELLA, D. J. (2000). Schistosome population genetic structure: when clumping worms is not just splitting hairs. Parasitology Today 16, 68–71.CrossRefGoogle Scholar
CURTIS, J., SORENSEN, R. E., PAGE, L. K. & MINCHELLA, D. J. (2001b). Microsatellite loci in the human blood fluke Schistosoma mansoni and their utility for other schistosome species. Molecular Ecology Notes 1, 143–145.Google Scholar
DABO, A., DURAND, P., MORAND, S., DIAKITE, M., LANGAND, J., IMBERT-ESTABLET, D., DOUMBO, O. & JOURDANE, J. (1997). Distribution and genetic diversity of Schistosoma haematobium within its bulinid intermediate hosts in Mali. Acta Tropica 66, 15–26.CrossRefGoogle Scholar
DAVIES, C. M., WEBSTER, J. P., KRUGER, O., MUNATSI, A., NDAMBA, J. & WOOLHOUSE, M. E. J. (1999). Host-parasite population genetics: a cross-sectional comparison of Bulinus globosus and Schistosoma haematobium. Parasitology 119, 295–302.CrossRefGoogle Scholar
DURAND, P., SIRE, C. & THÉRON, A. (2000). Isolation of microsatellite markers in the digenetic trematode Schistosoma mansoni from Guadeloupe island. Molecular Ecology 9, 997–998.CrossRefGoogle Scholar
DYBDAHL, M. F. & LIVELY, C. M. (1996). The geography of coevolution: comparative population structures for a snail and its trematode parasite. Evolution 50, 2264–2275.CrossRefGoogle Scholar
EPPERT, A., LEWIS, F. A., GRZYWACZ, C., COURA-FILHO, P. & MINCHELLA, D. J. (2002). Distribution of schistosome infections in molluscan hosts at different levels of parasite prevalence. Journal of Parasitology 88, 232–236.CrossRefGoogle Scholar
ESTOUP, A. & CORNUET, J. (1999). Microsatellite evolution: inferences from population data. In Microsatellites: Evolution and Applications (ed. GOLDSTEIN, D. B. & SCHLÖTTERER, C.), pp. 49–65.
FENG, Z., CURTIS, J. & MINCHELLA, D. J. (2001). The influence of drug treatment on the maintenance of schistosome genetic diversity. Journal of Mathematical Biology 43, 52–68.CrossRefGoogle Scholar
LANGAND, J., THÉRON, A., POINTIER, J. P., DELAY, B. & JOURDANE, J. (1999). Population structure of Biomphalaria glabrata, intermediate host of Schistosoma mansoni in Guadeloupe Island, using RAPD markers. Journal of Molluscan Studies 65, 425–433.CrossRefGoogle Scholar
LEWONTIN, R. C. (1972). The apportionment of human diversity. Evolutionary Biology 6, 381–398.CrossRefGoogle Scholar
LOUGHEED, S. C., GIBBS, H. L., PRIOR, K. A. & WEATHERHEAD, P. J. (2000). A comparison of RAPD versus microsatellite DNA markers in population studies of the massasauga rattlesnake. Journal of Heredity 91, 458–463.CrossRefGoogle Scholar
MANNING, S. D., WOOLHOUSE, M. E. J. & NDAMBA, J. (1995). Geographic compatibility of the freshwater snail Bulinus globosus and schistosomes from the Zimbabwe highveld. International Journal for Parasitology 25, 37–42.CrossRefGoogle Scholar
MICHALAKIS, Y. & EXCOFFIER, L. (1996). A generic estimation of population subdivision using distances between alleles with special reference for microsatellite loci. Genetics 142, 1060–1064.Google Scholar
MINCHELLA, D. J., LEWIS, F. A., SOLLENBERGER, K. M. & WILLIAMS, J. A. (1994). Genetic diversity of Schistosoma mansoni: quantifying strain heterogeneity using a polymorphic DNA element. Molecular and Biochemical Parasitology 68, 307–313.CrossRefGoogle Scholar
MINCHELLA, D. J., SOLLENBERGER, K. M. & DE SOUZA, C. P. (1995). Distribution of schistosome genetic diversity within molluscan intermediate hosts. Parasitology 111, 217–220.CrossRefGoogle Scholar
NADLER, S. (1995). Microevolution and the genetic structure of parasite populations. Journal of Parasitology 81, 395–403.CrossRefGoogle Scholar
ROLLINSON, D. (1986). Schistosoma mansoni from naturally infected Rattus rattus in Guadeloupe: identification, prevalence and enzyme polymorphism. Parasitology 93, 39–53.CrossRefGoogle Scholar
ROUSSET, F. & RAYMOND, M. (1995). Testing heterozygote excess and deficiency. Genetics 140, 1413–1419.Google Scholar
SAMBROOK, J., FRITSCH, E. F. & MANIATIS, T. (1989). Molecular Cloning: A Laboratory Manual.
SENE, M., BRÉMOND, P., HERVE, J. P., SOUTHGATE, V. R., SELLIN, B., MARCHAND, B. & DUPLANTIER, J. M. (1997). Comparison of human and murine isolates of Schistosoma mansoni from Richard-Toll, Senegal, by isoelectric focusing. Journal of Helminthology 71, 175–181.CrossRefGoogle Scholar
SIRE, C., DURAND, P., POINTIER, J. P. & THÉRON, A. (1999). Genetic diversity and recruitment pattern of Schistosoma mansoni in a Biomphalaria glabrata snail population: a field study using random-amplified polymorphic DNA markers. Journal of Parasitology 85, 436–441.CrossRefGoogle Scholar
SIRE, C., LANGAND, J., BARRAL, V. & THÉRON, A. (2001). Parasite (Schistosoma mansoni) and host (Biomphalaria glabrata) genetic diversity: population structure in a fragmented landscape. Parasitology 122, 545–554.CrossRefGoogle Scholar
SLATKIN, M. (1985). Rare alleles as indicators of gene flow. Evolution 39, 53–65.CrossRefGoogle Scholar
SLATKIN, M. (1995). Gene flow and the geographic structure of natural populations. Science 236, 787–792.Google Scholar
SORENSEN, R. E., CURTIS, J. & MINCHELLA, D. J. (1998). Intraspecific variation in the rDNA ITS loci of 37-collar-spined echinostomes from North America: implications for sequence-based diagnoses and phylogenetics. Journal of Parasitology 84, 992–997.CrossRefGoogle Scholar
SPOTILA, L. D., REKOSH, D. M. & LOVERDE, P. T. (1991). Polymorphic repeated DNA element in the genome of Schistosoma mansoni. Molecular and Biochemical Parasitology 48, 117–120.CrossRefGoogle Scholar
WEIR, B. S. & COCKERHAM, C. C. (1984). Estimating F-statistics for the analysis of population structure. Evolution 38, 1358–1370.Google Scholar
WRIGHT, S. (1969). Evolution and the Genetics of Populations, Volume 2. The Theory of Gene Frequencies.
WRIGHT, S. (1978). Evolution and the Genetics of Populations, Volume 4. Variability Within and Among Natural Populations.
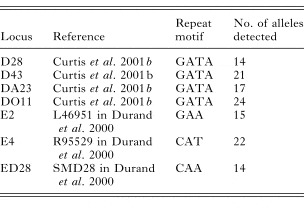
Table 1. Microsatellite loci with repeat motif and allelic diversity
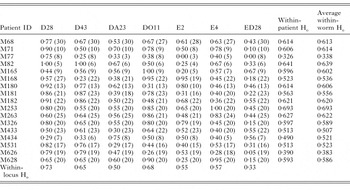
Table 2. Observed heterozygosity (Ho) values by locus and patient isolate. The numbers in parentheses indicate the number of worms for which that locus was scored in that patient isolate
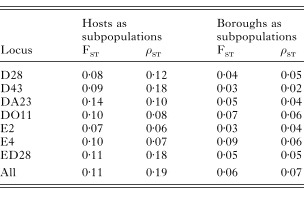
Table 3. Population subdivision by human host and borough
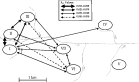
Fig 1. Schematic representation of schistosome gene flow within the Brazilian village of Melquiades. The relative positions of the seven boroughs of the village that were sampled are shown. The thickness of the arrow connecting a pair of boroughs reflects the amount of gene flow between their respective schistosome populations. More gene flow between boroughs would result in a lower value for FST. Lack of a connection between boroughs indicates that those boroughs are at least moderately differentiated (FST>0.05). Major watercourses and direction of flow are shown in grey.
 You have
Access
- 60
- Cited by