





1. Introduction
Biochar has attracted interest as a way to sequester carbon (C) in soils (Lehmann et al. Reference Lehmann, Cowie, Masiello, Kammann, Woolf, Amonette, Cayuela, Camps-Arbestain and Whitman2021; Woolf et al. Reference Woolf, Amonette, Street-Perrott, Lehmann and Joseph2010). On a global scale, biochar has the potential to increase the terrestrial C sink with around 0.7–1.8 Pg CO2-C equivalents annually, which corresponds to roughly 6–16% of current anthropogenic C emissions (Smith Reference Smith2016; Woolf et al. Reference Woolf, Amonette, Street-Perrott, Lehmann and Joseph2010). Given its potential for mitigating climate change, it is important to improve our understanding of biochar C mineralization in soil.
Studying biochar C dynamics in soil is difficult since (i) the persistence of biochar makes the contribution of CO2 from biochar mineralization to overall CO2 fluxes small, (ii) CO2 derived from biochar C mineralization is indistinguishable from CO2 originating from other carbon sources in the soil, and (iii) biochar CO2 release cannot be assumed to be additive to other CO2 fluxes. The need to distinguish biochar C from soil C sources has led to different experimental approaches. Biochar has been produced from 13C or 14C labeled or 13C depleted biomass. However, labeling under laboratory conditions requires advanced facilities to achieve a uniform enrichment of the isotopes within the feedstock and it is costly and time consuming (Chalk and Smith Reference Chalk and Smith2022). Another approach uses the natural abundance difference of 13C between C3 and C4 plants (Chalk and Smith Reference Chalk and Smith2022). However, this is only possible when the biochar can be produced from C4 plant feedstock and applied to a soil where the soil organic matter (SOM) is mainly derived from C3 plants or vice versa. This restricts the usefulness of this technique in areas where both biochar feedstock and SOM mainly are derived from C3 plants. Biomass from free-air CO2 enrichment (FACE) experiments is a potential source of 13C labeled material for producing labeled biochar. Labeling at the scale of mature tree stands is technically challenging and the difference in 13C depletion in the biomass as compared to the atmospheric values is often of the same magnitude as the isotopic discrimination between C3 and C4 plants (10–20‰) (Hobbie et al. Reference Hobbie, Hofmockel, Van Diepen, Lilleskov, Ouimette and Finzi2014; Mildner et al. Reference Mildner, Bader, Leuzinger, Siegwolf and Körner2014).
The nuclear bomb tests in the 1950–1960s created a peak in atmospheric 14C abundance around 1964 and thereafter the 14C level has gradually decreased to near pre-modern level by 2020 (Hua et al. Reference Hua, Turnbull, Santos, Rakowski, Ancapichún, De Pol-Holz, Hammer, Lehman, Levin and Miller2022). This 14C spike provides an opportunity to utilize bomb-derived 14C as a tracer (Stenhouse and Baxter Reference Stenhouse and Baxter1977), and it has been used for studying atmosphere-ocean CO2 exchange (Nydal and Gislefoss Reference Nydal and Gislefoss1996), the global carbon cycle (Randerson et al. Reference Randerson, Enting, Schuur, Caldeira and Fung2002) and SOM dynamics (Karltun et al. Reference Karltun, Harrison, Alriksson, Bryant, Garnett and Olsson2005; Trumbore Reference Trumbore2009). Tree rings serve as an archive of atmospheric 14C records and those formed during the bomb pulse can be considered in situ 14C labeled (Hua et al. Reference Hua, Turnbull, Santos, Rakowski, Ancapichún, De Pol-Holz, Hammer, Lehman, Levin and Miller2022). Consequently, biochar made from this wood becomes 14C labeled biochar, albeit with a low level of 14C enrichment compared with most artificially labeled materials. In this study, the aim was to develop and test a method utilizing bomb 14C in tree rings for quantifying biochar mineralization in soil.
2. Methods
2.1. Bomb 14C enriched biochar
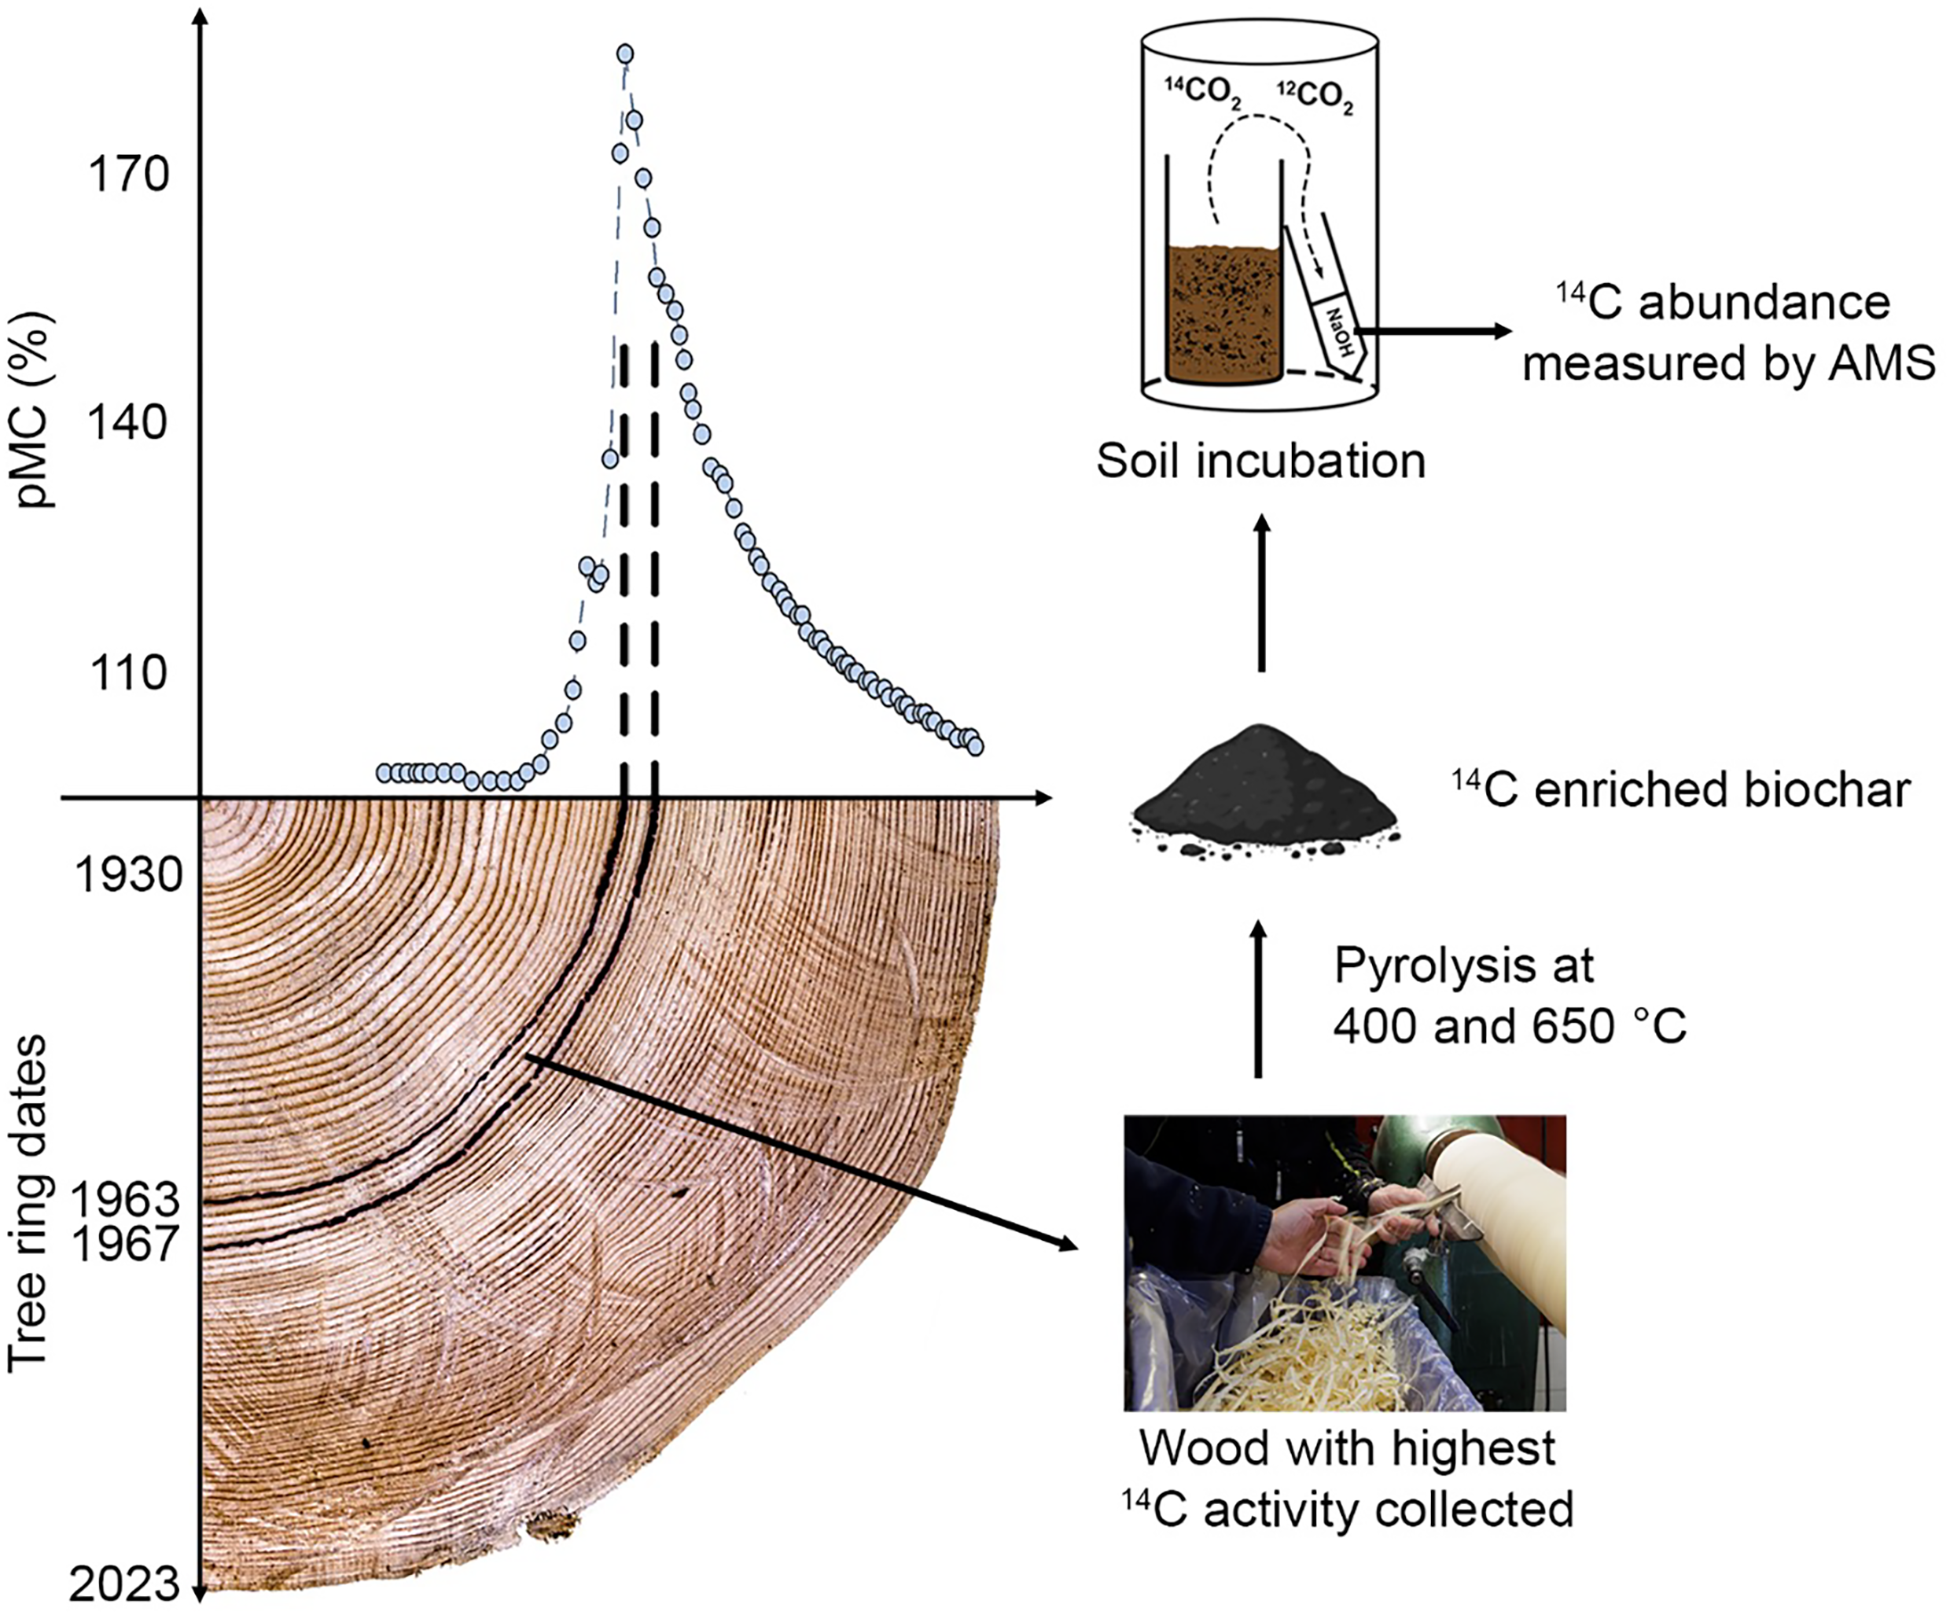
Six tree trunks, three Norway spruce (Picea abies, (L.) H. Karst.) and three Scots pine (Pinus silvestris, L.), at least 70 years old and with concentric year rings were chosen from a recent clear cut (60°01”20’N, 17°57’10’E) of a forest in Stavby, Uppsala County, Sweden in 2023. From each selected trunk, a piece around 50 cm in length, was cut with a chainsaw and transported to the lab. After careful inspection, one of the pine trunks was discarded because its tree ring pattern was deemed too irregular due to the presence of a large wood knot. To accurately identify the rings corresponding to the bomb-peak 14C period, we polished the ends of each trunk to enhance tree ring visibility. High-resolution photographs were then taken, and the annual rings were independently counted by two researchers. When rings were narrow, we examined the images at higher magnification. Before any rings were marked, both researchers reached a consensus on which of the rings that were formed during 1964–1967 (Figure 1). With the assistance of a wood artisan, the outer layers were removed by turning. Thereafter, the wood formed between 1964 to 1967 was carefully cut out by continued turning and retained as the 14C enriched wood material (Figure 1). Biochar was made from each the five 14C-enriched wood samples with a highest treatment temperature (HTT) of 550 °C under an N2-atmosphere (N2 gas flow of 300 L hr–1) in a muffle furnace (Carbolite model OAF 10/1 with a Nabertherm P330 control unit, Germany). The muffle furnace was heated to 105 °C and held for 30 minutes before further increase to the targeted pyrolysis temperatures. The heating rate was 10 °C min–1, with a holding time of 30 min at the targeted temperatures. The cooling rate was around 1 °C min–1. The 14C abundance of the five biochars was measured using accelerator mass spectrometry (AMS) (see section 2.4). For the incubation experiment, the biochar feedstock with the highest 14C abundance, one of the Norway spruce samples, was selected for production of two biochars at HTTs of 400 °C and 650 °C. The yields of biochar pyrolyzed at 400 °C (BC400) and 650°C (BC650) were 28% and 13%, with the organic carbon content 69.6 wt% and 81.6 wt%, and the hydrogen/organic C molar ratio 0.55 and 0.28, respectively.
2.2. Soil collection and preparation
The soil used for incubation was collected from a crop field located south of Ulleråker (59°49’34.8”N, 17°39’22.3”E), Uppsala, Sweden. Visible detritus, plant materials and stones were manually removed, and soils were sieved using a 4 mm mesh size. The sieved soil was stored in sealed bags at 4 °C until the pre-incubation began. The soil type is Cambisol according to World Reference Base (IUSS Group 2014) and the soil texture of the topsoil was classified as loamy sand (10.2% clay and 80.2% sand) and contained 1.4 wt% of soil organic carbon (SOC) and 0.11 wt% total nitrogen (N), with a pH value of 5.03 (1:5 0.01 M CaCl2).
2.3. Soil incubation
Prior to the start of the incubation, the field-moist soil was pre-incubated at 20.7 ± 0.2 °C for 18 days to allow soil microbial activity to stabilize and to avoid a sudden flush of CO2 at the onset of incubation. Before the incubation, biochar samples were ground in a mortar to achieve a particle size < 2 mm. The biochars were then pre-treated with acid to remove carbonates formed during the pyrolysis process. During the pre-treatment the biochars were soaked in 0.1 M HCl for 12 hr with occasional stirring, then the slurry was adjusted to a pH value of 5.5 by titrating with 0.02 M NaOH. Subsequently, the biochars were washed with deionized water, oven-dried and homogenized.
The two types of biochars (BC400 and BC650) were added at an application rate of 2% of the dry soil mass. After thoroughly mixing the biochar with the soil, 94.25 g dry-soil equivalent moist soil with 1.88 g biochar was transferred into plastic vials with a height of 10 cm and a diameter of 5 cm. The soil cores were gently packed by tapping to reach a height of 4 cm and a bulk density of 1.2 g cm–3. A control soil without biochar addition was also included. Each treatment had three replicates. The soil moisture content was adjusted to 60% water holding capacity and the soil vials were placed inside 1 L airtight glass jars along with two smaller plastic vials containing 20 mL 0.2 M NaOH (Figure S1). The jars were incubated in the dark at 20.7 ± 0.2 °C. To correct for the potential atmospheric CO2 trapped in the NaOH solution, two blanks without soil or soil/biochar mixture were also included. Prior to incubation, the airtightness of the glass jars was checked by monitoring changes in electrical conductivity in closed glass jars containing only NaOH traps.
To monitor the evolution of total CO2 emissions over the experimental period, changes in the electrical conductivity in one NaOH trap inside each jar were measured using a conductivity meter (Metrohm, Switzerland) on days 14, 42, 84, 164, 240 and 365. The parallel NaOH trap was collected and sent for 14C analysis using AMS. For 14C analysis, each treatment had three replicates, except for the NaOH traps from the control soils on days 14, 42 and all treatments on days 240 and 365, which were combined to one sample. Upon replacing the NaOH traps, deionized water was added to the soil to maintain soil moisture content at 60% water holding capacity.
2.4. 14C analysis
The 14C isotopic abundance and the 13δ C signature was determined for biochar, soil and carbonate samples trapped in NaOH solution using the AMS facility at the Tandem Laboratory, Uppsala University. Prior to isotope analysis, biochar and soil sample preparation included an acid-alkali-acid pre-treatment. This procedure included immersion in 0.3 M HCl and 0.3 M NaOH solutions slightly below the boiling point for 10 hr in each solution, followed by addition of concentrated HCl. Subsequently, the samples were combusted and graphitized using the Fe-catalyst reaction (Hellborg and Skog Reference Hellborg and Skog2008). Similarly, carbonate samples trapped in the solution were pre-treated with HCl to release CO2, which was then graphitized using the Fe-catalyst method.
All abundances are expressed as percent modern carbon (pMC), which is conventionally expressed as a percentage and defined as
 $pMC = \;{{{A_{SN}}} \over {{A_{ON}}}}$
, where A
SN
is the normalized radiocarbon activity and A
ON
is the normalized radiocarbon activity for an oxalic acid standard that corresponds to 0.95 of this standard if measured in 1950 (Stenström et al. Reference Stenström, Skog, Georgiadou, Genberg and Mellström2011).
2.5. Biochar mineralization estimation
The fraction of biochar-derived CO2 (f biochar-CO2 ) over total CO2 emissions was calculated with equation (1),
 \begin{equation}{f_{biochar - C{O_2}\;}} = {{{A_{total - C{O_2}\;}} - \;{A_{control - C{O_2}}}} \over {{A_{biochar\;}} - \;{A_{control - C{O_2}}}}}\end{equation}
where
 ${A_{biochar{\rm{\;}}}}$
and
 ${A_{control - C{O_2}}}\;$
are the 14C abundances of the biochar and the CO2 emitted from the control soil, respectively, and where
 ${A_{total - C{O_2}{\rm{\;}}}}$
denotes the 14C abundance in CO2 emitted from biochar-amended soil.
2.6. Priming effect
The priming effect (PE) of SOC mineralization induced by biochar amendment was calculated using the following equation (Mendoza et al. Reference Mendoza, De Neve, Deroo, Li, Françoys and Sleutel2025).
 \begin{equation}PE = {{C{O_2}{\rm{ - }}{C_{SOC}} - C{O_2}{\rm{ - }}{C_{control}}} \over {C{O_2}{\rm{ - }}{C_{control}}}}\end{equation}
where
 $C{O_2}{\rm{ - }}{C_{SOC}}$
and
 $C{O_2}{\rm{ - }}{C_{control}}$
are native SOC mineralization in biochar amended soils and C mineralization from the control soil, respectively.
2.7. Statistics
The statistics were conducted in R (version 4.1.2) and in SAS (SAS Institute Inc, USA). To test whether the 14C abundance of CO2 differed between the biochar-amended soil and the control, we applied linear mixed models (LMMs) with “treatment” as a fixed effect and “1 | incubation time / replicates” as nested random effects to account for the hierarchical nature of our experimental design. We applied the lme function of the nlme-package to fit our models (Zuur et al. Reference Zuur, Ieno, Walker, Saveliev and Smith2009). One-way ANOVA followed by a Tukey’s post-hoc test was used to evaluate the differences in biochar C mineralization between BC400 and BC650. The least significant difference (LSD) for the 14C and 13C isotopic ratios was calculated using the Proc ANOVA procedure in SAS.
3. Results and discussion
3.1. Quantifying biochar C mineralization using bomb 14C
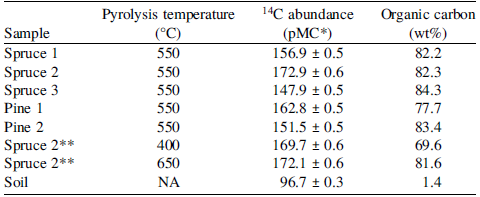
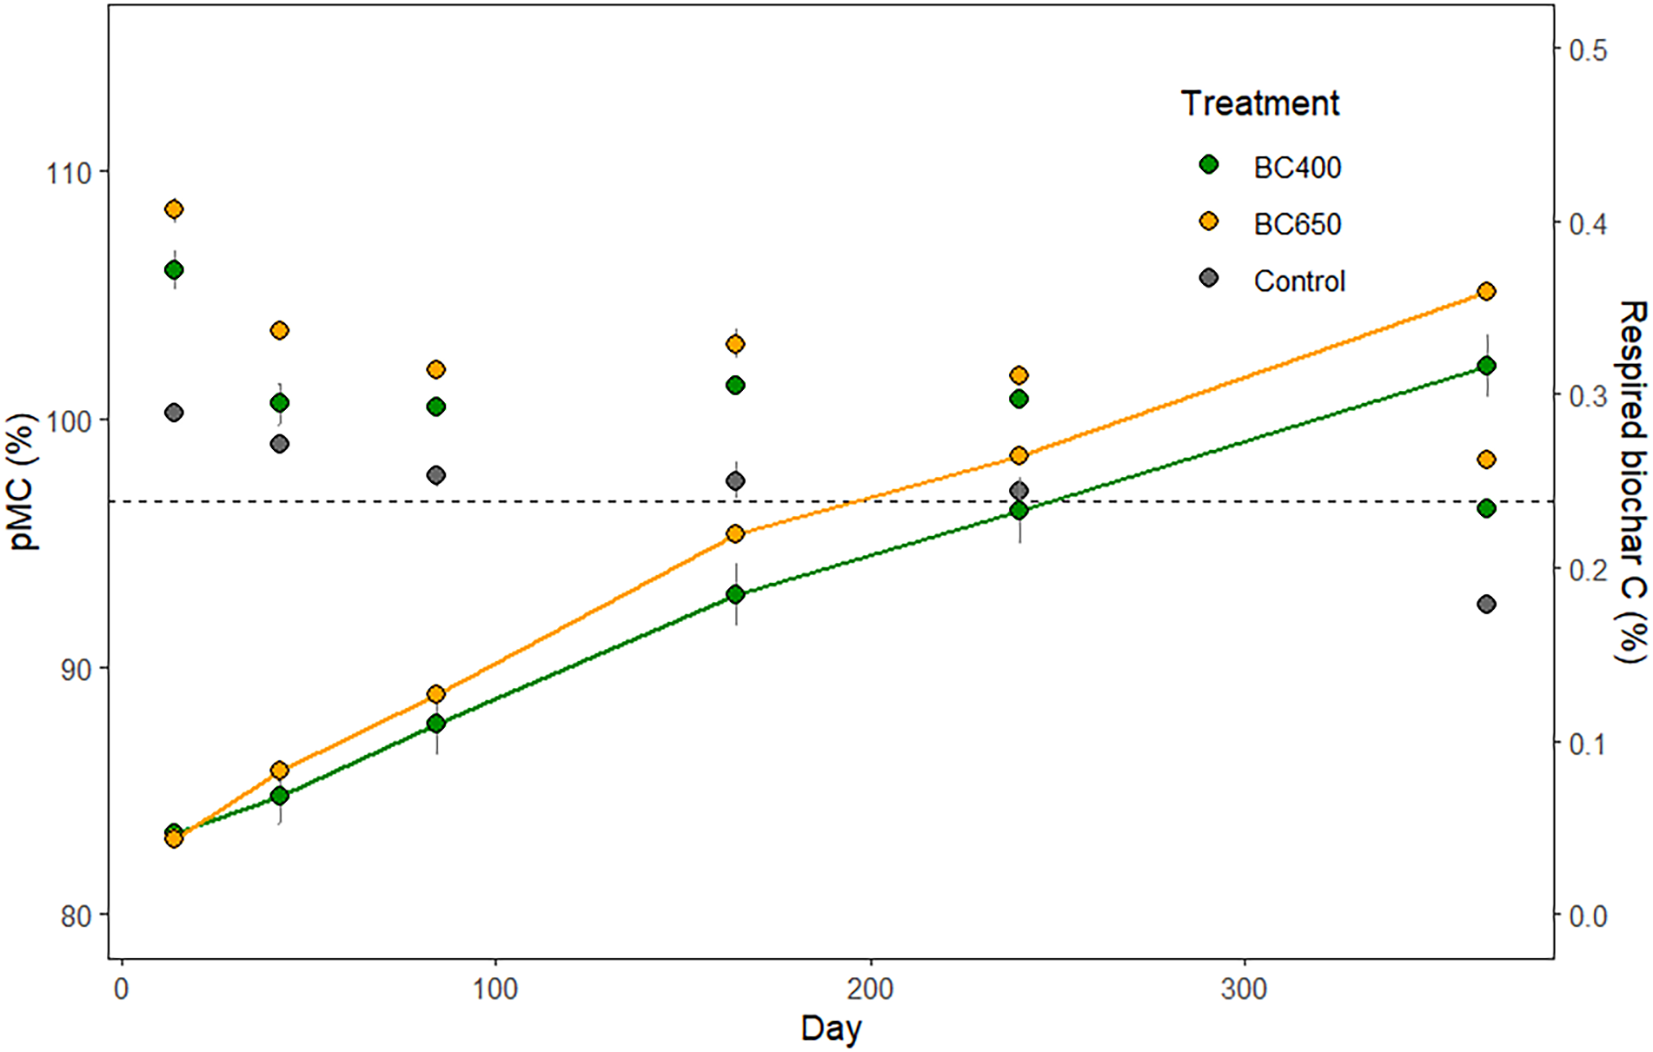
Biochar produced from the wood formed during the bomb pulse (1964–1967) was on average 61.7 pMC higher than bulk SOM (Table 1). The 14C abundance in the sampled tree with the highest enrichment (172.9 pMC) closely matched the average atmospheric 14C concentration (173.8 pMC) in the northern hemisphere between 1964 and 1967 (Hua et al. Reference Hua, Turnbull, Santos, Rakowski, Ancapichún, De Pol-Holz, Hammer, Lehman, Levin and Miller2022). We found that biochar C mineralization can be precisely differentiated from SOM mineralization (Figure 2). When incubating 14C enriched biochar in soil, the 14CO2 abundances from soil-biochar mixtures were consistently higher compared to those from the control soil (p < 0.0001). Using an isotope-mixing model and with a 2% biochar application rate, we estimated that 8.3–11.4% of mineralized CO2-C was derived from biochar during the first two weeks and this fraction decreased to 2.3–7.5% during the later stage of the incubation. This result is consistent with other studies using 13C natural abundance (Rasse et al. Reference Rasse, Budai, O’Toole, Ma, Rumpel and Abiven2017) or isotopically labeled biochar (Santos et al. Reference Santos, Rice, Bird and Berhe2021). The accumulated difference in respired C from the two different biochars pyrolyzed at 400 °C (BC400) and 650 °C (BC650) was not significantly different. For biochars produced at 400 and 650 °C, we estimated that in total 0.32 ± 0.02% and 0.35 ± 0.01% of the added biochar C was mineralized after one year of incubation, respectively (Figure 2).
14C abundance and organic carbon content of the biochars and soil, with standard deviation derived from AMS 14C measurements.

Table 1. Long description
A table comparing pyrolysis temperature, carbon-14 abundance, and organic carbon content for various samples. The table has 8 rows and 4 columns. The columns are labeled Sample, Pyrolysis temperature (degrees Celsius), 14C abundance (pMC), and Organic carbon (weight percent). The rows are labeled with different samples: Spruce 1, Spruce 2, Spruce 3, Pine 1, Pine 2, Spruce 2** at 400 degrees Celsius, Spruce 2** at 650 degrees Celsius, and Soil. Each row provides the pyrolysis temperature, 14C abundance with standard deviation, and organic carbon content for the respective sample. Notable trends include variations in 14C abundance and organic carbon content across different samples and pyrolysis temperatures.
* pMC (percent modern carbon), see definition in section 2.4.
** The wood with the highest 14C abundance was selected and pyrolyzed at 400 and 650 °C, respectively, producing the two biochars used in the incubation study.
Variation in 14C concentrations in the northern hemisphere, expressed as percent modern carbon (pMC), across the lifespan of the Picea abies sample used to produce the biochars for this study. The x-axis of the bomb peak was adjusted to match the variable widths of the tree rings. By counting the rings, we identified and marked out the section with the anticipated highest 14C enrichment. Wood from this section was then used as feedstock for biochar production and subsequent soil incubation.

Temporal trends in the 14C-CO2 signature respired from the control soil and two biochar amended soils (expressed as percent modern carbon (pMC), left y-axis, points) and the accumulated amount of respired biochar C (% of the added biochar C, right y-axis, line with symbols). Error bars present the standard error (n = 3). Note that for 14C analysis, each treatment had three replicates, except for the samples from the control on days 14, 42 and all treatments on days 240 and 365, where the samples were pooled. The differences in 14C-CO2 signature between biochar-amended soils and the ones from the control are statistically significant (p < 0.0001). The dashed line indicates the bulk SOC 14C signature (96.7 pMC). For the color interpretation, the reader is referred to the online version.

The addition of biochar to soil can influence SOC mineralization, either enhancing (positive priming) or suppressing (negative priming) decomposition (Feng et al. Reference Feng, Wang, Zimmerman, Wu, Lee, Chen and Zhang2024), which could impact the long-term carbon sequestration effect of biochar in soil. In this study, we were able to distinguish biochar-derived C mineralization from that of SOC (Figure 2). After one-year incubation, there was no significant priming effect on SOC by the BC400 treatment (1.7 ± 25 mg CO2-C kg–1) while BC650 induced a negative priming (–129 ± 20 mg CO2-C kg–1) (Figure S2). The priming effect relative to CO2 emitted from the control soil was 0.2 ± 0.9% and 14.8 ± 2.3% for the two treatments, respectively (Figure S3).
One potential source of bias could be introduced if the age and thereby also the 14C abundance of SOC is influenced by priming differs from the average age of the SOC being respired. A negative priming that selectively suppresses respiration of young SOC fractions would cause us to underestimate the fraction of total respiration that is attributed to biochar. This in turn would lead us to underestimate priming by the same magnitude, since this is also derived from the mixing model. To estimate the upper bounds of any such bias potentially introduced by selective priming effects, we ran a sensitivity analysis (see further details in supplementary materials) using the measured 14C signature of the two biochars (170–172 pMC) and control soil CO2 (93–100 pMC), while assuming that the negative priming selectively suppresses only young SOC, enriched by ∼8 pMC relative to older fractions. This enrichment corresponds to the shift in control soil over the one-year incubation, which we think represents a shift from respiration of predominantly freshly added to older SOC fractions. With these assumptions, the biochar-derived CO2 fraction would be underestimated by approximately 0.10–0.12 percentage points for each percent of negative priming. For the observed priming magnitude of 14.8% for BC650, this corresponds to an absolute bias of around 1.5%. Notably, any such potential bias introduced by selective priming would also be present in studies relying on natural abundance differences. The variations in 13C/12C ratios within SOC due to the Suess effect are relatively small (about 1–2‰), reflecting both the decline in atmospheric δ13C and changes in plant discrimination associated with rising atmospheric CO2, particularly in C3 plants. The isotopic contrast between 13C-depleted biochars and SOC is also much smaller than in our case, meaning that the relative bias would be of about the same magnitude.
3.2. Implications for studying biochar C dynamics in soil
Globally, biochar has a significant potential to increase C sequestration in soil (Smith Reference Smith2016; Woolf et al. Reference Woolf, Amonette, Street-Perrott, Lehmann and Joseph2010). However, the long-term persistence of biochar and its effects on the turnover of SOM remain unclear, partly due to methodological constraints. The proposed bomb C method has several advantages over established isotope methods. It offers a higher precision as compared to the 13C natural abundance method. Based on our measurements of pMC and δ13C we calculated the least significant difference (LSD) between two groups (α = 0.05, n = 3) for the bomb C method and for the 13C natural abundance method that is based on the difference in isotopic discrimination between C3 and C4 plants. The LSD (n = 3) were 2.6 pMC for the bomb carbon method and 13δ 2.5‰ for the natural abundance method. Even though the LSD figures were similar, the ability to detect significant differences in respired CO2 differed due to the difference in distance between end members of the two methods. Using end members of 13δ –28‰ for C3 plants and 13δ –14‰ for C4 plants and 172 pMC and 100 pMC for bomb C biochar and respired CO2 from untreated soil, we calculated that the 13C natural abundance method would only be able to differentiate between sources when the biochar contribution to respired CO2 is > 18%, while the bomb C method would be able to differentiate a biochar contribution > 3.7%. In addition, since most wood materials are from C3 plants, the natural abundance 13C method is not applicable for differentiating mineralization of wood biochar from that of SOM, except in occasions where SOM mainly is derived from C4 plants. Production of bomb 14C enriched biochar is less costly compared to labeling techniques for biochar such as pulse labeling of biochar feedstock biomass with 13C and does not require advanced facilities. The high cost of the labeled material may impact study design, potentially explaining why biochar mineralization is investigated at low biochar doses (< 0.3%) in studies using this type of labeling (Kuzyakov et al. Reference Kuzyakov, Bogomolova and Glaser2014; Santos et al. Reference Santos, Rice, Bird and Berhe2021). The bomb C method allows production of traceable biochar from mature wood, making it more representative of commercial biochars compared to those using pulse labeling techniques. Normally, 13C labeling of wood biomass is achieved by growing tree seedlings in a 13CO2 enriched or depleted atmosphere, while most commercial wood biochars are produced from mature wood. Differences in properties, such as higher nitrogen and lower lignin content in young seedlings compared to mature wood (Melillo et al. Reference Melillo, Aber and Muratore1982), might impact biochar properties and its persistence in soil. Moreover, the trees we sampled were continuously exposed to the 14CO2 enriched atmosphere of the 1960s, resulting in a relatively uniform labeling of the bomb 14C biochar, whereas pulse labeling can result in non-uniform distribution of 13C or 14C, potentially affecting the accuracy of biochar mineralization estimates.
Currently, studying biochar dynamics under field conditions often relies on the isotopic differences in natural abundance 13C between C3 and C4 plants (Rasse et al. Reference Rasse, Budai, O’Toole, Ma, Rumpel and Abiven2017; Ventura et al. Reference Ventura, Alberti, Panzacchi, Vedove, Miglietta and Tonon2019), which makes it challenging for studying wood biochar. The bomb 14C method enables the production of 14C enriched wood biochar in larger quantities, which is an advantage over conventional isotopic labeling methods. For instance, an 80-year-old wood trunk (0.5 m in length) can yield approximately 1 kg of dry 14C enriched wood biomass. Thus, enough 14C enriched material can be produced for both mesocosm and small-scale field studies. With the experimental condition for our study, the contribution of biochar-derived CO2 to total CO2 emissions from soil should be at least 3.7% to be detectable. This contribution is influenced by the biochar application rate. In this study, biochar was added to soil at a rate of 2% by mass, corresponds to 24 t ha–1, assuming a mixing depth of 10 cm and a soil bulk density of 1200 kg m–3. This application rate is commonly used in incubation studies, indicating that the bomb 14C method is precise enough for a typical biochar application. In addition, although we only examined mineralization of biochar in one soil type, these results can be generalized to soils elsewhere, as the background 14C in most surface soils is close to the studied soil (Leifeld and Mayer Reference Leifeld and Mayer2015; Rethemeyer et al. Reference Rethemeyer, Kramer, Gleixner, John, Yamashita, Flessa, Andersen, Nadeau and Grootes2005; Shi et al. Reference Shi, Allison, He, Levine, Hoyt, Beem-Miller, Zhu, Wieder, Trumbore and Randerson2020).
There are also limiting factors to consider when using bomb 14C enriched biochars. While producing bomb 14C-enriched biochars can be done at a reasonable cost, the high expense of AMS 14C analyses may be a limiting factor. Advances in AMS technology, such as the development of more compact and low-energy systems, has reduced costs (Ramsperger et al. Reference Ramsperger, De Maria, Gautschi, Maxeiner, Müller, Synal and Wacker2023; Synal and Wacker Reference Synal and Wacker2010), but are unlikely to result in substantial cost reductions in the near future. In addition, the feedstock for 14C enriched biochars must be selected carefully. Since the bomb 14C peak is around 1964, the selected trees should preferably have germinated before or around 1950 to ensure sufficient biomass for sampling and have distinct and concentric growth rings that allow for accurate identification of the relevant years. Even with precautions, variability in 14C signature in wood during may arise during the wood collection, as the 14C bomb peak is narrow and tree rings seldom are perfectly concentric. Although samples were finely ground to improve mixing, complete homogeneity cannot be assumed because 14C may vary within a single tree ring as high-resolution studies have shown intra-annual variability in tree-ring 14C during the bomb-peak period (Svarva et al. Reference Svarva, Grootes, Seiler, Stene, Thun, Værnes and Nadeau2019).
4. Conclusions
Our results suggest that the bomb 14C method for estimating biochar C mineralization in soil has several advantages over other isotopic approaches. The method provides higher precision than the 13C natural abundance method. Bomb 14C biochar is derived from uniformly enriched mature wood, which resembles a common feedstock used in commercial biochars. Moreover, bomb 14C enriched biochar can be produced at a reasonable cost and in quantities sufficient for small-scale field studies. One potential drawback is that the AMS 14C analysis cost is high but due to the high precision of the method the number of experimental repetitions can be kept low. Overall, we show that bomb 14C biochar-based methods could be a useful tool to trace biochar C dynamics in soils and thus improve our understanding of biochar C sequestration and its potential to mitigate global climate change.
Supplementary material
To view supplementary material for this article, please visit https://doi.org/10.1017/RDC.2026.10247
Acknowledgments
This work was funded by the Swedish Energy Agency (grant number: P2021-00117) and the Royal Swedish Academy of Agriculture and Forestry (grant number: GFS2023-0058). The authors would like to thank Dr. Anita Pettersson at University of Borås for her advice on biochar production, Dr. Fredrik Klang and co-workers at Sveaskog for facilitating the wood sampling and wood artisan Åke Landström for cutting out the tree ring wood samples. We also thank Dr. Shengmin Zhang for his suggestions on data analysis. Lastly, we appreciate the technical staff at the Tandem Laboratory at Uppsala University for their expertise in 14C analysis.
Author contribution
Haichao Li: Formal Analysis, Funding Acquisition, Investigation, Methodology, Visualization, Writing – Original Draft, Writing – Review and Editing
Harald Cederlund: Funding Acquisition, Methodology, Visualization, Writing – Review and Editing
Elias S. Azzi: Funding Acquisition, Writing – Review and Editing
Cecilia Sundberg: Funding Acquisition, Writing – Review and Editing
Erik Karltun: Conceptualization, Funding Acquisition, Methodology, Writing – Review and Editing, Resources, Supervision
Competing interests
Elias S. Azzi reports a relationship with Puro. Earth Oy that included consulting or advisory at the time when the research was conducted.


 Open access

