Introduction
The performance of optoelectronic nanoscale devices is primarily dictated by the structure and the characteristics of the semiconductor materials used in these devices. Extensive efforts have been made to improve the overall efficiency of the devices.Reference Matterson, Lupton, Safonov, Salt, Barnes and Samuel1–Reference Kwon, Kim, Kim, Park, Cho, Byeon and Park5 Interface band engineering in particular plays a key role in improving the efficiency. Radiative recombination occurs at the interface, and device efficiency is dependent on the quality and band structure at the interface.
The piezo-phototronic effect was first proposed in 2010 and demonstrated in optoelectronic nanoscale devices (please also see the Introductory article in this issueReference Wang, Wu and Falconi6) in order to enhance the performance of devices based on piezoelectric nanowires (NWs).Reference Wang7–Reference Pan, Chen, Yu, Yang, Hu, Zhang and Wang9 Compared to other traditional techniques, the piezo-phototronic effect with three-way coupling among piezoelectric, semiconductor, and photonic properties in noncentrosymmetric semiconductor materials can serve as an effective means of tuning charge separation, transport, or recombination to optimize the performance of the device.Reference Qi, Lan, Stieg, Chen, Zhong, Li, Chen, Zhang and Wang10,Reference Chen, Pan, Zhang, Li, Liang and Wang11 Moreover, although piezo-phototronic devices use traditional piezoelectric materials, the piezo-phototronic effect affects the band structure in such a way that the device efficiency is much higher than that for traditional devices constructed from the same materials. In addition, the efficiency can be tuned even after the device has been fabricated.
Further, the dependence of the intensity of a NW array-based light-emitting diode (LED) on external strain would open a new window for mapping strain when this system is used as an optical signal-based pressure sensor (so-called electronic skin). Human tactile sensation has always been a challenge to reproduce in artificial intelligence and robotics, due to the difficulty of obtaining pressure sensor arrays that have high spatial resolution, have a rapid response, are flexible, and can be integrated on a large scale. Such nanoscale pressure sensitive LED arrays based on the piezo-phototronic effect could provide a solution to this problem. The output signal is electroluminescence light that can be easily integrated with on-chip photonic technologies for fast data transmission, processing, and recording.
In this article, we review recent work on improving the luminous efficiency and intensity of NW-based photodetectors, solar cells, and LEDs through the piezo-phototronic effect. First, we introduce the basic principle of the piezo-phototronic effect and the materials used in piezo-phototronic devices. We discuss improvements in the performance of a number of piezo-phototronic NW-based photodetectors, solar cells, and LEDs to show its general impact. Finally, we demonstrate an optical signal-based pressure sensor for the fast mapping of strain at the micrometer scale based on light emission intensity tuning by the piezo-phototronic effect. These studies not only clarify the fundamental science behind piezo-phototronic optoelectronic nanoscale devices, but also provide information for new applications of piezo-phototronic devices.
Basic principle and materials for piezo-phototronic devices
Two-way coupling between the piezoelectric effect and semiconducting properties plays a remarkable role in the piezotronic effect under applied strain. In contrast to the piezotronic effect, the piezo-phototronic effect modulates the optoelectronics process to the targeted nanosystem, resulting in a complicated three-way coupling among piezoelectric, semiconducting, and photoexcitation characteristics.Reference Hu, Chang, Fei, Snyder and Wang12–Reference Yu, Wang, Wu, Pan, Bando, Fukata, Hu, Peng, Ding and Wang17 Besides the well-known coupling of semiconductors with piezoelectric materials for optoelectronics, the coupling between the semiconductor and the photon excitation process also informs the field of optoelectronics, and between piezoelectricity and photon excitation informs the field of piezo-phototronics.Reference Yang, Guo, Wang, Zhang, Xu, Lien and Wang8
One-dimensional nanoscale semiconductor structures that show the piezo-phototronic effect are ideal materials for fabricating tunable optoelectronic devices; these include NWs of ZnO, GaN, and CdS.Reference Wang18–Reference Yu, Dong, Pan, Niu, Liu, Liu, Chua, Chi and Wang22 Of these potential candidates, ZnO is the best choice because it has excellent biocompatibility, is environmentally friendly, and can be conveniently grown on arbitrarily shaped substrates.
There are two methods to grow large-area arrays (a few millimeters) of ZnO NWs. The first is vapor–solid growth, which vaporizes ZnO powder in the presence of carbon on a prepatterned substrate (e.g., GaN, Si) upon the introduction of an Au catalyst. The growth temperature is approximately 900°C, and the growth quality of ZnO NWs can be regulated by pressure in the growth tube furnace. With this method, ZnO NWs have fewer defects. ZnO NW arrays can also be grown by a low-temperature hydrothermal method.Reference Wang23 These arrays, when compared with their vapor–solid grown counterparts, are more beneficial to the practical piezo-phototronic photoelectric devices because of their simpler growth conditions and prepatterned substrates, for example, flexible substrates patterned by photoresist, which cannot withstand high temperature. An oxygen plasma treatment while operating the device can reduce structural defects in ZnO NWs grown by this method.
Piezo-phototronic effect in photodetector devices
At the core of a piezo-phototronic device are internal piezoelectric polarization charges, which were induced by an applied strain, located at the interface with a metal contact. These charges tune the charge transport/separation process at the contact. Here, we introduce piezo-phototronic optoelectronic devices that can use this built-in piezoelectric field to modulate the carrier generation, separation, transport, and recombination processes at the interface to enhance the photoelectric process. The piezo-phototronic effect also influences the sensitivity of the photodetectors based on NWs. By changing the strain and stimulating the light intensity, the Schottky barrier height in the device can be modulated, which provides a window into the physical mechanisms of the piezo-phototronic effect, the optical effect, and semiconductor properties in piezo-phototronic photodetector devices.Reference Dong, Niu, Pan, Yu, Zhang and Wang24–Reference Zhang, Peng, Wu, Guo, Gao, Liu, Kou, Wen, Lei, Yu, Zhang, Zhai and Wang32
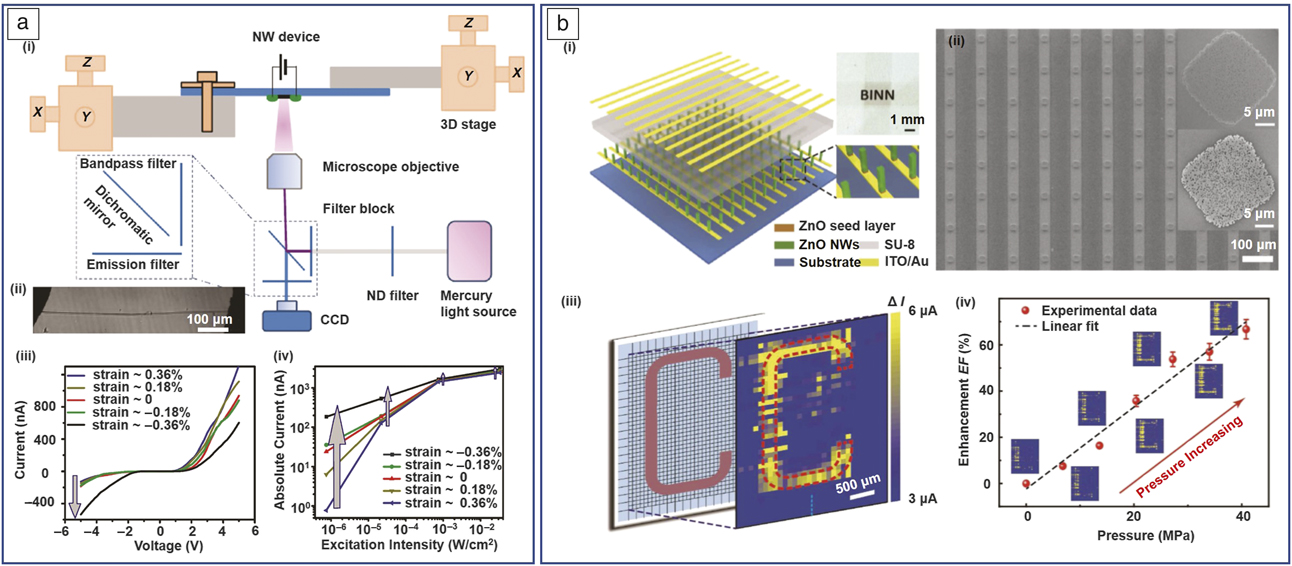
It has been shown that the responsivity of CdSe NW photodetectors (PDs) can be enhanced by the piezo-phototronic effect due to Schottky barrier height tuning through the piezopotential at the NW/metal electrode interface of the deviceReference Yang, Guo, Wang, Zhang, Xu, Lien and Wang8 (Figure 1a). The piezo-phototronic effect under compressive strain increases the internal electric field of the Schottky barrier and assists in the separation of photoexcited electron–hole pairs, resulting in an increase in the photocurrent. Pan et al. reported a UV photodetector array, consisting of 32 × 40 pixels based on vertically aligned ZnO NWsReference Han, Du, Yu, Pan and Wang26 (Figure 1b), that is a single piezo-phototronic effect photodetector sensor. Each pixel is composed of ZnO NWs and Au nanopatterns that form a Schottky contact. By introducing the piezo-phototronic effect, the strain-induced piezoelectric polarization charges effectively enhance the performance of the UV PD array by 700% in photoresponsivity, 600% in sensitivity, and 280% for the detection limit.Reference Han, Du, Yu, Pan and Wang26
The piezo-phototronic effect in a nanowire (NW) photodetector (PD) array. (a[i, ii]) The measurement system used, and (iii, iv) device performance tuned by the piezo-phototronic effect. (ii) Optical microscope image of the device based on ZnO NWs. (iii) Current–voltage (I–V) curves and (iv) absolute photocurrent of the device under different strains. The arrows show the direction of strain change. It can be seen that the photocurrent is largely enhanced for pW level light detection, and the weak light detection is more sensitive by using the piezophototronic effect.Reference Wang7 (b[i]) (Left) Schematic illustration of the structure of the ZnO NW-based ultraviolet (UV) PD array. (Right) Optical image of the as-fabricated device. (ii) Scanning electron microscope image of the as-fabricated device before spin-coating a layer of SU-8 photoresist. The insets are (upper) before (upper) and (lower) after spin-coating a layer of SU-8. (iii) Current difference between strain free and 40.38 MPa pressure conditions, with illumination intensity of 1.38 mW cm2 and forward bias voltage of 1 V on the top electrode. (iv) The plot shows the enhancement factor, EF, as a function of the applied pressure, with the corresponding output currents to image the illumination distributions at an illumination intensity of 1.38 mW cm–2.Reference Han, Du, Yu, Pan and Wang26 Note: ND, neutral density; CCD, charge-coupled device; ITO, indium tin oxide.

Piezo-phototronic effect in solar-cell devices
During charge-carrier separation and transport in solar cells, the device efficiency can be regulated by the energy band at the semiconductor/semiconductor or semiconductor/metal interface of the device, which can be reduced by the piezo-phototronic effect. In this section, we discuss the influence of the process and principle of the piezo-phototronic effect on the efficiency of solar-cell devices based on piezo NWs, and performance improvements in NW solar-cell array devices.Reference Zhu, Wang, Xue, Chen, Fu, Feng, Li and Wang33–Reference Zhu, Wang, Pan, Chen, Xue, Chen, Yang, Su and Wang40
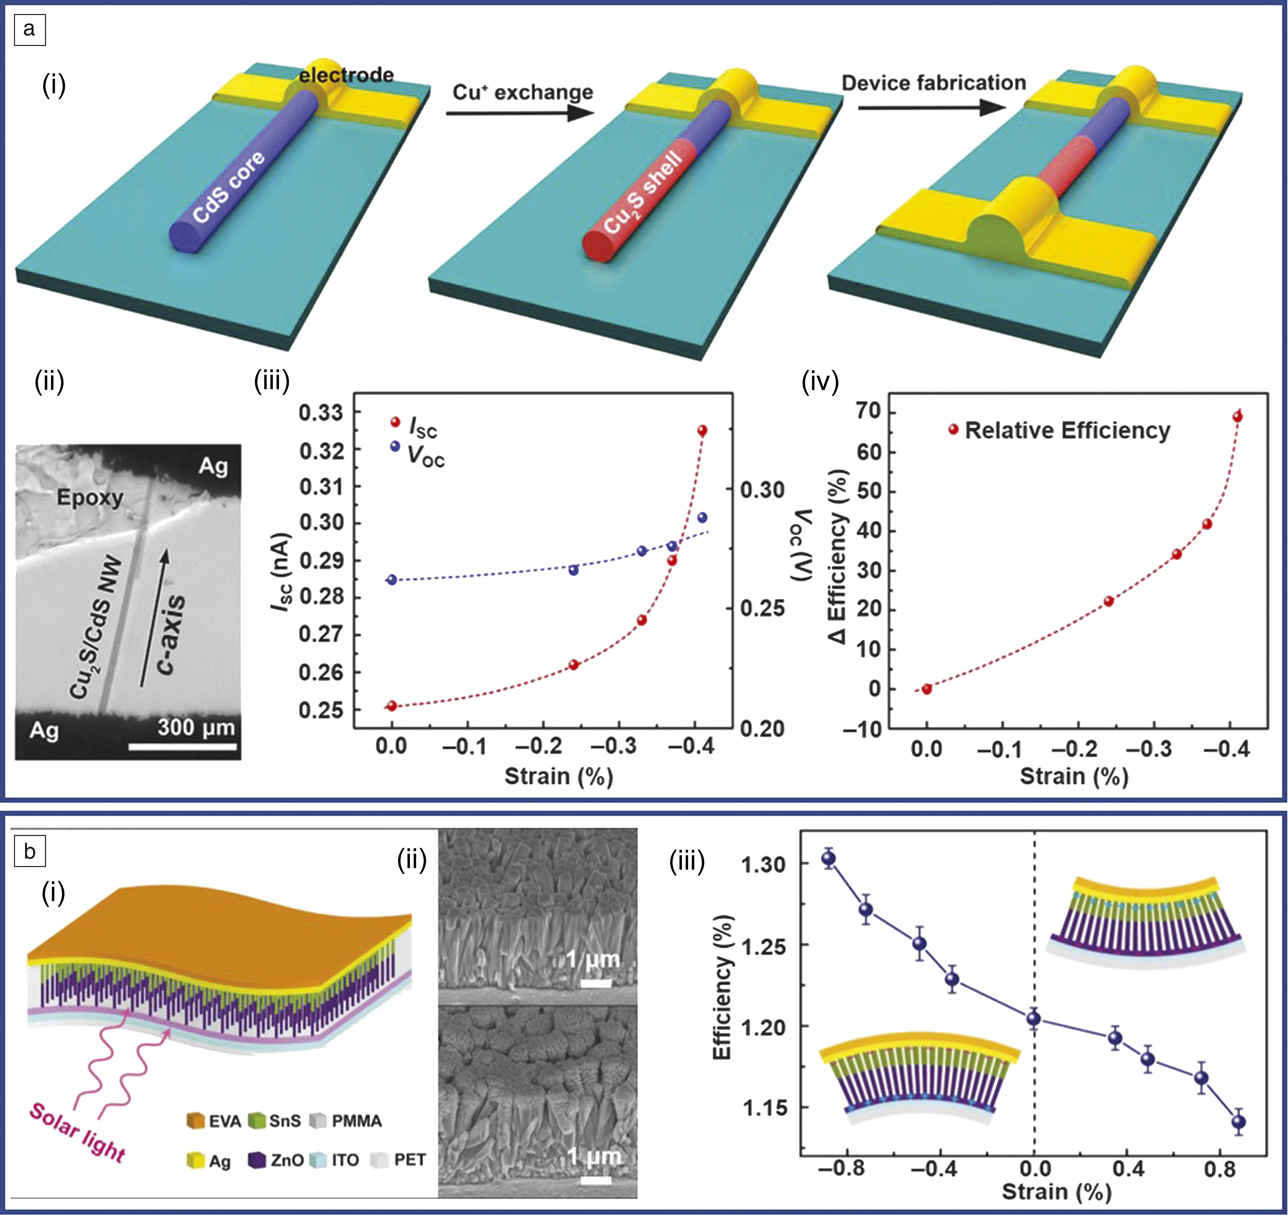
Pan et al. demonstrated a new n-CdS/p-Cu2S coaxial NW-based photovoltaic device. The performance of the devices were controlled via the piezo-phototronic effect. A schematic of the device structure is shown in Figure 2a.Reference Zhu, Wang, Xue, Chen, Fu, Feng, Li and Wang33 The piezo-phototronic effect could be used to control electron−hole pair generation, transport, separation, or recombination, thus enhancing the efficiency of the devices as high as 70%. As shown in Figure 2b, the piezo-phototronic effect of a ZnO NW array can be used as the driving force to promote the separation and transport of carriers by adjusting the band structure at the heterojunction in the core–shell NW.Reference Pan, Niu, Ding, Dong, Yu, Liu, Zhu and Wang35 The efficiency of this flexible n-ZnO/p-SnS core–shell NW array solar cell can be effectively improved up to 37.3% under moderate vertical pressure by applying the piezo-phototronic effect. The results of this research show the potential of piezo-phototronics for high-performance large-scale flexible solar-cell applications.
The piezo-phototronic effect shown for nanowire (NW) array solar cells. (a[i]) Schematic diagram and the device fabrication process. (Left) First, a CdS NW with a metal contact at one end is partially immersed into a CuCl solution to (middle) form the Cu2S shell, and then (right) the metal contact at the other end was fabricated on the Cu2S shell; (ii) an optical microscope image of the Cu2S/CdS coaxial NW solar cell. Dependence of (iii) the open-circuit voltage (V oc), the short-circuit current (I sc), and (iv) relative efficiency change with strain. The relative conventional efficiency change of this photovoltaic (PV) device increased about 70% when a –0.41% compressive strain was applied.Reference Zhu, Wang, Xue, Chen, Fu, Feng, Li and Wang33 (b[i]) Schematic of the as-synthesized flexible solar cell based on an n-ZnO/p-SnS core–shell NW array. (ii) Cross-sectional scanning electron microscope image of the morphology of the as-synthesized ZnO NW array. (Upper) Side view of the morphology of the as-synthesized ZnO NW array. (Lower) Side view of the morphology of the n-ZnO/p-SnS core–shell NW array. (iii) Bending strain dependence of the solar energy-conversion efficiency. The performance of this PV device is enhanced when the NW array is subjected to a compressive strain (downward-bending strain) and is decreased when subjected to a tensile strain (upward-bending strain).Reference Pan, Niu, Ding, Dong, Yu, Liu, Zhu and Wang35 Note: EVA, ethylene vinyl acetate copolymer; PMMA, poly(methyl methacrylate); ITO, indium tin oxide; PET, poly(ethylene terephthalate).

The piezo-phototronic effect in NW LED devices
The efficiency of carrier injection, recombination, and light extraction are decisive factors controlling light emission from semiconductors. The piezo-phototronic effect can enhance the performance of LEDs, as has been shown for different LED structures.Reference Wang41–Reference Huang, Jiang, Du, Jing, Liu, Hu and Wang52 We introduce research for improving the emission light intensity and efficiency of three types of single NW-based LEDs through the piezo-phototronic effect.
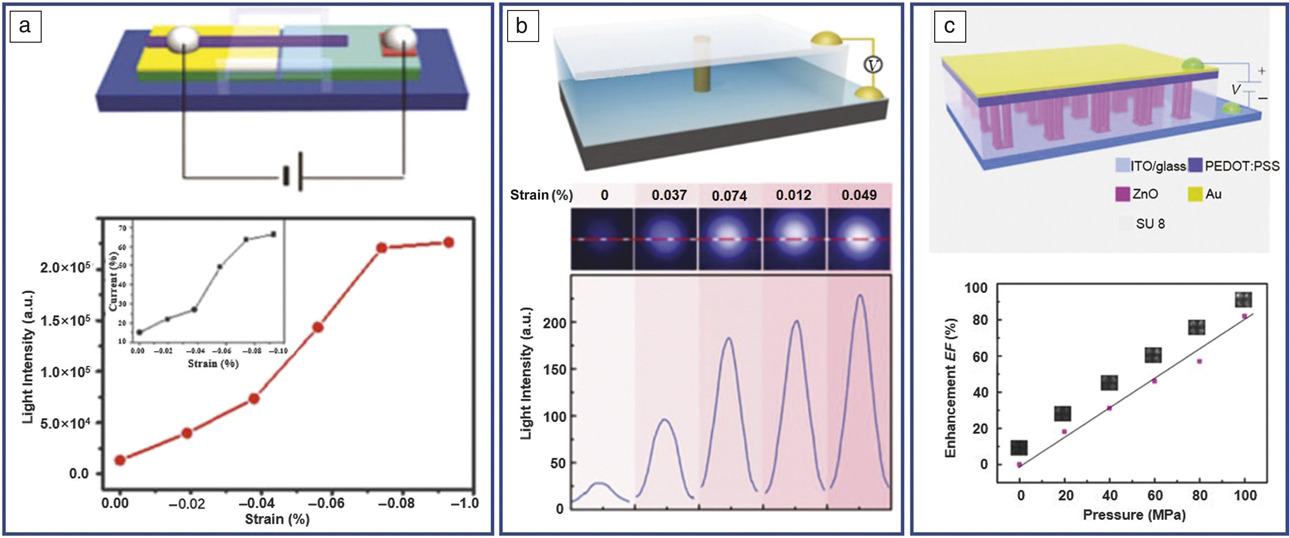
A single NW inorganic hybrid p–n junction LED is schematically shown in Figure 3a. This LED was fabricated by manipulating an n-type ZnO wire on a p-type GaN film doped with Mg. The emission light intensity and injection current at a fixed applied voltage were enhanced by a factor of 17 and 4, respectively, upon application of a compressive strain of 0.093% along the a-axis.Reference Yang, Wang, Xu and Wang42 A vertical single-wire n-ZnO NW grown on a GaN substrate LED device is shown in Figure 3b.Reference Pan, Chen, Yu, Yang, Hu, Zhang and Wang9 The UV light emitted from the single-wire LED under different applied strains was recorded by a charge-coupled device (CCD), and simultaneously, the corresponding light intensities were obtained. The emission intensity increased significantly with increasing compressive strain. When the c-axis was under a compressive strain of –0.149%, the emission intensity was enhanced approximately 9× in magnitude compared to the unstrained case.
Nanowire light-emitting diode (NW LED) device controlled by the piezo-phototronic effect. (a) (Upper) Schematic and (lower) plot showing enhancement of emission light intensity with increasing strains for a single inorganic hybrid NW p–n junction LED. The device was fabricated with Mg-doped p-type GaN film and an n-type ZnO NW. The inset is the injection current of the LED at a voltage bias of 9V with increasing strain. Under the influence of the piezo-phototronic effect, the injection current of the device increases by 4×, and the output light intensity increases by 17×. This indicates that the corresponding conversion efficiency was improved by a factor of 4.25.Reference Yang, Wang, Xu and Wang42 (b) (Upper) Schematic and (lower) plot showing light emission enhanced with increasing applied strains for a vertically grown p–n junction single NW LED. (Lower) Emission intensity profile of the same location of the LED (marked with red dashed line). The emission intensity increased significantly with compressive strain. (c) (Upper) Schematic of the flexible piezo-phototronic hybrid NW array. (Lower) The plot shows enhanced light emission of the device with increasing pressures. The images show changes in the light intensity under different pressures for the same four pixel points.Reference Li, Liang, Tao, Xu, Peng, Han, Wang, Wang, Zhu, Pan and Wang49 Note: V, voltage; ITO, indium tin oxide.

A piezo-phototronic effect-modulated n-ZnO NW/poly(3,4-ethylenedioxythiophene):poly(styrene)sulfonate (PEDOT:PSS) LED array based on a flexible transparent indium tin oxide (ITO)/poly(ethylene terephthalate) (PET) substrate was recently reported.Reference Wang, Bao, Zhao, Zhang, Dong and Pan45 The vertical ZnO NW array grew on the a prepatterned flexible PET substrate by the hydrothermal method. The piezocharge produced by compression pressure on the NW LED array reduces the barrier height for hole transport and leads to better balance between electron and hole currents in the LED device. As shown in Figure 3a, the luminescence intensity of the LED increases linearly with compressive stress on the surface of the device. The piezo-phototronic effect tuning Si-based LED arrays can be obtained by grown ZnO NW arrays on the p-Si substrate.Reference Li, Liang, Tao, Xu, Peng, Han, Wang, Wang, Zhu, Pan and Wang49 When the device was under compressive strain, the light emission of this Si-based LED increased with a maximum value at a compressive strain of 0.15–0.2%, and then decreased. This progress is attributed to strain-induced piezopolarization charges, which could regulate the energy band diagrams at the p–n junction and lead to an increase in light-emitting performance.
Piezo-phototronic arrays for pressure sensor applications
Most pressure sensors are based on resistance sensors or capacitive sensor arrays, which require time to read out the pressure distribution from the whole pixel matrix of the device.Reference Hua, Sun, Liu, Bao, Yu, Zhai, Pan and Wang53,Reference Zhao, Hua, Yu, Zhang and Pan54 As discussed in previous sections, the emission intensity of the NW LED dependence on the local strain owing to the piezo-phototronic effect may enable a map of the distribution of pressure with high spatial resolution and fast response by reading the optical signals in parallel.Reference Li, Chen, Yu, Zhang, Song, Liang, Zhang, Cheng, Dong, Pan, Wang, Zhu and Pan55–Reference Bao, Wang, Dong, Shen, Zhao and Pan57
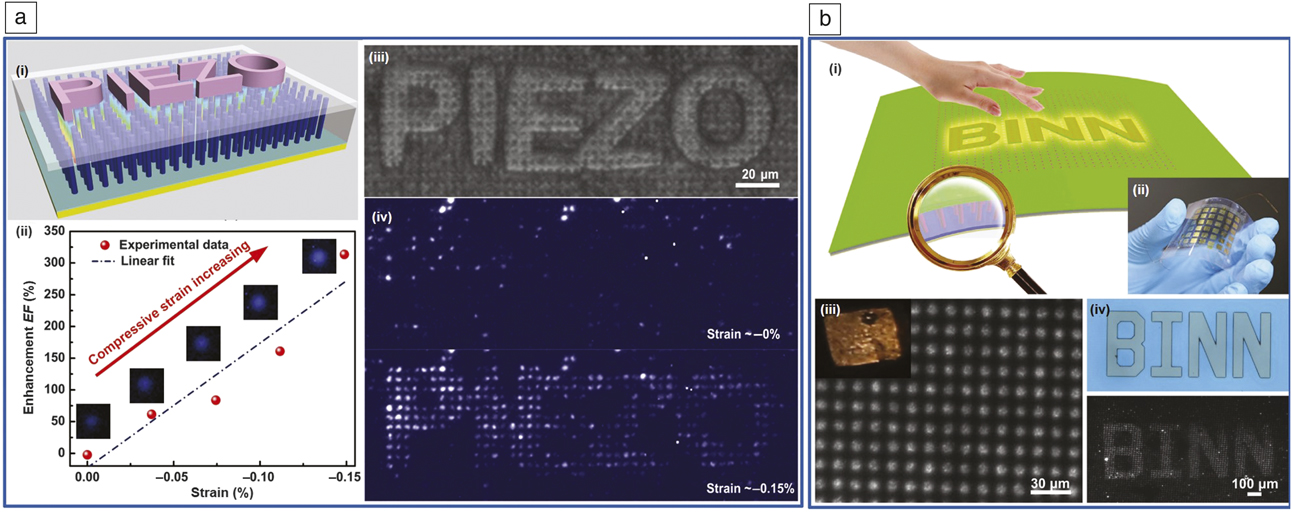
The visualized pressure-mapping system was reported with the structure of the ordered ZnO NWs on the prepatterned p-GaN thin-film sapphire substrate through low-temperature wet chemical methods.Reference Pan, Dong, Zhu, Niu, Yu, Yang, Liu and Wang58 This pressure sensor array composed of n-ZnO NW/p-GaN had been demonstrated to map distributions of strain/pressure with spatial resolution as high as 2.7 μm, which corresponds to 6350 dpi pixel density (Figure 4a). With compressive strain on the device surface, a negative piezo-potential is produced at the local interface of the ZnO/GaN p–n junction to increase the recombination rate of electrons and holes in the p–n junction, leading to enhancement of the light-emission intensity. The pressure distribution is obtained by reading out in parallel at an ultrafast detection speed of 90 ms. As shown in the Figure 4b, in order to be used as an electronic skin, a flexible LED array composed of a p-polymer layer and patterned n-ZnO NWs with a spatial resolution as high as 7 µm for mapping pressure has been reported.Reference Bao, Wang, Dong, Yu, Zhao, Wang and Pan59 The device was prepared on a prepatterned flexible PET/ITO substrate, with a vertically grown n-ZnO NW array as the electron-transport layer and a PEDOT:PSS layer as the hole-transport layer. The influence of the growth conditions and the morphologies of the ZnO NWs at each pixel on the device pressure measurements ranging from 40 to 100 MPa has also been explored.Reference Bao, Wang, Dong, Yu, Zhao, Wang and Pan59
Visible pressure distribution sensor based on piezo-phototronic light-emitting diode (LED) arrays. (a[i]) ZnO/GaN p–n junction LED array used as a strain distribution sensor. (ii) Optical image of the device with a stamp with a pattern on top. (iii) Electroluminescence images of the device at strains of (upper) 0 and (lower) –0.15%. (iv) The plot shows that light-emitting intensity of the nanowire (NW) LED increased under applied compressive strain.Reference Pan, Dong, Zhu, Niu, Yu, Yang, Liu and Wang58 (b) Flexible pressure distribution sensor based on the ZnO NW/p-polymer array. (Insets) Optical microscope images of single NW LED light spots. (i) Schematic illustration of the flexible NW-LED-based pressure sensor array after applying a compressive strain. (ii) Photograph of the flexible device. (iii) Optical images of a ZnO NW/p-polymer lighting up an LED array device. (iv) (Upper) Optical image of the convex-character pattern of “BINN.” (Lower) Electroluminescence image of the device at a stress of 80 MPa. The image clearly shows that a change in LED intensity occurred at pixels that were compressed, whereas those away from the patterned mask showed almost no change.Reference Bao, Wang, Dong, Yu, Zhao, Wang and Pan59

Conclusion
The piezo-phototronic effect is a result of three-way coupling among piezoelectricity, photoexcitation, and semiconducting characteristics in noncentrosymmetric semiconductor materials. This can be used to regulate the properties of optoelectronic devices, such as photodetectors, solar cells, and LEDs. This article reviewed the piezo-phototronic effect in NW-based optoelectronic devices, including fundamental science, technology, and important applications. Simulation and experiments proved that the piezo-phototronic effect is an effective way to modulate interface band structure to improve the efficiency of the devices dramatically and universally. On the other hand, the optical signal can be used to map the strain/pressure with ultrafast response and high resolution at the micrometer scale. Recently, research on piezo-phototronic effects has been extended to new materials and devices, such as piezo-phototronic effects on two-dimensional materials and devices and piezo-phototronic effects on NW random lasers. The piezo-phototronic effect can be effectively used for enhancing the efficiency of energy conversion in today’s safe, green, renewable energy technologies and as well as in the field of mechanosensing and smart robotics.
Acknowledgments
The authors acknowledge the support of the National Key R&D Project by the Minister of Science and Technology, China (2016YFA0202703), National Natural Science Foundation of China (Nos. 51622205, 61675027, 51432005, 61505010, and 51502018), Beijing City Committee of Science and Technology (Z171100002017019 and Z181100004418004), Beijing Natural Science Foundation (4181004, 4182080, 4184110, and 2184131), and Zhejiang Provincial Natural Science Foundation of China (No. R17F050003).

Rongrong Bao has been an associate professor at the Beijing Institute of Nanoenergy and Nanosystems, Chinese Academy of Sciences (CAS), China, since 2016. She received her BS degree from Tianjin University, China, in 2007, and her PhD degree from the Technical Institute of Physics and Chemistry, CAS, in 2012, where she was subsequently a postdoctoral fellow. Her current research focuses on the production and characterization of organic–inorganic composite nanodevices and flexible pressure sensors. Bao can be reached by email at baorongrong@binn.cas.cn.

Youfan Hu is an assistant professor in the Department of Electronics at Peking University, China. She received her PhD degree from Peking University in physical electronics in 2008, and was a postdoctoral research fellow and research scientist in the School of Materials Science and Engineering at the Georgia Institute of Technology. Her current research focuses on integrated multifunction sensor systems, energy-harvesting technology, and coupling effect in nanomaterials. She has published more than 40 peer-reviewed papers and holds five patents in nanodevice designs and energy-harvesting technology. Her work has been cited more than 1300 times, and seven of her publications are high Essential Science Indicators papers. Hu can be reached by email at youfanhu@pku.edu.cn.

Qing Yang has been a professor in the College of Optical Science and Engineering at Zhejiang University, China, since 2013. She received her BS and PhD degrees in the College of Materials Science and Engineering from Zhejiang University in 2001 and 2006, respectively. She was a visiting scholar at the Georgia Institute of Technology from 2009 to 2012. Her research focuses on nanophotonics and piezo-phototronics. Yang can be reached by email at qingyang@zju.edu.cn.

Caofeng Pan has been a professor and a group leader at the Beijing Institute of Nanoenergy and Nanosystems, Chinese Academy of Sciences, China, since 2013. He received his BS degree in 2005 and his PhD degree in 2010 in materials science and engineering from Tsinghua University, China. He was a postdoctoral fellow at the Georgia Institute of Technology. His research interests focus on the fields of piezotronics/piezo-phototronics for fabricating new electronic and optoelectronic devices, nanopower sources, hybrid nanogenerators, and self-powered nanosystems. Pan can be reached by email at cfpan@binn.cas.cn.