Introduction
Most researchers in the field of bilingualism or multilingualism need to use some form of self-reported language history questionnaires, either abbreviated or extended. The purpose of the questionnaire is to assess the linguistic background of bilinguals or second language learners so that the researcher has a way of generating self-reported linguistic measures in multiple languages. The outcomes from such assessments are often used as independent variables to predict or to correlate with learners’ linguistic performances derived from behavioral or neuroimaging experiments. Many language history questionnaires have been developed (e.g., Marian, Blumenfeld & Kaushanskaya, Reference Marian, Blumenfeld and Kaushanskaya2007; Anderson, Mak, Chahi & Bialystok, Reference Anderson, Mak, Chahi and Bialystok2018), including a standardized generic LHQ based on the most commonly asked questions in previous published studies (Li, Sepanski & Zhao, Reference Li, Sepanski and Zhao2006). LHQ and its successor (LHQ 2.0, Li, Zhang, Tsai & Puls, Reference Li, Zhang, Tsai and Puls2014) have now become widely used by scholars in bilingualism and multilingualism research (e.g., more than 100 published studies have cited and used LHQ; scholar.google.com indicates a total citation of over 300 times). Thanks to many researchers’ comments and suggestions in the past years, we have revised our instrument in its most recent development (LHQ3), and this article provides a quick guide of its usage. The overall purpose is consistent with the research community's efforts to document and quantify bilingual and multilingual experiences of the learner and the speaker (see the recent Anderson et al., Reference Anderson, Mak, Chahi and Bialystok2018 questionnaire).
LHQ's basic functions
Li et al. (Reference Li, Sepanski and Zhao2006) developed the original LHQ after examining 41 published studies and identifying the most commonly asked questions in those studies, which were typically related to important theoretical constructs in second language (L2) or bilingualism research, such as age of acquisition, length of stay, and L2 proficiency in reading, writing, comprehension, and speaking. These important dimensions were standardized and included in the LHQ 1.0, along with a simple online interface.
With the fast development of Internet technologies, the web interface and the data storage format of LHQ 1.0 had become outdated. Li et al. (Reference Li, Zhang, Tsai and Puls2014) introduced a new dynamic web-based update of LHQ (LHQ 2.0, which is available at http://blclab.org/lhq2/). It was built on three key design features: flexibility, accuracy and privacy. The full LHQ 2.0 includes 22 questions, grouped into 4 modules. Each of the four modules contains a subset of questionnaire items pertaining to the users’ linguistic history (BACKGROUND), proficiency in first, second, or multiple languages (PROFICIENCY), context and habits of language use (USAGE), and dominance and cultural identity of the languages acquired (DOMINANCE). Most importantly, researchers using LHQ 2.0 have the flexibility to use either the full LHQ, or certain modules of LHQ, or just certain items from the 22 questions. Participants’ responses to the questionnaire are automatically stored on the cloud server for 60 days, and can be retrieved as Excel spreadsheets. LHQ 2.0 also provided researchers with data privacy through a password-protected account management interface. Through the management interface, investigators can retrieve and delete the data, and update user and experiment information. Finally, LHQ 2.0 also has multiple language functions so that users could fill out the questionnaire in languages other than English (e.g., Chinese, Farsi, French, German, Spanish, Turkish), although some of these versions did not have web-based interfaces (only PDF files for users to fill out on paper).
LHQ 2.0 has been (and is still being) used by many researchers for their studies. Since 2014, we have received many inquiries, comments, and requests for potential new functions to make the web interface more useful and powerful. To address the needs of the researchers, we have developed LHQ3, which includes several improved new features while keeping all the popular functions of LHQ 2.0Footnote 1.
New features of LHQ 3.0
LHQ 3.0 includes several new features, including an enhanced account management interface, new data management interface, and new aggregated scoring functions. We discuss each of these below.
Enhanced account management interface
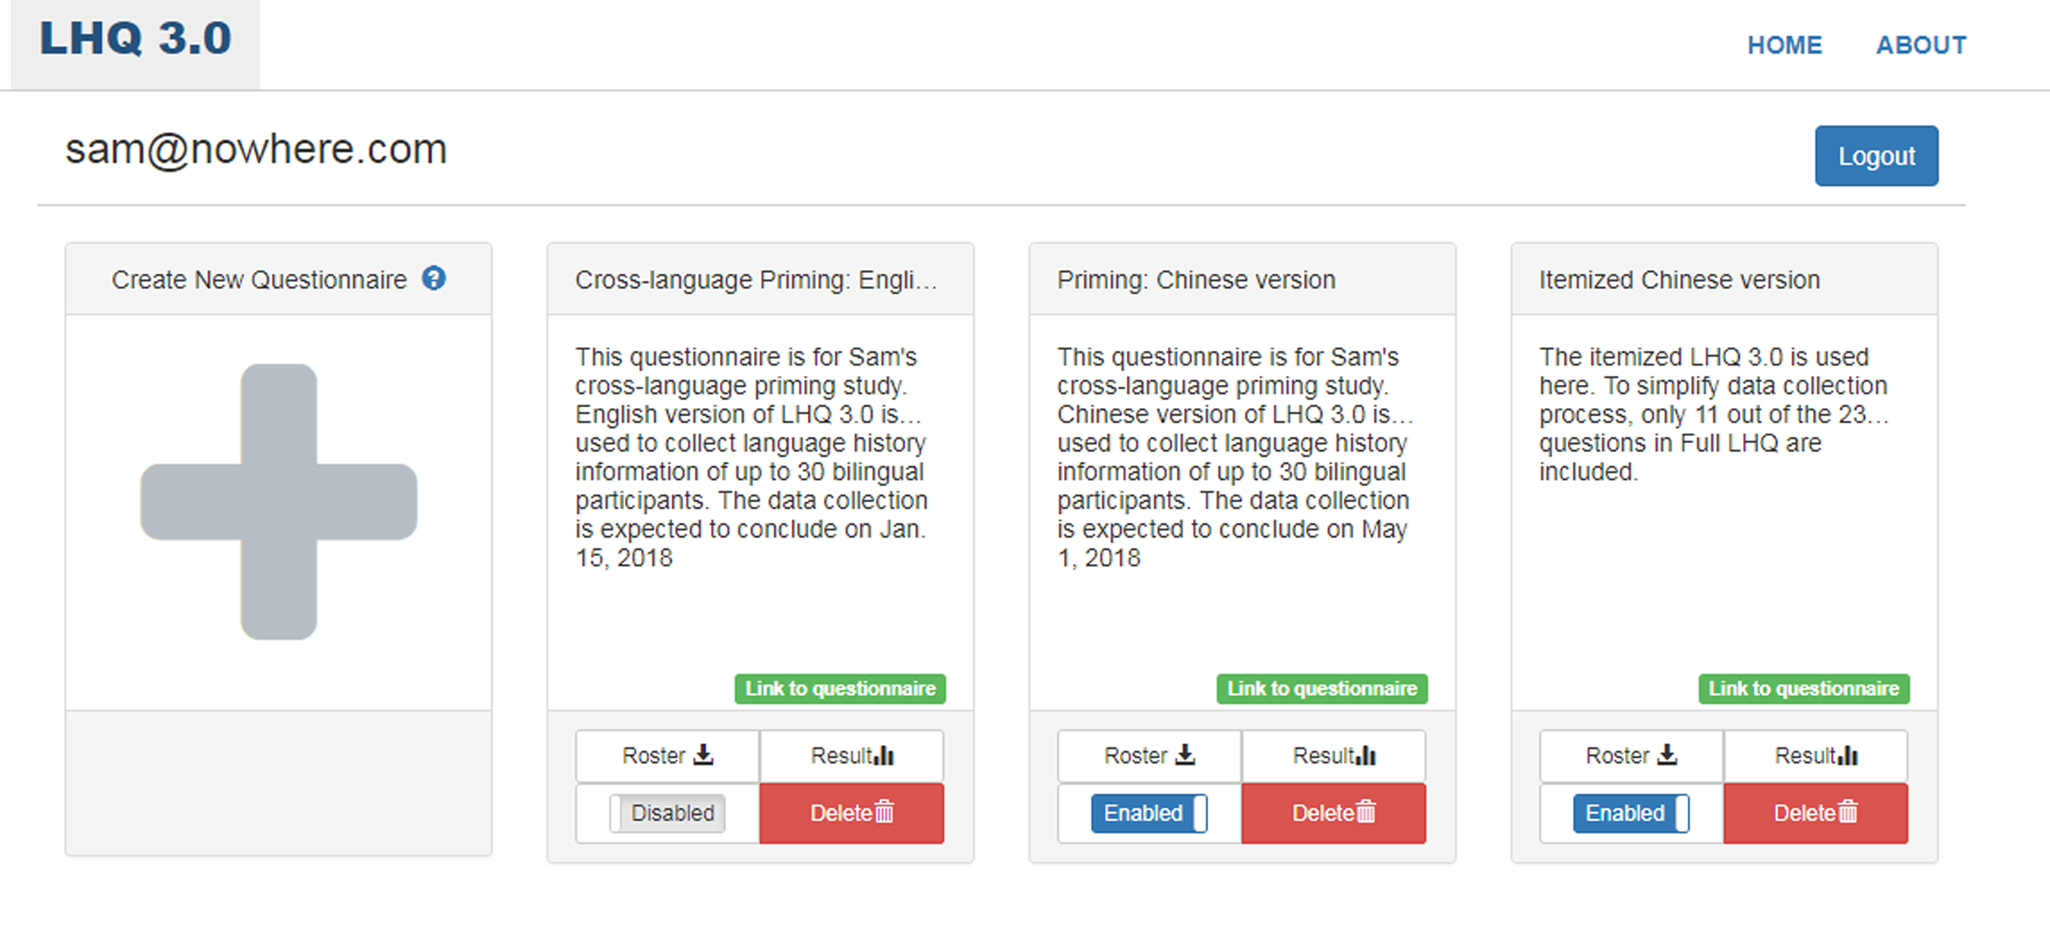
Using LHQ 2.0, researchers can manage their projects through an account management system interface (see Li et al., Reference Li, Zhang, Tsai and Puls2014). However, the interface was experiment-based, which means a researcher has to go through the signup process for every single experiment and remember different IDs and passwords for different experiments. This set-up could be an inconvenience to those researchers who had multiple questionnaires running, and, as a result, researchers often asked the authors of LHQ for their forgotten IDs and passwords. To avoid this problem, we have designed a new user-based interface, which allows a researcher to manage all her projects under a single password-protected account (Figure 1). Through the interface the researcher can create new questionnaires (with the option of choosing either Full, Modular or Itemized LHQ), delete old ones, temporally disable data collection of one questionnaire, download experiment roaster, and access the data management page of the questionnaire (see next subsection). This enhanced system can give researchers the flexibility in a trouble-free account management environment.
The new account manage interface of LHQ3.

New data management interface
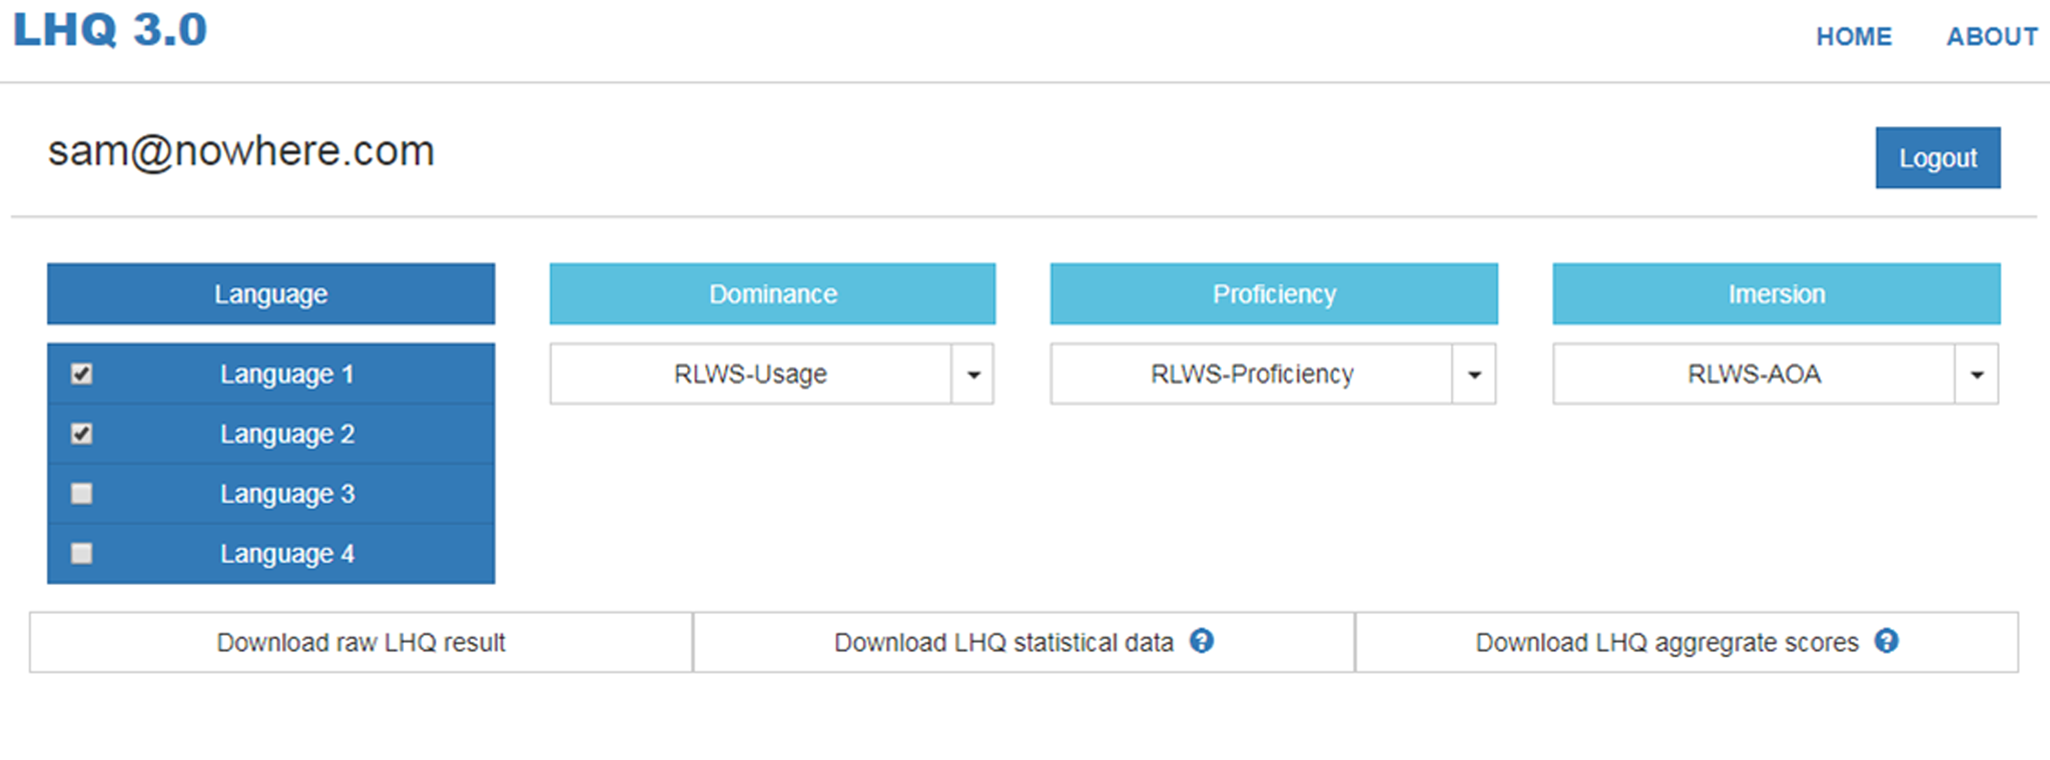
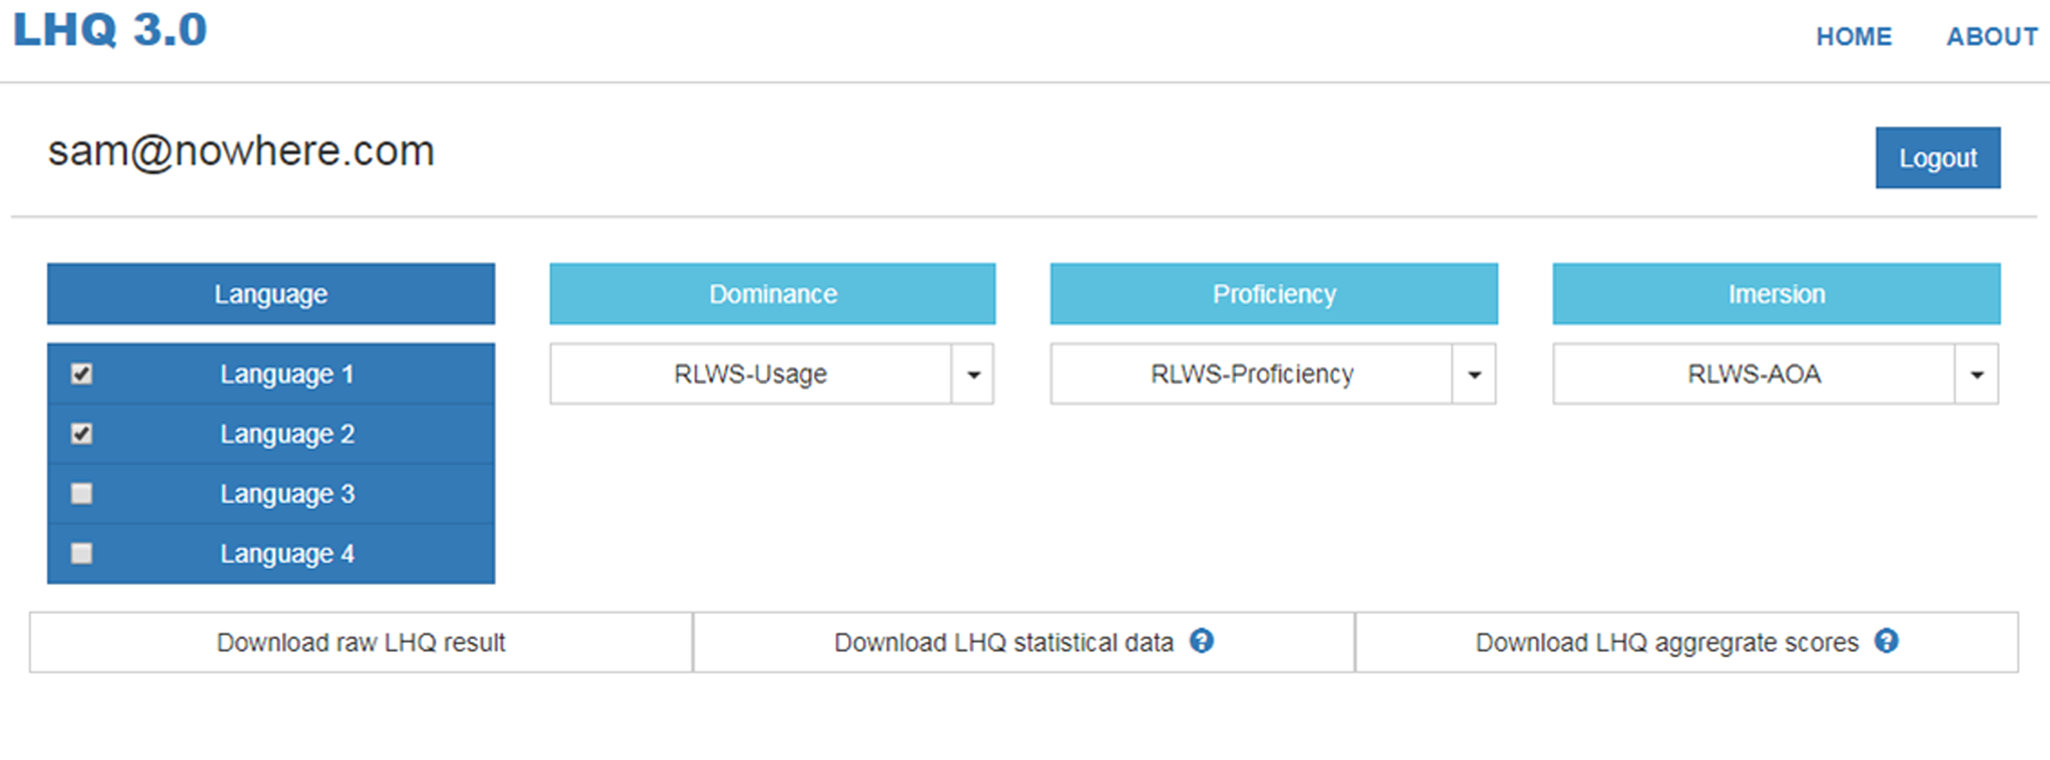
In addition to better account management, LHQ 3.0 includes an all new data management interface (see Figure 2 for illustration), which can be accessed by clicking the “Result” button of a project on Figure 1. On this interface, participants’ responses to a questionnaire can be displayed for a quick check by the researcher. In addition, the researcher can download the responses to their computers via three command buttons:
(1) The “Download raw LHQ result” button will save participants’ full raw responses in an Excel spreadsheet (in CSV format);
(2) The “Download LHQ statistical data” saves the basic descriptive statistics for every item of the questionnaire across the participants in an Excel spreadsheet (also in CSV format). Specifically, the minimum, maximum, mean and standard deviations are automatically calculated for the questions that involve data with numerical variables (e.g., age, self-rated proficiency, learning hours…), while the frequency distributions are provided for the questions that involve data on a nominal scale (e.g., gender, education, language).
(3) The “Download LHQ aggregate scores” button will further automatically calculate overall measurements of each participant's language background and save the results in an Excel spreadsheet. The aggregated scoring function is important and we discuss the details below.
The new data management interface of LHQ3.
Aggregated scores
Many researchers/users have requested that we develop an automatic scoring system to enable better and more user-friendly functions for LHQ (e.g., see comment in Anderson et al., Reference Anderson, Mak, Chahi and Bialystok2018). Thus, in LHQ3, we introduced four aggregated scores to represent participants’ overall proficiency, dominance, and immersion levels of each language they have learned. It is our hope that these scores will help the researcher to arrive promptly at a useful estimation/ classification of different types of multilingual speakers.
Language proficiency
Multilingual speakers’ proficiency level in each language has been treated as an important dimension in many previous bilingual or multilingual studies (i.e., Bialystok, McBride-Chang & Luk, Reference Bialystok, McBride-Chang and Luk2005; Chen, Zhou, Uchikoshi & Bunge, Reference Chen, Zhou, Uchikoshi and Bunge2014). Taking this into consideration, LHQ3 provides one overall aggregated scoring of proficiency based on the weighted sum of a participant's self-rating of his proficiency levels on different components of a language (Question 11 of LHQ 3.0: Rate your current ability in terms of listening, speaking, reading, and writing in each of the languages you have studied or learned). So a participant's overall proficiency score of his ith language can be written as:
 $${\bi Proficiency}{\bi \;} _{\bi i} = \displaystyle{1 \over 7}\mathop \sum \nolimits_{{\bi j} = \lcub {{\bi R},{\bi L},{\bi W},{\bi S}} \rcub } {\bi \omega} _{\bi j}{\bi P}_{{\bi i},{\bi j}}$$
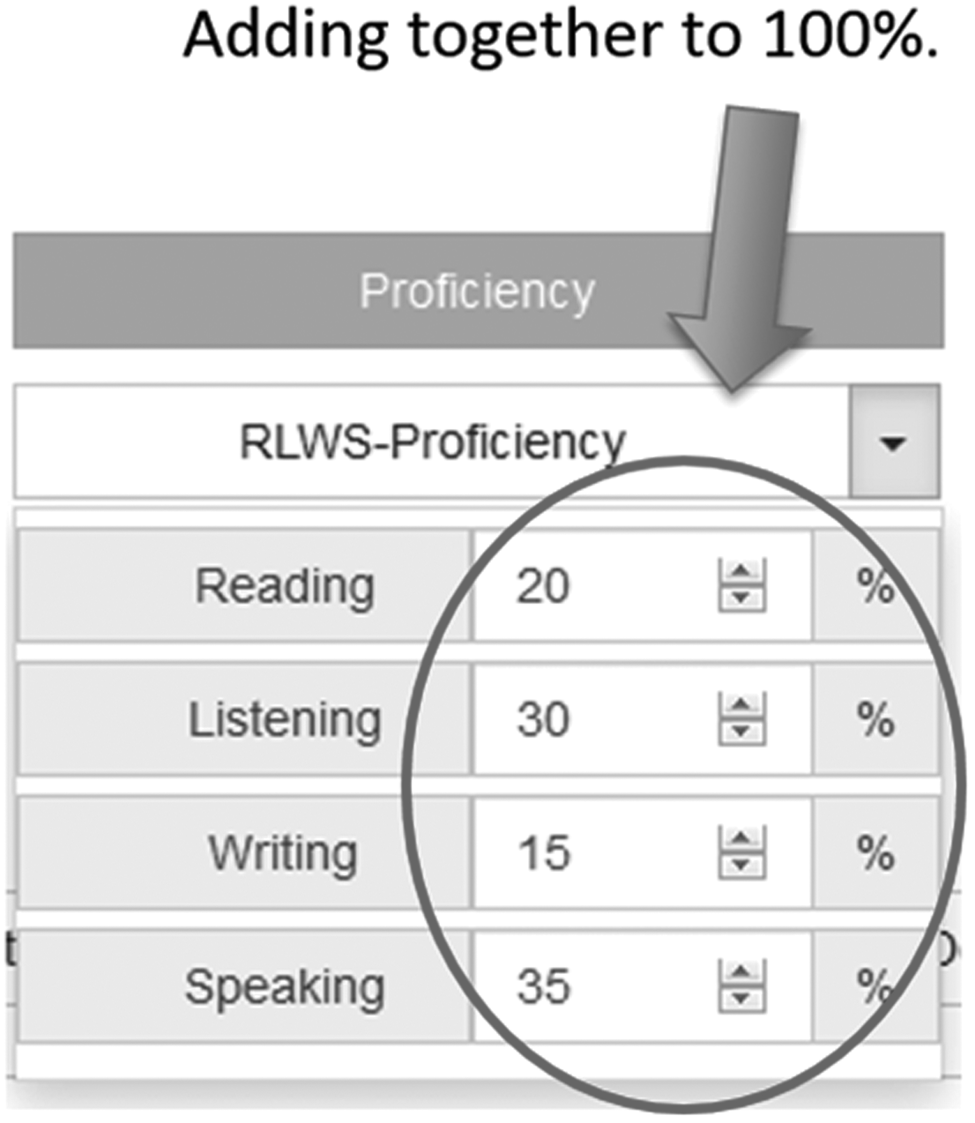
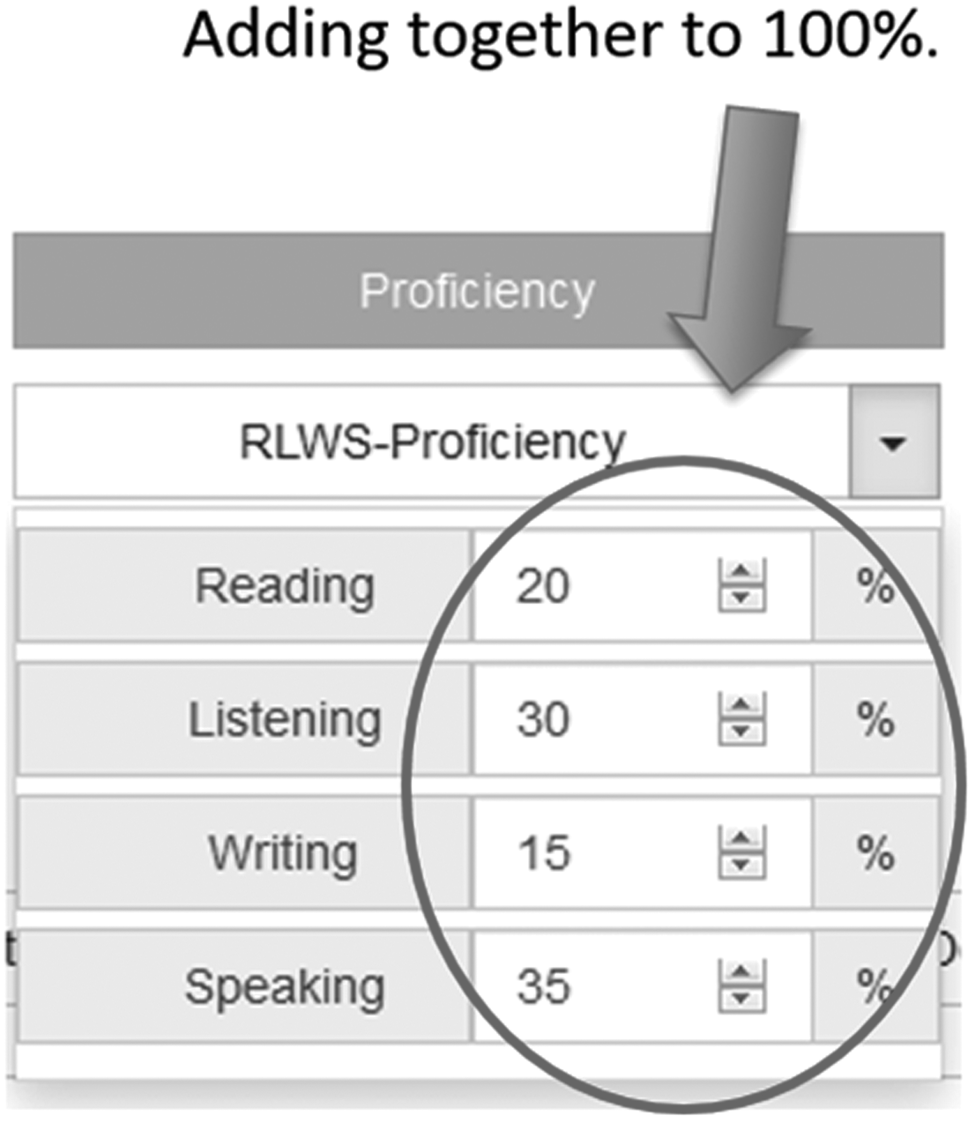
Here, {R, L,W, S} stands for Reading, Listening, Writing and Speaking components of a language. P i,j stands for a participant's self-rated proficiency level to the jth component of his ith language. Since it is rated on a 7-point Likert scale, we use a scaling factor of 1/7 to normalize it into a range between zero and one (with 1 indicating the native language-like proficiency level). ω j represents a weight assigned to the jth linguistic component. The default values of the weights for the four components are equally distributed (i.e., 25% each), but the investigator can designate the weighting distribution for the four components on the data management interface (See Figure 3). The rationale is that different researchers may have different needs on which component should be emphasized in their studies, therefore it is more flexible for a researcher to use a weighted aggregated score in given instances: for example, a study focusing on illiterate bilinguals may only consider speaking and listening, with 50% weighting to each of them (0% for reading and writing). Vice versa, if a researcher is interested only in reading and writing in the second language, then the reverse could be applied. Appendix A provides a numerical example.
An example of weighting different linguistic component's relative contribution when calculating the aggregated proficency score. The weights add up to 100% for normalization purpose.
Language immersion
Many researchers believe that immersion in a target language environment might be the key to successful learning of a second language (Nikolov & Djigunović, Reference Nikolov and Djigunović2006), and there is also empirical evidence that immersion experience may attenuate L1 interference to the L2 for late adult learners (Linck, Kroll & Sunderman, Reference Linck, Kroll and Sunderman2009) and lead to corresponding brain changes in the subcortical structures (Pliatsikas, DeLuca, Moschopoulou & Saddy, Reference Pliatsikas, DeLuca, Moschopoulou and Saddy2017). It is therefore important for an investigator to have a rough estimate of their multilingual participants’ history of immersion into each language they have learned (Kuhl, Stevenson, Corrigan, van den Bosch, Can & Richards, Reference Kuhl, Stevenson, Corrigan, van den Bosch, Can and Richards2016). LHQ3 now introduces an overall aggregated scoring function of immersion for each language that the participant knows, based on her Age, Age of Acquisition (AoA), and Years of Use of the language (Question 5 of LHQ 3.0: Indicate your native language(s) and any other languages you have studied or learned, the age at which you started using each language in terms of listening, speaking, reading, and writing, and the total number of years you have spent using each language), using the following equation:
 $${\bi Immersion}{\bi \;} _{\bi i} = \displaystyle{1 \over 2}{\bi \;} \left[ {\mathop \sum \nolimits_{{\bi j} = \lcub {{\bi R},{\bi L},{\bi W},{\bi S}} \rcub } {\bi \omega}_{\bi j}\left( {\displaystyle{{{\bi Age}-{\bi AO}{\bi A}_{{\bi i},{\bi j}}} \over {{\bi Age}}}} \right) + \left( {\displaystyle{{{\bi Yo}{\bi U}_{\bi i}} \over {{\bi Age}}}} \right)} \right]$$
Here Age is the participant's current age in years. AOA i,j stands for the participant's age of starting using her ith language in terms of the jth component (e.g., reading). YoU i stands for her total number of years using the ith language. We incorporate this variable into the equation to account for situations such as when one started to learn a language at an early age but stopped using it for an extended period. Such experience of language immersion should be different from (less immersive than) that of a participant who started to learn a language at the same age but has remained an active user of the language. {R, L, W, S} and ω j have the same meaning as in Equation (1). In addition, we apply a scaling factor (1/2) to the function to ensure AoA and YoU have equal weight on calculating the overall immersion score, and to normalize the score to a range between 0 and 1 (with 1 indicating the most native-like immersion level into a language).
Language dominance
Language dominance is another important component in multilingual research, and it is closely related to multiple factors including participants’ proficiency and daily usage of each language (Treffers-Daller & Silva-Corvalán, Reference Treffers-Daller and Silva-Corvalán2015; Malt, Li, Pavlenko, Zhu & Ameel, Reference Malt, Li, Pavlenko, Zhu and Ameel2015). LHQ3 automatically calculates an aggregated dominance score based on both the participant's self-reported proficiency (Question 11 of LHQ3, see above) and the time (hours per day) spent on different components of each language (Questions 14 and 15 of LHQ 3.0: 14. Estimate how many hours per day you spend engaged in the following activities in each of the languages you have studied or learned; 15. Estimate how many hours per day you spend speaking with the following groups of people in each of the languages you have studied or learned), and can be expressed as Equation (3) below:
 $${\bi Dominance}{\bi \;} _{\bi i} = \mathop \sum \nolimits_{{\bi j} = \lcub {{\bi R},{\bi L},{\bi W},{\bi S}} \rcub } {\bi \omega} _{\bi j}\left[ {\displaystyle{1 \over 2}\left( {\displaystyle{{{\bi P}_{{\bi i},{\bi j}}} \over 7}} \right) + \displaystyle{1 \over 2}\left( {\displaystyle{{{\bi H}_{{\bi i},{\bi j}}} \over {\bi K}}} \right)} \right]$$
Here {R, L, W, S}, ω j and P i,j carry the same meaning as in previous equations. H i,j stands for the total estimated hours per day a participant spent on the jth linguistic aspect (e.g., speaking) of her ith language. K is a constant serving as a scaling factor, currently set to be 16Footnote 2. Another scaling factor 1/2 is applied to the function to ensure the proficiency and the daily usages of a language to have equal weight on calculating its dominance score.
A word of caution regarding the aggregated dominance scores: although useful for within-subject comparison of language dominance, one should be careful about using these scores for comparing across participants. The main reason is that there are large individual differences on participants’ self-estimation of their daily usage of one or more languages. Some participants may be more liberal when estimating their time on language activities, thus giving overall higher dominance scores; whereas others are more conservative when estimating. To overcome this potential pitfall, we introduce another new measurement of language dominance, expressed as a ratio between two dominance scores, as in Equation (4):
 $${\bi Rati}{\bi o}_{{\bi Dominance} {\bi i}} = \displaystyle{{{\bi Dominance}\; _{\bi i}} \over {{\bi Dominanc}{\bi e}_1}}$$
This measurement provides the relative ratio of the dominance score of each language (Dominance i,) against that of the first (typically native, Dominance 1) language that a participant reports. It can give researchers a standardized estimate of language dominance that is more comparable across participants (like Z scores). Using the ratio, the researcher can easily determine if a participant is a balanced multilingual, or is someone having one language dominant over another language.
Validity and reliability
The validity and reliability of the LHQ questions have been tested by many previous studies that correlated LHQ results with other behavioral tests and outcomes of bilingual experience (Bidelman, Gandour & Krishnan, Reference Bidelman, Gandour and Krishnan2011; Bidelman, Hutka & Moreno, Reference Bidelman, Hutka and Moreno2013; Calvo, Garcia, Manoiloff & Ibáñez, Reference Calvo, García, Manoiloff and Ibáñez2016; Carlson, Goldrick, Blasingame & Fink, Reference Carlson, Goldrick, Blasingame and Fink2016; Dong & Zhong, Reference Dong and Zhong2017, Chandrasekaran, Krishnan & Gandour, Reference Chandrasekaran, Krishnan and Gandour2009; Hartanto & Yang, Reference Hartanto and Yang2016; Jonczyk, Boutonnet, Musial, Hoemann & Thierry, Reference Jończyk, Boutonnet, Musiał, Hoemann and Thierry2016; McLeod & Verdon, Reference McLeod and Verdon2017; Yang, Gates, Molenaar & Li, Reference Yang, Gates, Molenaar and Li2015). For example, in Grant and Li (Reference Grant and Li2019), bilingual participants’ verbal fluency scores in Spanish were significantly correlated with their LHQ-based self-rated proficiency scores (p = .039, r = .36).
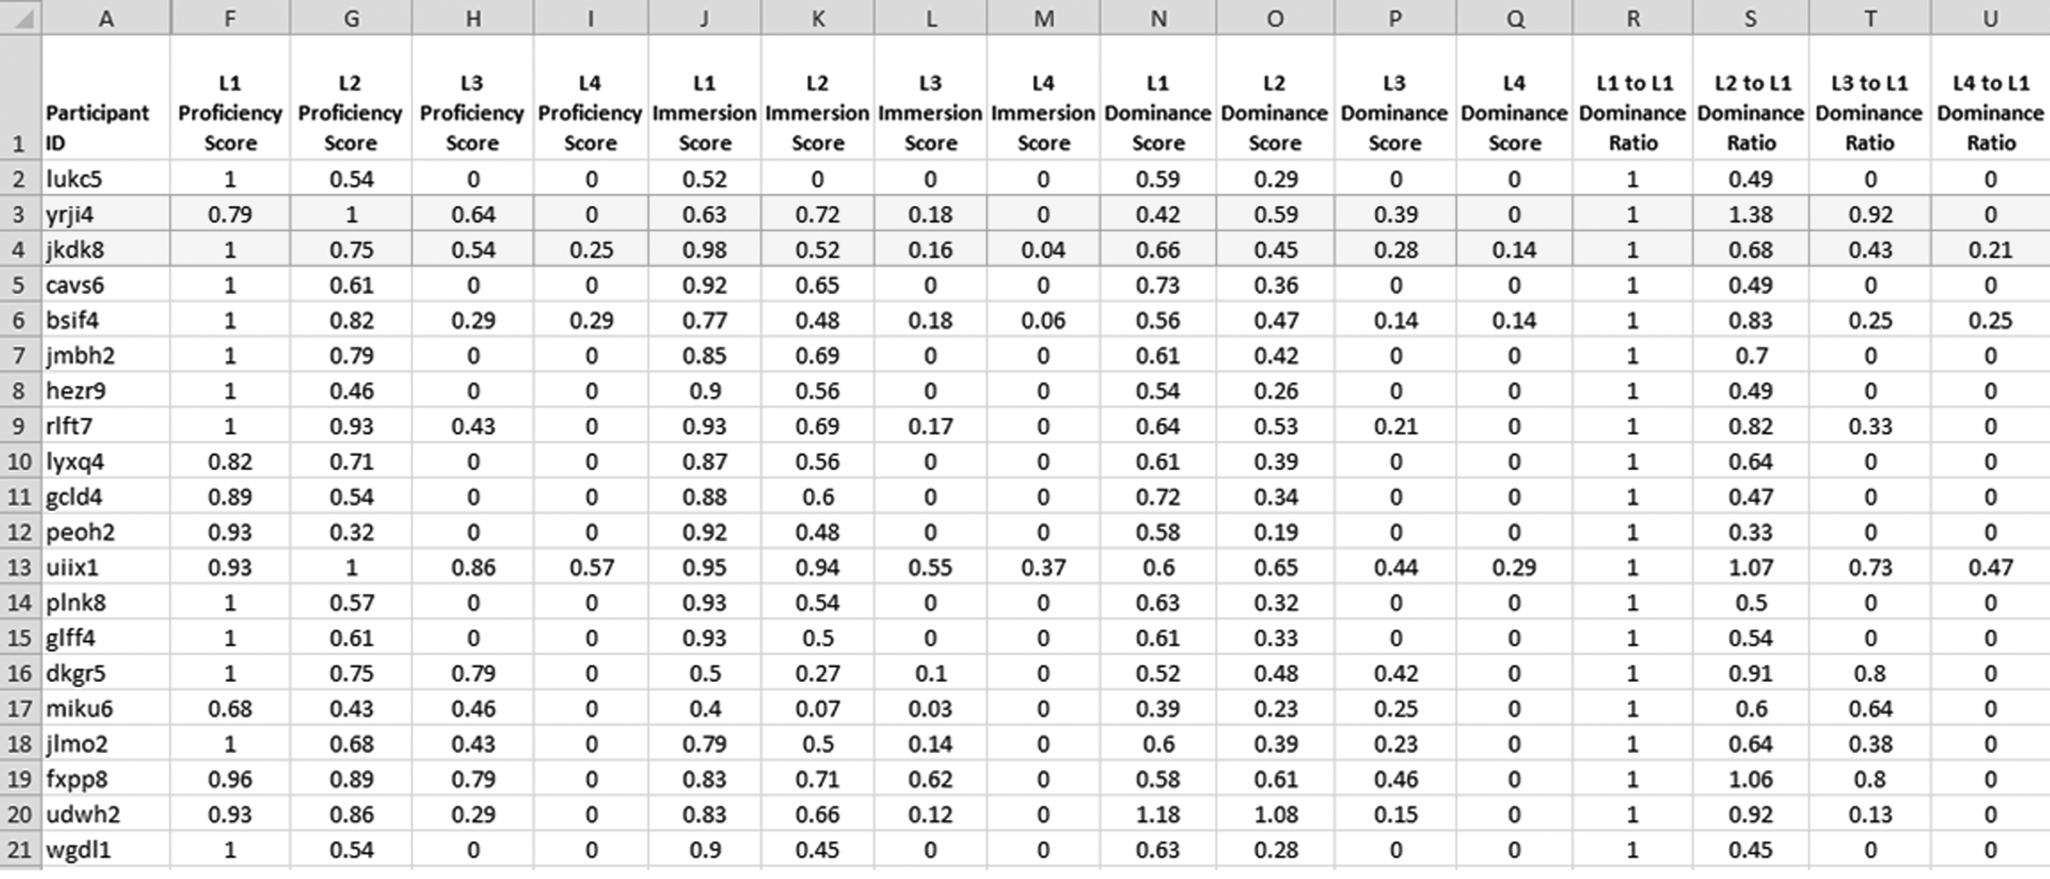
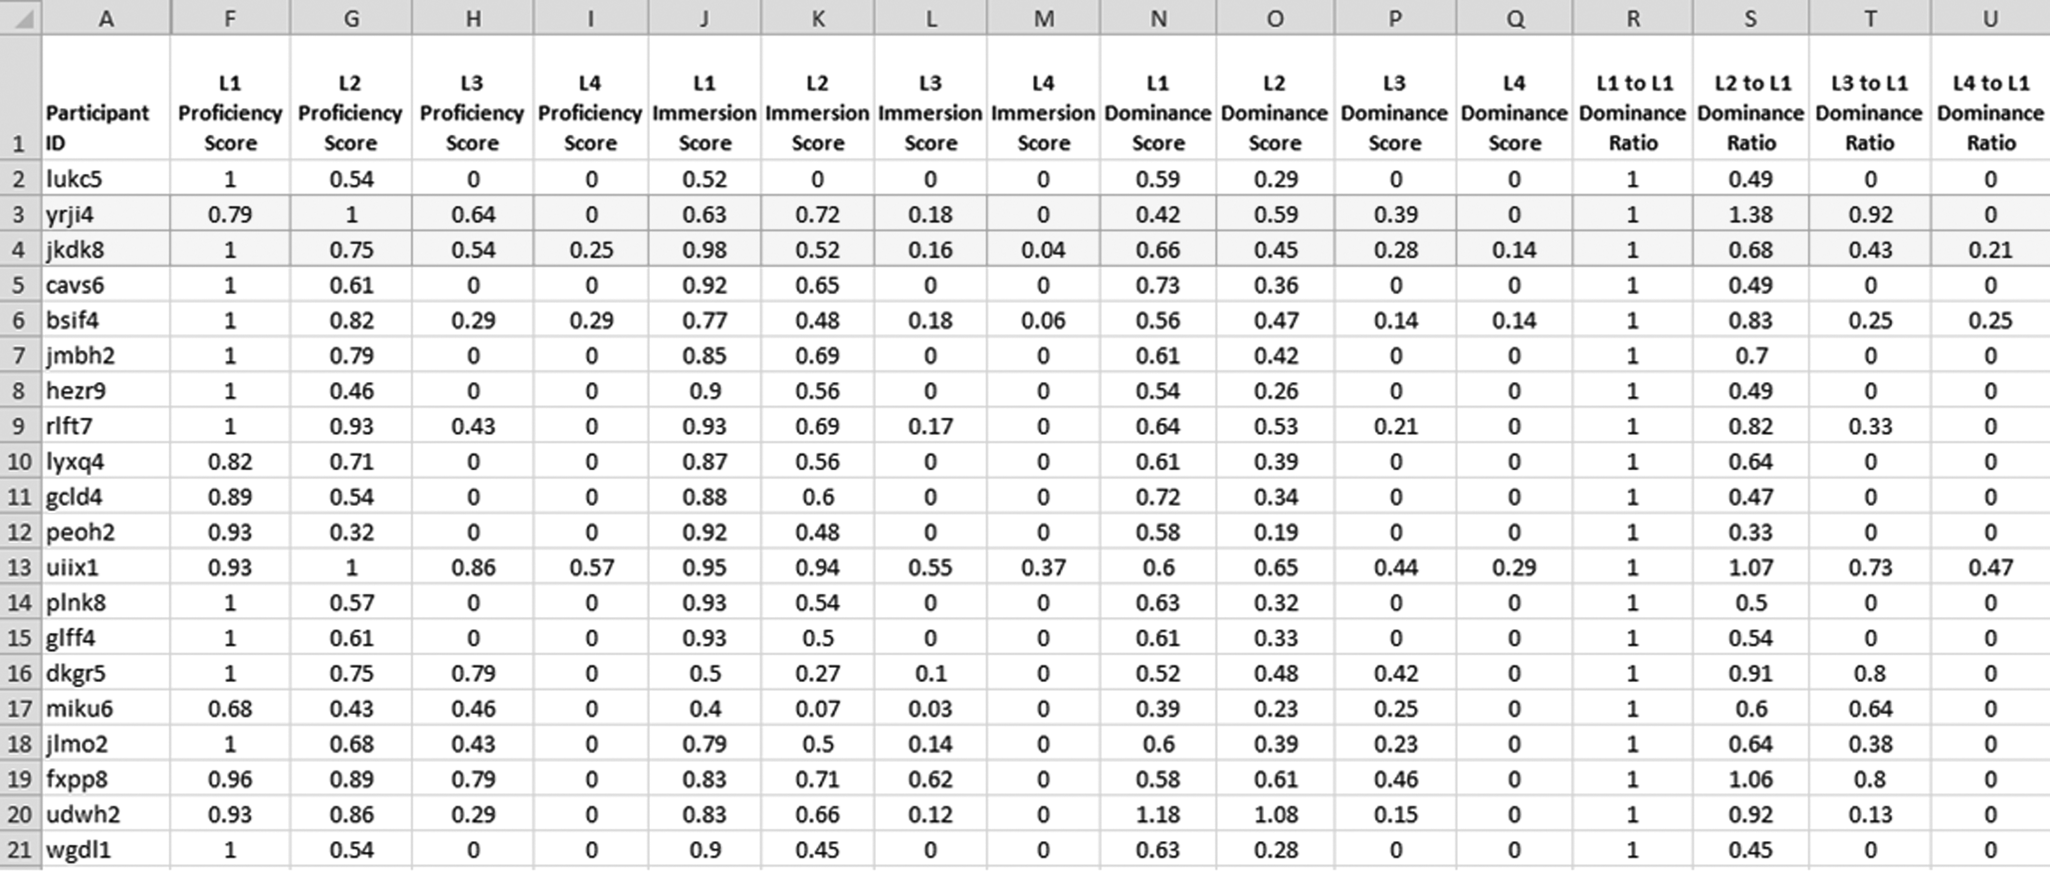
We further demonstrated the validity of our aggregated functions by validating LHQ3 with real multilingual participants’ language background data from a previous unpublished study (based on 21 participants from Beijing, China; Li, Hsu, Schloss & Clariana, Reference Li, Hsu, Schloss and Clariana2018). As shown in Figure 4, the automatically calculated aggregated scores clearly capture these participants’ difference (see Appendix on how we calculate these scores). For example, participant yrgi4 (highlighted, 3rd row in Fig. 4) is a Chinese speaker born in Hong Kong who learned 3 languages/dialects (Cantonese L1; English L2; and Mandarin Chinese as L3). The participant is more fluent in L2 and uses L2 more often, and this is clearly captured by his higher L2 scores on proficiency (column G: 1), immersion (column K: 0.72), dominance score (column O: 0.59) and dominance ratio (column S: 1.38). Participant jkdk8 (highlighted, 4th row in Fig. 4) is a Chinese speaker living in Beijing who learned 4 languages (Chinese L1; English L2; Japanese L3 and French L4). He is obviously more dominant on L1, as shown by his descending dominance ratios corresponding to the four languages (see columns R to U on the 4th row). These aggregated scores match with the participants’ reports to individual questions from the LHQ. More importantly, their scores on an objective measurement of their L2 (English) ability (Peabody Picture Vocabulary Test: PPVT-4; Dunn & Dunn, Reference Dunn and Dunn2007) are found to be significantly correlated with their L2 proficiency score (r = .68, p =.001), L2 dominance score (r = .60, p =.007), and L2 dominance ratio to L1 (r = .71, p =.001).
An output example of aggregated scores from a de-identified real participant (demographic information removed).
Finally, the use of the on-line web interface also makes LHQ3 more reliable, since it can reduce potential transcription errors from manually recording and transcribing the data. We have also made further efforts to improve the reliability of LHQ 3.0 and to reduce errors from manual entry. For example, we implemented a synchronization function to ensure that a participant's selection of the languages is consistent across multiple questions in the data entry process. This function also saves participants’ time in filling the LHQ3 since their selection of languages in the early questions can be automatically displayed later on with questions that ask about languages.
Practical steps on using LHQ3
LHQ3 is an instrument based on self-reports, and thus participants need to understand the questions to complete it. The questions in LHQ3 generally take a serious adult participant 20–30 minutes to complete based on our experience (the Full version). Of course, as indicated above, researchers may modularize or itemize the LHQ with fewer questions, which would require less time to complete. LHQ has been successfully administrated to both adults and adolescents. It was also adapted for other age groups including children (in translated or adapted versions through parents’ reports; see Kambanaros & Grohmann, Reference Kambanaros and Grohmann2013; Karpava & Grohmann, Reference Karpava and Grohmann2012; Yeong & Liow, Reference Yeong and Liow2012). Assistance may be required with participants who are not familiar with web-based interface.
LHQ 3.0 can be found at http://blclab.org/lhq3. As in previous versions, LHQ3 has multilingual versions and can be completed in other languages. Currently, twelve language versions of LHQ3 (English, simplified Chinese, traditional Chinese, French, German, Korean, Italian, Japanese, Portuguese, Slovenian, Spanish, and Turkish) are available for use (more on the way). Researchers can follow four simple steps in deploying it for their study.
Step 1: The investigator completes the sign-up process (by clicking the “Sign in/Sign up LHQ 3.0”) and logs on to the account manage interface (Figure 1). Here, based on the investigator's needs, the experimenter can create a full, modular, or itemized questionnaire with a unique Experiment ID (with an individualized URL). The investigator will also receive an email that contains the participant ID number roster in CSV format. This is similar to the process in using LHQ 2.0.
Step 2: The investigator can send this questionnaire URL and participant ID number (from the roster) to the participants from a study and ask them to complete the questionnaire. The participants complete the LHQ online through the individualized URL, and data (along with participant numbers) are automatically stored and cumulatively saved. This is similar to LHQ 2.0.
Step 3: The investigator accesses the account management page (by clicking the “Sign in/Sign up LHQ3”) to manage the questionnaires. The investigator can delete a questionnaire and also temporally disable or enable participants’ access to it. The account management system is updated and consolidated (as discussed earlier).
Step 4: At any time point, the investigator can reach the data management interface (Figure 2) by clicking the “Result” button of a questionnaire. Participants’ responses, basic descriptive statistics, and aggregated scores will then be downloadable. The data management system is updated and made more flexible (as discussed earlier).
Finally, it should be noted that proficiency, immersion, and dominance are complex constructs in multilingualism research and are often correlated with each other (see discussions in Luk & Bialystok, Reference Luk and Bialystok2013; Treffers-Daller & Silva-Corvalán, Reference Treffers-Daller and Silva-Corvalán2015). The aggregated functions can provide the researchers with quick quantifications of these constructs, but the researchers need to be mindful of their correlations, and need to evaluate a participant's language history in connection with other objective criteria or instruments for validity and reliability, as we discussed above, for a complete picture of an individual's language background profile.
Acknowledgements
Preparation of this article was made possible by a grant from the National Science Foundation (BCS#1533625) to Ping Li. Partial support was also provided by the Shenzhen Peacock Team Plan (KQTD2015033016104926) and Guangdong Pearl River Talents Plan Innovative and Entrepreneurial Team grant (2016ZT06S220). Fan Zhang was supported by a Graduate Research Grant from Penn State University, and he is now with Interactions. LLC., Boston. We thank Rose Yuratovac, Zixin Tang, Chih-Ting Chang, Benjamin Schloss, Marissa Scotto and many other members of BLC lab (http://blclab.org/) for helping test the online interface. We are also grateful to many LHQ users for their comments and suggestions that made the LHQ3 possible.
Appendix A: Example of LHQ3 Data and Analyses
The following example is provided to help the readers understand how the aggregated functions work. Imagine a Chinese-English bilingual at the age of 25 and with English as his L2, his answers to many questions of LHQ are listed below.
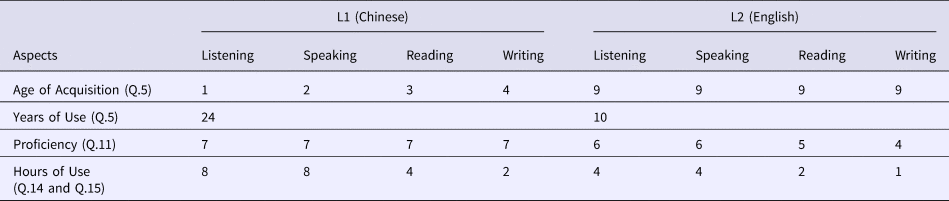
Assume that a researcher treats different linguistic aspects (listening, speaking, reading and writing) equally and assign each aspect a weight of .25 (i.e., 25%). The participant's overall proficiency score on Chinese (L1) would be 1.
 $$\eqalign{& {\bi Proficiency}{\bi \;} _{{\bi L}1} = \displaystyle{1 \over 7}\mathop \sum \limits_{{\bi j} = \lcub {{\bi R},{\bi L},{\bi W},{\bi S}} \rcub } {\bi \omega} _{\bi j}{\bi P}_{{\bi i},{\bi j}} = \displaystyle{1 \over 7}\lpar {0.25{\bi {^\ast}}7 + 0.25{\bi {^\ast}}7 + 0.25{\bi {^\ast}}7 + 0.25{\bi {^\ast}}7} \rpar = 1} $$
And his proficiency score on English (L2) would be 0.75
 $$\eqalign{&{\bi Proficiency}{\bi \;} _{{\bi L}2} = \displaystyle{1 \over 7}\mathop \sum \limits_{{\bi j} = \lcub {{\bi R},{\bi L},{\bi W},{\bi S}} \rcub } {\bi \omega} _{\bi j}{\bi P}_{{\bi i},{\bi j}} = \displaystyle{1 \over 7}\lpar {0.25{\bi {^\ast}}6 + 0.25{\bi {^\ast}}6 + 0.25{\bi {^\ast}}5 + 0.25{\bi {^\ast}}4} \rpar = 0.75} $$
Please note that a researcher could give different weights to different linguistic aspects for the research purpose. For example, if a researcher only focuses on bilingual participants’ listening and speaking components of the two languages, he could set the weight to be 0.5 each for listening and speaking, but 0 for the other two (reading and writing). In this case, the participant's overall proficiency score on Chinese (L1) would still be 1.
 $${\bi Proficiency}{\bi \;} _{{\bi L}1} = \displaystyle{1 \over 7}\lpar {0.5{\bi {^\ast}}7 + 0.5{\bi {^\ast}}7 + 0{\bi {^\ast}}7 + 0{\bi {^\ast}}7} \rpar = 1$$
And his proficiency score on English (L2) would be 0.86, larger than last calculation when reading and writing were considered. This makes sense since he is not good at reading and writing in L2.
 $${\bi Proficiency}{\bi \;} _{{\bi L}2} = \displaystyle{1 \over 7}\lpar {0.5{\bi {^\ast}}6 + 0.5{\bi {^\ast}}6 + 0{\bi {^\ast}}5 + 0{\bi {^\ast}}4} \rpar = 0.86$$
We can also calculate his immersion scores. For his L1 (Chinese), it would be 0.93
 $$\eqalign{& {\bi Immersion}{\bi \;} _{{\bi L}1} \cr & = \displaystyle{1 \over 2}{\bi \;} \left[ {\mathop \sum \limits_{{\bi j} = \lcub {{\bi R},{\bi L},{\bi W},{\bi S}} \rcub } {\bi \omega}_{\bi j}\left( {\displaystyle{{{\bi Age}-{\bi AO}{\bi A}_{{\bi i},{\bi j}}} \over {{\bi Age}}}} \right) + \left( {\displaystyle{{{\bi Yo}{\bi U}_{\bi i}} \over {{\bi Age}}}} \right)} \right] \cr & = \displaystyle{1 \over 2}{\bi \;} \left[ {\matrix{ {0.25{^\ast}\left( {\displaystyle{{25-1} \over {25}}} \right) + 0.25{^\ast}\left( {\displaystyle{{25-2} \over {25}}} \right) + 0.25{^\ast}\left( {\displaystyle{{25-3} \over {25}}} \right) + 0.25{^\ast}\left( {\displaystyle{{25-4} \over {25}}} \right) + \displaystyle{{24} \over {25}}} \cr}} \right] \cr & = \displaystyle{1 \over 2}{\bi \;} \left[ {\matrix{ {\displaystyle{{90} \over {100}} + \displaystyle{{24} \over {25}}} \cr}} \right] = 0.93} $$
And his immersion score on English (L2) would be 0.52
 $$\eqalign{&{\bi Immersion}{\bi \;} _{{\bi L}2} \cr & = \displaystyle{1 \over 2}{\bi \;} \left[ {\mathop \sum \limits_{{\bi j} = \lcub {{\bi R},{\bi L},{\bi W},{\bi S}} \rcub } {\bi \omega}_{\bi j}\left( {\displaystyle{{{\bi Age}-{\bi AO}{\bi A}_{{\bi i},{\bi j}}} \over {{\bi Age}}}} \right) + \left( {\displaystyle{{{\bi Yo}{\bi U}_{\bi i}} \over {{\bi Age}}}} \right)} \right] \cr & = \displaystyle{1 \over 2}{\bi \;} \left[ {\matrix{ {0.25{^\ast}\left( {\displaystyle{{25-9} \over {25}}} \right) + 0.25{^\ast}\left( {\displaystyle{{25-9} \over {25}}} \right) + 0.25{^\ast}\left( {\displaystyle{{25-9} \over {25}}} \right) + 0.25{^\ast}\left( {\displaystyle{{25-9} \over {25}}} \right) + \displaystyle{{10} \over {25}}} \cr}} \right] \cr & = \displaystyle{1 \over 2}{\bi \;} \left[ {\matrix{ {\displaystyle{{64} \over {100}} + \displaystyle{{10} \over {25}}} \cr}} \right] = 0.52} $$
When his daily use of the languages is considered, we can also calculate his dominance score for the two languages.
 $$\eqalign{{\bi Dominance}{\bi \;} _{{\bi L}1} & = \mathop \sum \nolimits_{{\bi j} = \lcub {{\bi R},{\bi L},{\bi W},{\bi S}} \rcub } {\bi \omega} _{\bi j}\left[ {\displaystyle{1 \over 2}\left( {\displaystyle{{{\bi P}_{{\bi i},{\bi j}}} \over 7}} \right) + \displaystyle{1 \over 2}\left( {\displaystyle{{{\bi H}_{{\bi i},{\bi j}}} \over {\bi K}}} \right)} \right] \cr & = 0.25\left[ {\displaystyle{1 \over 2}\left( {\displaystyle{7 \over 7}} \right) + \displaystyle{1 \over 2}\left( {\displaystyle{8 \over {16}}} \right)} \right] + 0.25\left[ {\displaystyle{1 \over 2}\left( {\displaystyle{7 \over 7}} \right) + \displaystyle{1 \over 2}\left( {\displaystyle{8 \over {16}}} \right)} \right] \cr &\quad + 0.25\left[ {\displaystyle{1 \over 2}\left( {\displaystyle{7 \over 7}} \right) + \displaystyle{1 \over 2}\left( {\displaystyle{4 \over {16}}} \right)} \right] \cr &\quad + 0.25\left[ {\displaystyle{1 \over 2}\left( {\displaystyle{7 \over 7}} \right) + \displaystyle{1 \over 2}\left( {\displaystyle{2 \over {16}}} \right)} \right] = {\bf 0}.{\bf 671875}} $$
 $$\eqalign{{\bi Dominance}{\bi \;} _{{\bi L}2} & = \mathop \sum \nolimits_{{\bi j} = \lcub {{\bi R},{\bi L},{\bi W},{\bi S}} \rcub } {\bi \omega} _{\bi j}\left[ {\displaystyle{1 \over 2}\left( {\displaystyle{{{\bi P}_{{\bi i},{\bi j}}} \over 7}} \right) + \displaystyle{1 \over 2}\left( {\displaystyle{{{\bi H}_{{\bi i},{\bi j}}} \over {\bi K}}} \right)} \right] \cr & = 0.25\left[ {\displaystyle{1 \over 2}\left( {\displaystyle{6 \over 7}} \right) + \displaystyle{1 \over 2}\left( {\displaystyle{4 \over {16}}} \right)} \right] + 0.25\left[ {\displaystyle{1 \over 2}\left( {\displaystyle{6 \over 7}} \right) + \displaystyle{1 \over 2}\left( {\displaystyle{4 \over {16}}} \right)} \right] \cr &\quad + 0.25\left[ {\displaystyle{1 \over 2}\left( {\displaystyle{5 \over 7}} \right) + \displaystyle{1 \over 2}\left( {\displaystyle{2 \over {16}}} \right)} \right] \cr &\quad + 0.25\left[ {\displaystyle{1 \over 2}\left( {\displaystyle{4 \over 7}} \right) + \displaystyle{1 \over 2}\left( {\displaystyle{1 \over {16}}} \right)} \right] = {\bf 0}.{\bf 4609}} $$
Therefore the Ratio of Dominance for L1 will be 1 and the Ratio of Dominance for L2 will be
 $${\bi Rati}{\bi o}_{{\bi Dominance}{{\bi L}2}} = \displaystyle{{{\bi Dominance}\; _{{\bi L}2}} \over {{\bi Dominanc}{\bi e}_{{\bf L}1}}} = \displaystyle{{0.4609} \over {0.671875}} = 0.686$$