1. Introduction
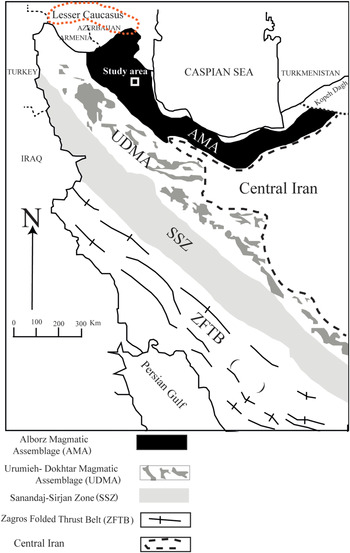
Volcanic rocks from the west Alborz Magmatic Assemblage (AMA; Fig. 1) record the final closure of the Neotethys Sea, ultimately initiating continent–continent collision that formed the Alpine–Himalayan orogenic belt. However, numerous questions remain about the exact timing and geometry of subduction, specifically, when did trench roll-back and enhanced melting of metasomatically enriched mantle affect the region. Although the west AMA is an ideal site to study the evolution of the Tethyan margin, relatively few studies have addressed the geodynamic events that led to the evolution of magmatism along the margin. Except for a few prominent and mostly Quaternary volcanic edifices, the NW Iran Tertiary volcanic domains remain poorly understood. This study attempts to fill that gap by combining bulk-rock geochemistry and U–Pb zircon geochronology to reveal the sources and processes involved in generating the magmatic rocks of the SE Ahar region.
Major tectonomagmatic units of Iran and the study area are shown on a map of Iran. The major structural units shown are after Alavi (Reference Alavi1996). The present study area and adjacent regions might simply be referred to as the West Alborz Cenozoic magmatism or west AMA. The Lesser Caucasus domain is from Rolland (Reference Rolland2017).

NW Iran (Fig. 1) sits at the intersection of four regional magmatic domains: the Urumieh–Dokhtar Magmatic Assemblage (UDMA), Central Iran, AMA and Lesser Caucasus domains, which surround the study area to the west, south, east and north, respectively (Aghanabati, Reference Aghanabati2004; Asiabanha & Foden, Reference Asiabanha and Foden2012; Jamali & Mehrabi, Reference Jamali and Mehrabi2015; Moritz et al. Reference Moritz, Rezeau, Ovtcharova, Tayan, Melkonyan, Hovakimyan, Ramazanov, Selby, Ulianov, Chiaradia and Putlitz2016). The western part of the AMA is also known as the Alborz–Azerbaijan or Arasbaran (Nabavi, Reference Nabavi1976; Babakhani et al. Reference Babakhani, Lesquyer and Rico1990; Allen et al. Reference Allen, Ghassemi, Shahrabi and Qorashi2003; Mokhtari et al. Reference Mokhtari, Moinvaziri, Ghorbani and Mehrpartou2010). The UDMA and AMA are two magmatic belts formed on the overlying Central Iranian Plate, underthrust by the Tethyan oceanic slab towards the northwest (Omrani et al. Reference Omrani, Agard, Whitechurch, Benoit, Prouteau and Jolivet2008). A chain of tectonic events stretching from the late Triassic Cimmerian orogeny to the Cenozoic collision of the Iranian Plate with Eurasia resulted in the development of the Alborz mountain range that includes the AMA (Jackson et al. Reference Jackson, Priestley, Allen and Berberian2002; Hassanzadeh et al. Reference Hassanzadeh, Stockli, Horton, Axen, Stockli, Grove, Schmitt and Walker2008). The UDMA is considered to be the major magmatic arc, whereas the AMA is suggested to represent its extensional or back-arc setting (Asiabanha & Foden, Reference Asiabanha and Foden2012).
Previously published radiometric ages for magmatic rocks from the west AMA (online Supplementary Material Fig. S1) and UDMA (see fig. 1 in Babazadeh et al. Reference Babazadeh, Ghorbani, Brocker, Antonio, Cottle, Gebbing, Mazzeo and Ahmadi2017) are post-Eocene in age (e.g. Omrani et al. Reference Omrani, Agard, Whitechurch, Benoit, Prouteau and Jolivet2008; Nabatian et al. Reference Nabatian, Ghaderi, Neubauer, Honarmand, Lui, Dong, Jiang and Bernroider2014). The similar age range and proximity of volcanic rocks in the UDMA and west AMA might suggest they were formed by the same processes. However, despite broad subduction-related compositional similarities between the UDMA and AMA volcanic rocks, there are significant geochemical differences. Specifically, volcanic rocks from the former are mainly calc-alkaline, whereas a large portion of volcanic rocks from the latter are alkaline and richer in trace elements (e.g. Jahangiri, Reference Jahangiri2007; Aghazadeh et al. Reference Aghazadeh, Castro, Rashidnejad Omran, Emami, Moinvaziri and Badrzadeh2010).
Although the above-mentioned studies have painted a basic picture of the sequence of events that formed the volcanic rocks of the west AMA, significant disagreement remains on the timing and nature of these events. Specifically, estimates of the age of Neotethyan oceanic closure range from Cretaceous (Berberian & King, Reference Berberian and King1981; Alavi, Reference Alavi1994) to Quaternary (Stöcklin, Reference Stöcklin1968). One model is that Paleocene slab break-off pre-dated flat-slab subduction (Agard et al. Reference Agard, Omrani, Jolivet, Whitechurch, Vrielynck, Spakman, Monie, Eyer and Wortel2011, fig. 10 therein). Flat-slab subduction of the Neotethyan oceanic plate beneath Central Iran was then followed by an Eocene volcanic flare-up, including eruption of tholeiitic to calc-alkaline rocks (Verdel et al. Reference Verdel, Wernicke, Hassanzadeh and Guest2011). Deepening of the slab continued through the Eocene period, ultimately prompting asthenospheric upwelling that developed a plume-derived signature in Oligocene time (Yeganehfar et al. Reference Yeganehfar, Ghorbani, Shinjo and Ghaderi2013; Ghorbani et al. Reference Ghorbani, Graham and Ghaderi2014). In a second and contrasting model, Omrani et al. (Reference Omrani, Agard, Whitechurch, Benoit, Prouteau and Jolivet2008) argued that Arabia–Eurasia continental collision did not begin until Oligocene time. However, the most recent literature considers the Eocene–Oligocene (Allen & Armstrong, Reference Allen and Armstrong2008; Horton et al. Reference Horton, Hassanzadeh, Stockli, Axen, Gillis, Guest, Amini, Fakhari, Zamanzadeh and Grove2008; Dargahi et al. Reference Dargahi, Arvin, Pan and Babaei2010) or Middle Miocene–Pliocene (Guest et al. Reference Guest, Stockli, Grove, Axen and Lam2006; Azizi & Moinevaziri, Reference Azizi and Moinevaziri2009) to be the most plausible ages for the onset of collision. This age range appears to have overlapped with the events that led to the back-arc development in the west AMA. A wide range of magmatic activity occurred in this period of time (e.g. Aghazadeh et al. Reference Aghazadeh, Castro, Badrzadeh and Vogt2011; Castro et al. Reference Castro, Aghazadeh, Badrzadeh and Chichorro2013; Nabatian et al. Reference Nabatian, Ghaderi, Neubauer, Honarmand, Lui, Dong, Jiang and Bernroider2014). Numerous works on collisional settings suggest that two or multiple source regions have been tapped to furnish partial melts for a variety of igneous rocks in a comparable period of time (e.g. Gao et al. Reference Gao, Yang, Hou, Wei, Meng and Tian2010; Ersoy et al. Reference Ersoy, Palmer, Genç, Prelević, Akal and Uysal2017; Rezeau et al. Reference Rezeau, Moritz, Leothold, Hovakimyan, Tayan and Chiaradia2017).
The main objective of the current study is thus to present new geochemical data and radiometric ages for the volcanic rocks of the west AMA to further elucidate the timing and nature of Tethyan subduction events. Importantly, this study presents new results for A-type and high-Nb Eocene to Late Miocene volcanic rocks and their geodynamic significance.
2. Geological overview
The AMA and the neighbouring UDMA are likely associated with early to late Cenozoic subduction-related magmatism on the Zagros hinterland (Berberian & King, Reference Berberian and King1981). The AMA, including the study area in SE Ahar, comprises basaltic–andesitic–dacitic lava and many granitoid intrusions with calc-alkaline to alkaline compositional affinity (M. Moayyed, unpub. Ph.D. thesis, Univ. Tabriz, 2001; Aghazadeh et al. Reference Aghazadeh, Castro, Badrzadeh and Vogt2011; Nabatian et al. Reference Nabatian, Ghaderi, Neubauer, Honarmand, Lui, Dong, Jiang and Bernroider2014). These calc-alkaline and potassic rocks are interpreted as arc and back-arc magmatism in an extensional, post-collisional tectonic setting (Asiabanha & Foden, Reference Asiabanha and Foden2012; Castro et al. Reference Castro, Aghazadeh, Badrzadeh and Chichorro2013; Nabatian et al. Reference Nabatian, Ghaderi, Neubauer, Honarmand, Lui, Dong, Jiang and Bernroider2014).
Owing to its presumed back-arc affinity, the AMA is believed to have postdated the major magmatism of the UDMA. Based on interlayered fossiliferous beds, the major phase of subduction-related magmatic rocks from the UDMA was traditionally considered to have been Middle Eocene in age (Emami et al. Reference Emami, Mohamad, Sadeghi and Omrani1996; Hajian, Reference Hajian2001). However, in recent years, dating of magmatic rocks from the UDMA and AMA revealed younger Oligocene and Miocene ages (Castro et al. Reference Castro, Aghazadeh, Badrzadeh and Chichorro2013; Ghorbani et al. Reference Ghorbani, Graham and Ghaderi2014). For example, Aghazadeh et al. (Reference Aghazadeh, Castro, Rashidnejad Omran, Emami, Moinvaziri and Badrzadeh2010, Reference Aghazadeh, Castro, Badrzadeh and Vogt2011) dated intermediate plutonic rocks of the Arasbaran–Tarum batholith (part of the AMA) to ∼28.9 Ma and 25 Ma. Given the prevailing view of older Eocene emplacement of the UDMA, they suggested that the back-arc volcanism recorded by the AMA is up to 30 Ma younger than magmatism along the main magmatic arc (the UDMA). However, subsequent work in the UDMA has revealed Oligocene and Miocene ages in the UDMA, suggesting that both domains experienced a complex history of magmatism, including significant post-Eocene magmatism (e.g. Chiu et al. Reference Chiu, Sun, Zarinkoub, Mihanadi, Khatib and Lizuka2013; Yeganehfar et al. Reference Yeganehfar, Ghorbani, Shinjo and Ghaderi2013; Ghorbani et al. Reference Ghorbani, Graham and Ghaderi2014; Babazadeh et al. Reference Babazadeh, Ghorbani, Brocker, Antonio, Cottle, Gebbing, Mazzeo and Ahmadi2017).
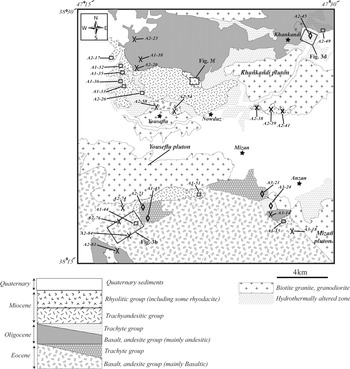
Cretaceous volcano-sedimentary sequences are the oldest rock units that crop out near to the study area; however, the presence of older crustal rocks is suggested by the inherited zircons retrieved from volcanic rocks in the present study. Palaeoproterozoic, Neoproterozoic–early Cambrian, Palaeozoic and Mesozoic ages (Hassanzadeh et al. Reference Hassanzadeh, Stockli, Horton, Axen, Stockli, Grove, Schmitt and Walker2008; Chaharlang & Ghorbani, Reference Chaharlang and Ghorbani2020) obtained for inherited zircons from igneous rocks imply the presence of older crustal materials underlying the Alborz, Sanandaj–Sirjan and Central Iran tectonomagmatic zones. Igneous rocks in the study area entirely comprise Tertiary magmatic rocks, including Eocene, Oligocene and Miocene rock units (Figs 2, 3). The Eocene units include basaltic, andesitic to dacitic–rhyolitic lavas, dykes and shallow intrusive rocks. The Oligocene unit is basaltic, andesitic, trachyandesitic to trachytic, and the Miocene unit is mainly trachybasaltic in composition. They are intruded by large intermediate to felsic plutonic bodies. For example, the Youseflu plutonic body is composed of monzodiorite–monzonite and granite. Younger Oligocene units include the south Khankandi plutonic body, composed of granodiorite, quartz monzonite and monzonite to gabbro intruded at ∼28.9 Ma (Aghazadeh et al. Reference Aghazadeh, Castro, Rashidnejad Omran, Emami, Moinvaziri and Badrzadeh2010). Finally, the Mizan plutonic bodies in the southern part of the study area include monzogabbro, monzonite, syenite and granites intruded at ∼24 Ma (Castro et al. Reference Castro, Aghazadeh, Badrzadeh and Chichorro2013).
Geological map of the study area in SE Ahar with major modifications after Mahdavi & Amini Fazl (Reference Mahdavi and Amini Fazl1988). Rectangles indicated as Figures 3b, d and f refer to the areas portrayed/covered in the respective figures (see Fig. 3).

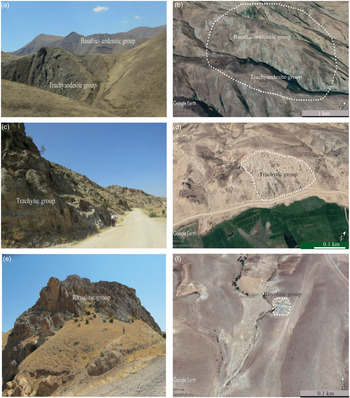
(a, c, e) Field images of the volcanic rocks from SE Ahar and (b, d, f) their Google Earth counterparts. (a) Subalkali basalts–andesites and HNBs, 8 km south of Youseflu; (b) A-type (trachytic) rocks, near Khankandi; (c) adakitic (rhyolitic) rocks, 4 km NE of Youseflu. The scales for Google Earth images are shown at the lower right corner.

The field relationships of the volcanic units in the study area are not conclusive. This is largely owing to the subsequent tectonomagmatic events. Specifically, significant portions of the study area have been affected by varying degrees of hydrothermal alteration imposed by multiple intrusive bodies (see above). However, original volcanic successions are maintained in some parts of the study area. The successions include mainly volcanic and pyroclastic rocks/beds demonstrating rather conformable contacts. The volcanic rocks are mainly basic to intermediate lava flows, whereas silica-richer bodies are felsic intrusive rocks/domes. Unfortunately, stratigraphic controls such as fossiliferous beds are absent in the study area.
3. Sampling and analytical methods
3.a. Sampling
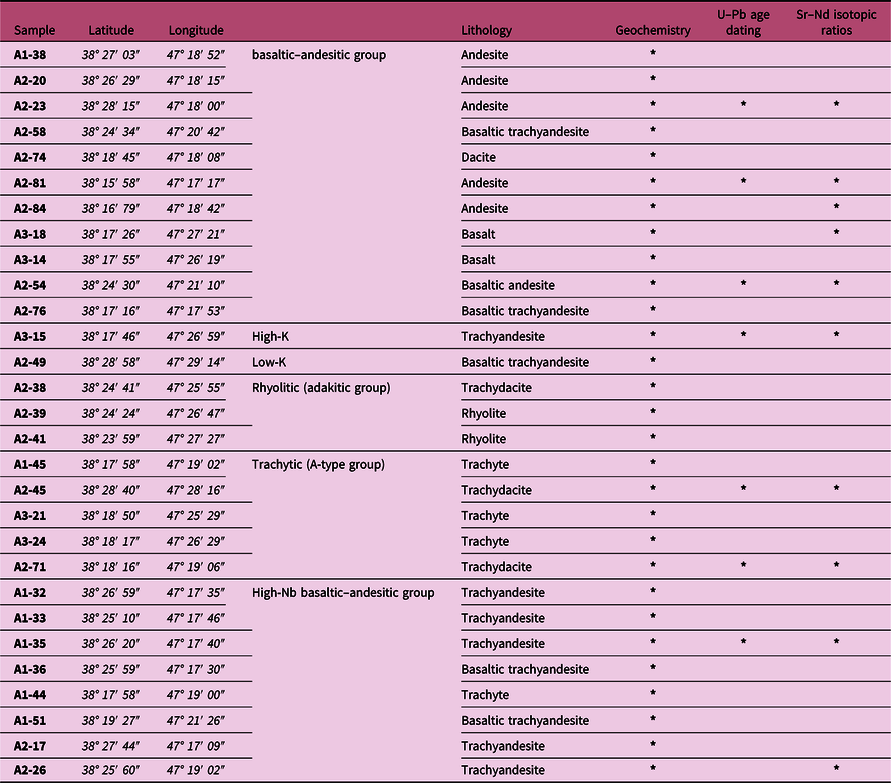
The primary strategy for sampling was adopted based on the volcanic rock units portrayed on the Ahar geological map (1:100<2>000). Efforts were made to sample all volcanic lithologies, including some lithologies not depicted on the base geological map. A total of 220 hand specimens were collected; 115 of those were selected for thin-sectioning based on their freshness, lithological variety, geographic distribution and presumed timing in the volcanic succession.
3.b. Whole-rock major and trace elements
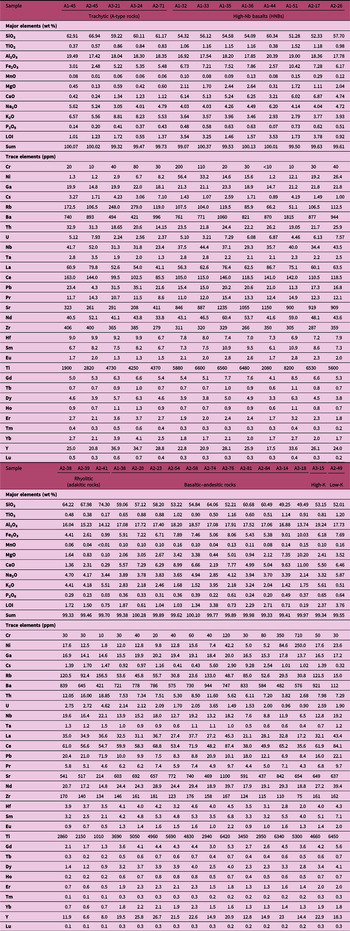
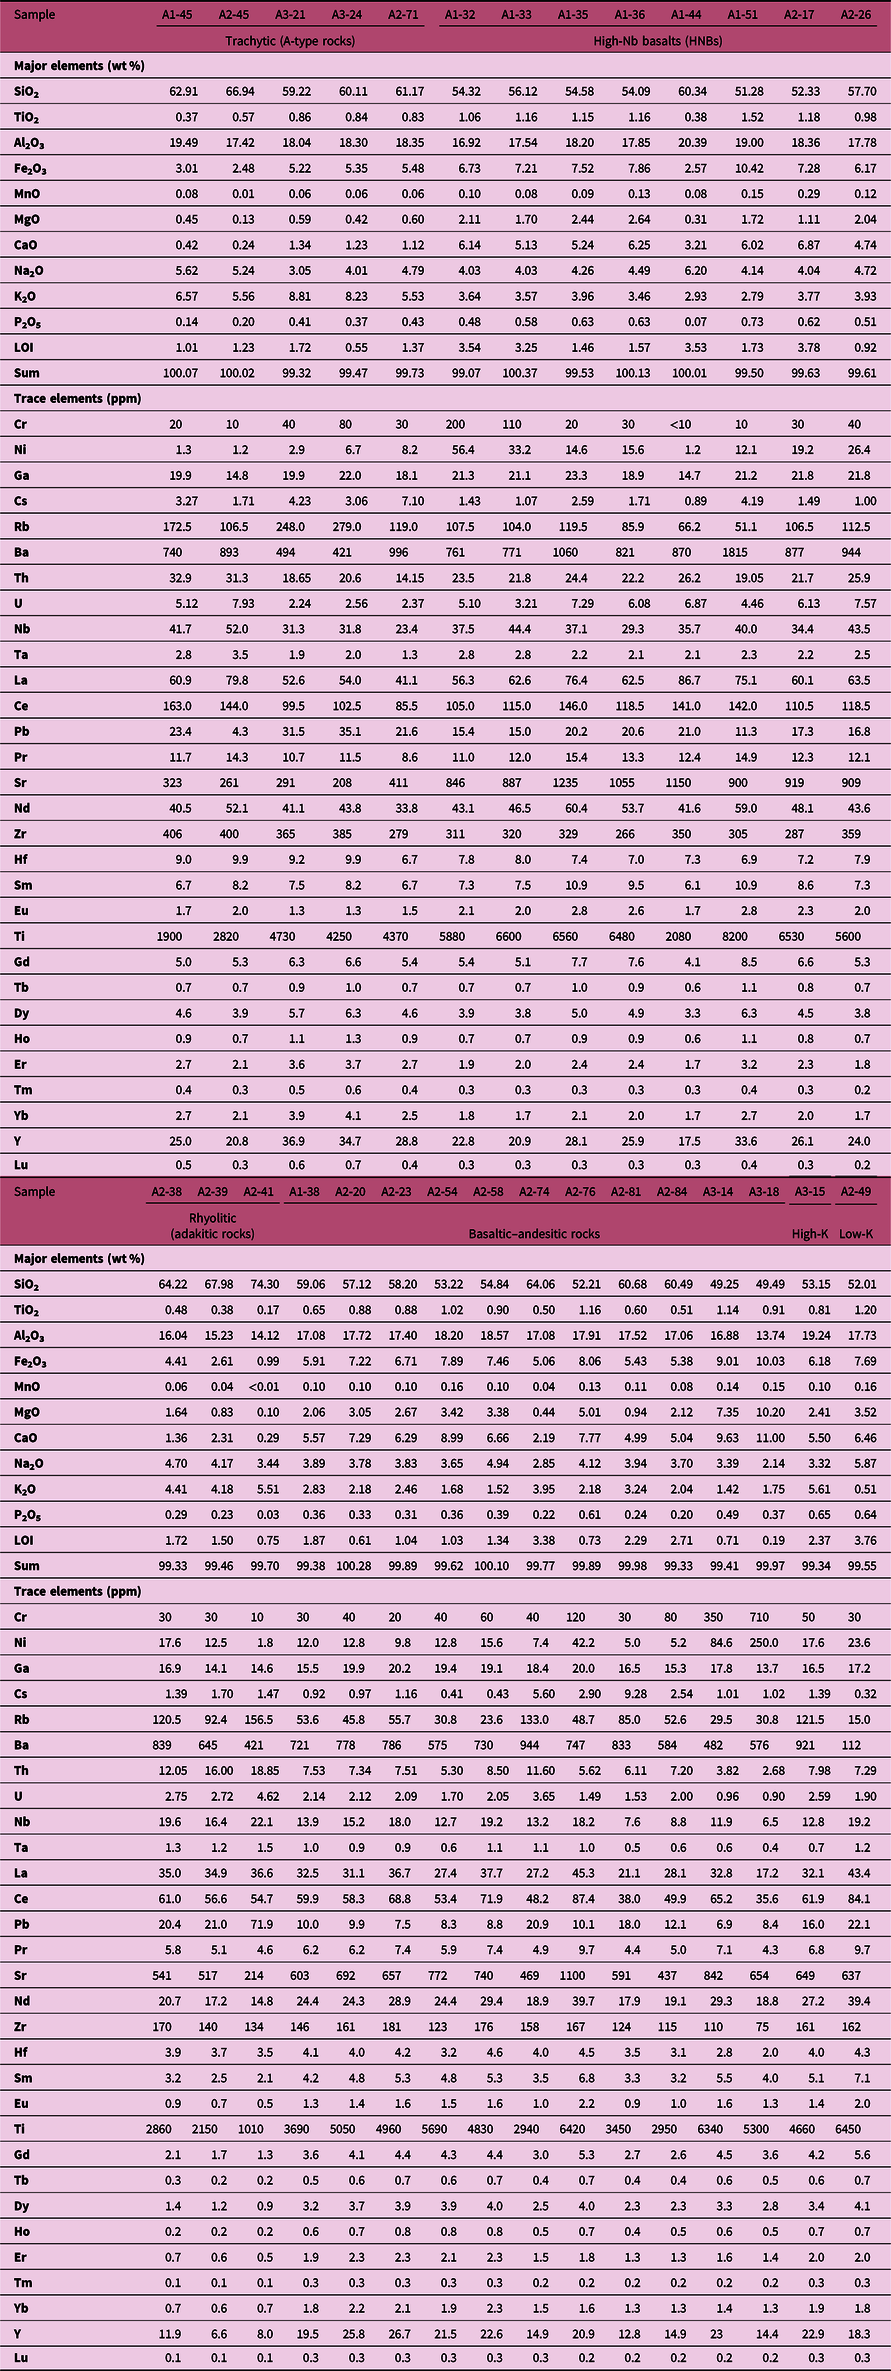
Whole-rock major- and trace-element concentrations were determined for 29 samples (Tables 1, 2) at the ALS Chemex Co. Ltd. in Guangzhou, China. Major-element oxides were measured on fused glass discs with lithium borate using a Phillips PW 1500 X-ray fluorescence (XRF) spectrometer. The analytical precision was better than 5 %, estimated from repeated analyses of the rock standards (GSR-1, GSR-4, GSR-9 and GSR-10; online Supplementary Material Table S1). Loss on ignition (LOI) was measured after heating to 1000 °C. Whole-rock trace elements were analysed using an Agilent 7700x inductively coupled plasma mass spectrometer (ICP-MS). The sample powder was added to lithium metaborate, mixed well and fused in a furnace at 1025 °C. After cooling, the samples were further digested in a distilled HF + HNO3 solution in Teflon bombs for several days, evaporated to near dryness, then diluted using super-pure HNO3 for ICP-MS analysis. The precision and accuracy for most trace elements were better than 5 % based on analyses of United States Geological Survey (USGS) rock standards (BCR-2, BHVO-2 and AGV-2; online Supplementary Material Table S2).
Sample numbers and rock types used for geochemical data acquisition in the current study

Major oxide (wt %) and trace-element (ppm) contents of representative samples from SE Ahar volcanic rocks
3.c. Sr and Nd isotopic analyses
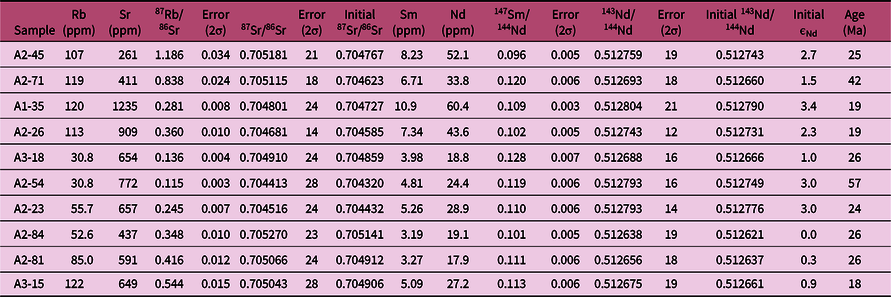
Sr and Nd isotopic compositions were determined for ten samples (Tables 1, 3) at the Laboratorio de Geologia Isotopica da Universidade de Aveiro, Portugal. The selected powdered samples were dissolved in HF/HNO3 solution in Teflon Parr acid digestion bombs at 180 °C for three days. After evaporation of the final solution, the samples were dissolved in HCl (6.2 N) and dried. The elements to be analysed were purified through the conventional ion chromatography technique in two stages: separation of Sr and rare earth elements (REEs) in an ion exchange column with AG8 50 W Bio-Rad cation exchange resin and purification of Nd from other lanthanide elements in columns with cation exchange Ln resin (Eichrom Technologies). All reagents used in the preparation of the samples were distilled through sub-boiling, and the water was produced by a Milli-Q Element (Millipore) apparatus. Sr was loaded on a single Ta filament with H3PO4, whereas Nd was loaded on a Ta outer-side filament with HCl in a triple filament arrangement. 87Sr/86Sr and 143Nd/144Nd isotopic ratios were determined through a multi-collector thermal ionization mass spectrometer (TIMS) VG Sector 54. Data were acquired in dynamic mode with peak measurements at 1–2 V for 88Sr and 0.5–1.0 V for 144Nd. Typical runs consisted of acquisition of 60 isotopic ratios. Sr and Nd isotopic ratios were corrected for mass fractionation relative to 88Sr/86Sr = 0.1194 and 146Nd/144Nd = 0.7219. During this study, the SRM-987 standard gave an average value of 87Sr/86Sr = 0.710266(14) (N = 13; confidence limit = 95 %), and the JNdi-1 standard gave an average value of 143Nd/144Nd = 0.5121016(59) (N = 10; confidence limit = 95 %).
Sr–Nd isotopic analyses of representative rocks from SE Ahar volcanic rocks

3.d. U–Pb dating
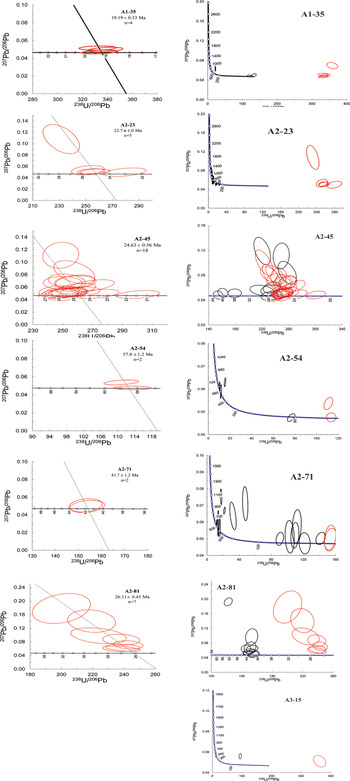
The purified zircon separates were mounted in epoxy and polished to reveal cross-sections parallel to the c-axis. The abundances of 238U, 235U, 206Pb and 207Pb were measured (Tables 1, 4) using a NWR-213 laser coupled to a Thermo ICAP-Q quadrupole mass spectrometer at Middlebury College in Vermont, USA. A laser spot size of 20 μm was used along with a 40 μm spot used for two-second ‘cleaning shots’ prior to each ablation. We used a laser energy of 5.00 J/cm2, a frequency of 10 Hz, dwell time of 30 seconds and a blank collection of 20 seconds. Isotopic fractionation was monitored and corrected using the primary zircon standard 91500 (Wiedenbeck et al. Reference Wiedenbeck, Alle, Corfu, Griffin, Meier and Oberli1995), along with the secondary standards 94-35 and Plešovice analysed in blocks interspersed between sets of six unknowns. Data were reduced using the Iolite software (Paton et al. Reference Paton, Hellstrom, Paul, Woodhead and Hergt2011), wherein any laser-shot time series showing multiple isotopic domains or strongly increasing or decreasing signals were discarded. Quoted uncertainties reflect the propagated uncertainties as exported from Iolite, which includes a propagated term for excess scatter in the secondary standards (e.g. step 5 in Horstwood et al. Reference Horstwood, Kosler, Gehrels, Jackson, McLean, Paton, Pearson, Sircombe, Sylvester, Vermeesch, Bowring, Condon and Schoene2016). Quoted uncertainties do not include propagated uncertainties for long-term variance of the secondary standards, decay constant or common-Pb correction. Inverse Concordia diagrams (Fig. 4) were constructed using the Isoplot 4.1 add-in for Microsoft Excel (Ludwig, Reference Ludwig1991). In addition to conventional U–Pb ages, a common-Pb corrected age is reported. Age estimates for each sample were estimated by taking the error weighted mean of the common-Pb corrected ages (labelled as ‘207corr’ in Table 4). These ages were computed using the ‘age7corr’ function in Isoplot, which first computes an anchored least squares fit to the data in inverse-Concordia space and then computes the 207-corrected age by intersecting that line with the Concordia line.
U–Pb data for zircons from SE Ahar volcanic rocks

Bold text – analyses included in the weight mean age estimate; Err. corr. – error correlation between the two preceding isotope ratios. Only estimated for Cenozoic-aged zircons; Discord. – the per cent discordance between the 207Pb–235U and 206Pb–238U ages; 207cor – the 207Pb corrected age as computed by the software Isoplot, assuming a common 207Pb/206Pb ratio of 0.83.
Inverse Concordia diagrams showing accepted shots for each sample. Preferred U–Pb crystallization ages are computed by a weighted linear fit (thin line) anchored at a ‘common’ 207Pb/206Pb ratio of 0.84 and taking the crystallization age where the linear fit intersects the Concordia line (thick line). Data related to the grains used to estimate the volcanic ages are shown in red.

4. Results
4.a. U–Pb geochronology
Seven samples were selected for zircon separation and age dating (Table 4). They were chosen to represent the whole spectrum of rock types identified in the study area based on mineralogy, texture and whole-rock geochemistry (see Section 4.c below). These include three subalkaline basalts–andesites (A2-54, A2-23 and A2-81) and four alkaline samples (two Amp-Bt trachybasalts, A1-35 and A3-15, and two trachytes, A2-71 and A2-45). For detailed mineralogy, texture and photomicrographs of these samples see online Supplementary Material Figure S2 and its caption. Rock samples yielded only 5 to 40 zircon grains each, limiting our ability to build stronger statistics on observed age populations. Grains themselves were also tiny, ranging from 50 to 120 μm in length and 20 to 50 μm in width, ranging in morphology from slightly rounded to euhedral to fragments. To this end, only cores were analysed in an attempt to obtain high-quality ablations of single age domains. In this case, ‘cores’ is used to describe the physical centre of the grain, and does not imply the existence of a younger rim. Recognizing the young age of the zircons, 232Th and 208Pb were not measured in an effort to increase counting statistics on 207Pb. Cathodoluminescence images were not obtained because of the small grain size and the lack of funding available for imaging.
The majority of zircon ages for the volcanic rocks from the study area represent crystallization ages (i.e. eruption age for volcanic rocks) of the host rocks. However, some older zircons are also present, which are regarded as inherited zircons.
4.a.1. Magmatic zircon ages
Estimates of eruptive age were made using the youngest cluster of ‘207-corrected’ ages that were within uncertainty of each other. These seven samples present the following ages in chronological order: A2-54 (57.0 ± 1.2 Ma; n = 2), A2-71 (41.7 ± 1.2 Ma; n = 2), A2-81 (26.1 ± 0.4 Ma, n = 7), A2-45 (24.6 ± 0.6 Ma; n = 18), A2-23 (23.7 ± 1.0 Ma; n = 5), A1-35 (19.2 ± 0.3 Ma; n = 4) and A3-15 (18 Ma; n = 1). The errors provided are 2-sigma analytical uncertainties. However, these underestimate the true uncertainty on the eruptive age because they do not account for the possibility that younger grains were missed owing to the small number of analyses.
The stated ages should be viewed as maximum constraints on the eruptive age, given that (1) zircons can crystallize in a magma prior to eruption, (2) the youngest population of zircons may have been missed, and (3) it is possible that older zircons could have been mobilized into the melt by the melting of older magmatic rocks. Thus, age estimates based on larger numbers of grains are relatively robust, whereas estimates based on few grains should be treated with appropriate care.
4.a.2. Inherited zircon ages
These zircons can be classified into two groups: (1) inherited zircons captured from broadly coeval magmatic rocks, and (2) inherited zircons from potential basement crustal rocks that span Palaeoproterozoic to Cretaceous time (online Supplementary Material Fig. S3). Inherited zircons from coeval but older magmatic rocks in the Tertiary succession are only present in sample A2-81, an andesite; these include five grains yielding 52, 44, 43, 42 and 41 Ma ages. Inherited zircons from older crustal rocks are present in five samples and encompass wide age ranges. The number of grains dated in each sample is: A3-15 (4 grains), A2-54 (5 grains), A2-23 (20 grains), A1-35 (4 grains) and A2-71 (8 grains). They are mostly late Neoproterozoic to Cambrian (i.e. 22 grains) in age, with a few Palaeoproterozoic zircon ages (i.e. 3 grains). Other inherited zircons include a few with Carboniferous, Devonian, Permian and Cretaceous ages.
4.b. Petrography
4.b.1. Subalkali basalts–andesites
The subalkali basalt–andesite rocks from the study area are porphyritic with a phenocryst mineral assemblage of Cpx ± Pl ± opaque ± Opx ± Ol (online Supplementary Material Fig. S2a, b, c). The groundmass of these volcanic rocks from the study area has essentially the same mineral assemblage as the phenocrysts. Except for olivine and orthopyroxene, which are mostly found as pseudomorphs, in most of the samples, the phenocrysts are mostly fresh and easily recognizable.
4.b.2. Trachytes
The trachytes from the study area mainly include sparse feldspar phenocrysts. The samples contain very few or lack ferromagnesian silicates, amphibole and biotite, either as phenocrysts or in the groundmass that is composed of feldspar microliths, glass and microcrystalline quartz. They are therefore inferred to be felsic and include trachytes. Feldspar microliths appear to demonstrate a preferred orientation in the groundmass of these samples (online Supplementary Material Fig. S2d, e).
4.b.3. Amp-Bt trachybasaltic rocks
The Amp-Bt trachybasaltic rocks show a porphyritic texture. Their phenocryst mineral assemblage comprises Pl + Cpx + opaque ± Amp ± Bt ± Opx (online Supplementary Material Fig. S2f). The groundmass of these rocks has the same mineral assemblage as their phenocrysts. Groundmass feldspar laths show some preferred orientation. Orthopyroxene, amphibole and biotite are partly altered but identifiable. In some samples, the amphiboles and biotites are completely replaced by secondary materials and locally replaced by opaque minerals. Only very rarely are volcanic rocks from the study area recognized to be profoundly altered with epidotization and carbonatization. These were avoided for geochemical analysis.
4.b.4. Rhyolites
The felsic samples (online Supplementary Material Fig. S2g) from SE Ahar are composed of a few feldspar phenocrysts set in a fine-grained leucocratic (i.e. devoid of Fe–Mg silicates and Fe–Ti oxides) groundmass. Some intergranular small quartz microphenocrysts are also present.
4.c. Major and trace elements
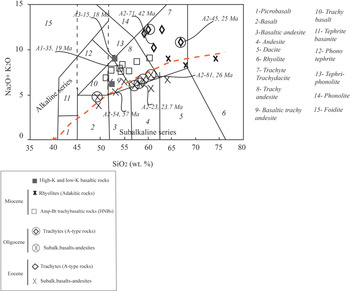
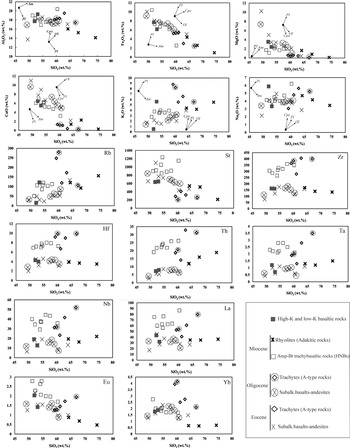
Volcanic rocks from the study area are mostly basic–intermediate and clearly separated into distinct alkali and subalkali series on the total alkalis versus silica (TAS) diagram (Fig. 5). The alkali samples plot across the trachybasaltic–trachyandesitic–trachytic domains, whereas the subalkali samples plot across the basaltic–andesitic–rhyolitic domains. These two series are indistinguishable on some of the major-element Harker variation diagrams (Fig. 6). The alkali rocks contain higher K and Th and lower Mg and Ca than their subalkali counterparts. Nevertheless, on silica versus high field strength element (HFSE) and some other trace-element diagrams (e.g. Hf, Zr, Ta, L, medium REE (MREE)), these two series are neatly separated. On silica versus heavy REE (HREE) diagrams, the alkali and subalkali rocks with up to 60 wt % silica overlap, whereas silica-richer alkali and subalkali rocks show significantly different HREE abundances and patterns.
SE Ahar volcanic rocks encompass a wide compositional range on the TAS (total alkali versus silica) diagram from subalkaline to alkaline and from mafic to felsic rocks. The diagram is after Le Bas et al. (Reference Le Bas, Le Maitre, Streckeisen and Zanettin1986).

SiO2 versus major- and selected trace-element plots for the volcanic rocks from the study area. Arrows demonstrate the differentiation trends likely to develop in the volcanic rocks when fractional crystallization (of the minerals shown) is the responsible mechanism (see text for discussion). Two series of arrows are shown, one is next to the subalkali basalts–andesites, and the other is next to the high-Nb basalts.

The most felsic members of the subalkali series (i.e. two rhyolitic and one trachytic sample; Fig. 5) are offset towards higher Na and lower Yb values. They are herein called the low-HREE (i.e. adakitic) series. Basic–intermediate members of the alkali series show high abundances of trace elements, particularly Nb, so they are herein called high-Nb basalts (HNBs). The most felsic members of the alkali series (i.e. five trachytic samples; Fig. 5) show different trace-element abundances and variation trends; owing to their higher alkaline contents as compared to their more basic counterparts, they are herein called A-type rocks.
Although we have thus far described and grouped the rocks in terms of their geochemistry, the subsequent sections group the rocks by the chronological order in which they were erupted.
4.c.1. The Eocene suite
4.c.1.a. The Eocene subalkali basalt–andesite group (∼57 Ma)
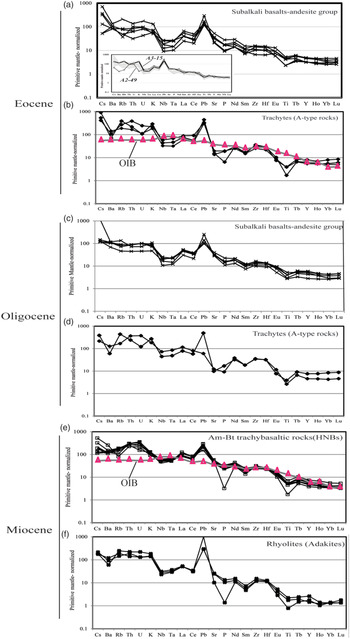
The Eocene subalkali basalts–andesites constitute a bimodal series: four basalts and two andesites separated by a compositional gap. On major-element Harker variation diagrams, they show decreasing variation trends for Fe, Ca, Mg and Al. Normalized trace-element patterns for these rocks show negative Nb–Ta anomalies with high large ion lithophile element (LILE)/HFSE ratios (Fig. 7a). The andesites show trace-element abundances similar to the basalts, except for Rb and Th, which are higher in the andesites, and Sr and Eu, which are lower in the andesites.
Primitive-mantle normalized trace-element patterns of different volcanic rock groups from SE Ahar. For explanation of the inset presented in diagram (a), see Section 4.c.3.c. Normalization values are from Sun & McDonough (Reference Sun, McDonough, Saunders and Norry1989).

4.c.1.b. The Eocene trachytes (A-type rock; ∼42 Ma)
On most Harker variation diagrams, the Eocene A-type rocks can be distinguished as the higher silica extension of the mafic alkali series. However, the trachytic A-type rocks also show distinctly higher contents of K, Rb and HREEs and lower Sr and Ca as compared to the mafic alkali rocks. The trachytic rocks show a decrease in K, Fe, Ti, Rb and HREEs and an increase in Na, Ba, Eu, Th, Nb, Ta and light REEs (LREEs) with increasing silica. Normalized trace-element patterns for the A-type rocks (Fig. 7b) are distinguished by rather high REE contents, particularly HREEs and HFSEs.
4.c.2. The Oligocene suite
4.c.2.a. The Oligocene subalkali basalt–andesite group (∼26 Ma and 24 Ma)
The Oligocene subalkali basalts–andesites are mostly andesites with a 55–60 wt % silica range. The andesites show the same Al and Na contents as the Eocene basalts, 1–3 wt % lower CaO, FeO and MgO and 1 wt % higher K2O. The andesites show slightly higher abundances of all trace elements except Sr as compared to the Eocene basalts. The only Oligocene basalt is more akin to the Oligocene andesites than the basaltic rocks from the study area (i.e. Eocene basalts). The former is richer in trace elements, Na and Al as compared to the latter (c.f. the Oligocene basalt and Eocene basalts at 50 wt % SiO2).
4.c.2.b. The Oligocene trachytes (A-type rocks; ∼25 Ma)
The Oligocene trachytes show the same compositional range as the Eocene trachytes that are discussed above (see Section 4.c.1.b).
4.c.3. The Miocene suite
4.c.3.a. The Miocene Amp-Bt trachybasaltic rocks (HNBs; ∼19 Ma)
The Miocene Amp-Bt trachybasaltic rocks are richer in Sr, Eu, Sm and Nd and poorer in Rb, K and HREEs as compared to the felsic alkali rocks (i.e. trachytes). With increasing Si in the HNBs, Ca, Al, Fe and Ti decrease, whereas alkalis and MgO remain unchanged or increase slightly. The HNBs also shows coherent decreasing MREE–HREE variation trends and coherent increasing Zr, Hf and Th variation trends. Normalized trace-element patterns for the HNBs (Fig. 7e) are characterized by tight clustering and a limited compositional variation. These patterns are also highly enriched in a wide range of trace elements, including immobile trace elements.
4.c.3.b. The rhyolites (adakites; Miocene?)
On the majority of the Harker diagrams, the rhyolitic rocks might appear as the more differentiated members of the subalkali basalts and andesites; however, the rhyolitic rocks exhibit higher K and Th and lower HREEs than the basaltic–andesitic rocks. The rhyolites shows a decrease in major elements with increasing silica (i.e. from 64 to 74 wt %), except for K that shows a minimal increase. Most trace elements decrease or remain invariant in the rhyolites, except Th, which shows a modest increase. Normalized trace-element patterns for the rhyolites (Fig. 7f) are identified by their depletion in HREEs. These show rather high LILE contents and low Nb–Ta and La–Ce abundances, with a small negative Nb–Ta anomaly.
4.c.3.c. Other samples: a low-K basaltic rock and a high-K basaltic rock
Two mafic samples from the study area with subalkaline immobile trace-element geochemical affinities show significant differences in LILE abundances (i.e. the inset in Fig. 7a) as compared to the more typical subalkali basalts–andesites. One sample shows exceptionally low LILE contents and lacks a negative Nb–Ta anomaly (i.e. A2-49), which we classify as a low-K basaltic rock. The other mafic sample (i.e. A3-15) is a high-K or LILE-enriched basaltic trachyandesite. This sample plots in the alkali field on the TAS diagram; however, on the normalized trace-element diagram as well as on most Harker diagrams, it is more akin to the subalkali series.
4.d. Sr–Nd isotopic data
Sr and Nd isotopic ratios were determined for a set of ten samples (Table 3) from SE Ahar belonging to the subalkali basalts–andesites (five samples), HNBs (two samples), A-type rocks (two sample) and a high-K basaltic rock (one sample). The initial 87Sr/ 86Sr and 143Nd/ 144Nd isotopic compositions for seven out of ten of these samples were calculated based on their ages obtained by zircon U–Pb dating (Table 4). For the remaining three samples, ages were assigned based on their compositional affinities. Sample A2-26 is a HNB rock, and, as such, it was assumed to have an age of 19 Ma. For the other two samples (A3-18 and A2-84), which belong to the subalkali basalt–andesite group, the calculations were made assuming a value of 26 Ma, because this is the age obtained in this group of samples. The initial Sr ratios vary from 0.704320 to 0.705141 (in A2-54 and A2-84, both from the subalkali basalt–andesite group). The initial Nd isotopic ratios vary from 0.512621 (in A2-84, a subalkali basalt) to 0.512790 (in A1-35, a HNB), which correspond to initial Nd values of 0.0 and +3.4, respectively.
5. Discussion
5.a. Alteration and element mobility
Development of secondary minerals in the volcanic rocks from the study area is strictly limited to a few pseudomorphs after primitive olivine and orthopyroxene (see Section 4.b). This along with LOI values lower than 2.71 wt % in most of the samples (i.e. except the HNBs, one subalkali basalt and one andesite) confirms negligible alteration effects; namely, that the original compositional characteristics of the volcanic rocks have not been obscured by postmagmatic processes (e.g. Yuan et al. Reference Yuan, Zhang, Xue, Lu and Zong2016; Xie et al. Reference Xie, Zhang, Campos, Cheng, Fei, Liu, Qiu, Santosh, Ke and Xu2018). Coherent variation in primitive-mantle normalized multi-element patterns of the SE Ahar volcanic rocks indicates the immobility of REEs and HFSEs, thereby confirming original igneous signatures (Polat & Hofmann, Reference Polat and Hofmann2003). Zr is considered immobile during postmagmatic alteration and is therefore used to monitor element mobility (Pearce et al. Reference Pearce, Thirlwall, Ingram, Murton, Arculus, van der Laan, Fryer, Pearce, Stokking, Ali, Arculus, Ballotti, Burke, Ciampo, Haggerty, Haston, Heling, Hobart, Ishii, Johnson, Lagabrielle, McCoy, Maekawa, Marlow, Milner, Motti, Murton, Phipps, Rigsby, Saboda, Stabell, van der Laan and Xu1992). Subalkali basalts–andesites and HNBs, which constitute a large number of samples from the study area, demonstrate systematic variation of mobile incompatible elements with Zr (online Supplementary Material Fig. S4), indicating relative immobility of the incompatible elements. This reaffirms that genuine magmatic geochemical signatures are maintained.
5.b. Rock classification
Discussed below in chronological order are the details of the petrogenesis of different groups of volcanic rocks from the study area.
5.c. Eocene subalkali basalts–andesites (∼57 Ma)
Olivine and orthopyroxene are common phenocrysts in the basaltic rocks from the study area. These are high-temperature liquidus phases indicating that they are crystallized from primitive-mantle-derived melts. Two other lines of evidence that support the mantle derivation of the subalkaline rocks are: (1) the arc-related trace-element affinity of the subalkaline rocks (online Supplementary Material Fig. S5) and (2) the mantle-derived Sr–Nd isotopic signature of the subalkaline rocks.
5.c.1. Fractional crystallization
The Eocene subalkaline basaltic rocks show low concentrations of compatible elements, Cr and Ni, implying significant differentiation. Steeply decreasing MgO with increasing silica confirms early fractionation of the ferromagnesian silicates olivine and orthopyroxene (Fig. 6). The two andesites from the Eocene subalkaline series show considerably lower Si, Fe, Mg and Ca contents (i.e. as compared to the basalts) at similar Al, alkali, REE and HFSE contents. This may indicate Pl + Cpx + Amp + Ap differentiation, which would have helped buffer trace-element abundance variations.
5.c.2. Source mantle characteristics
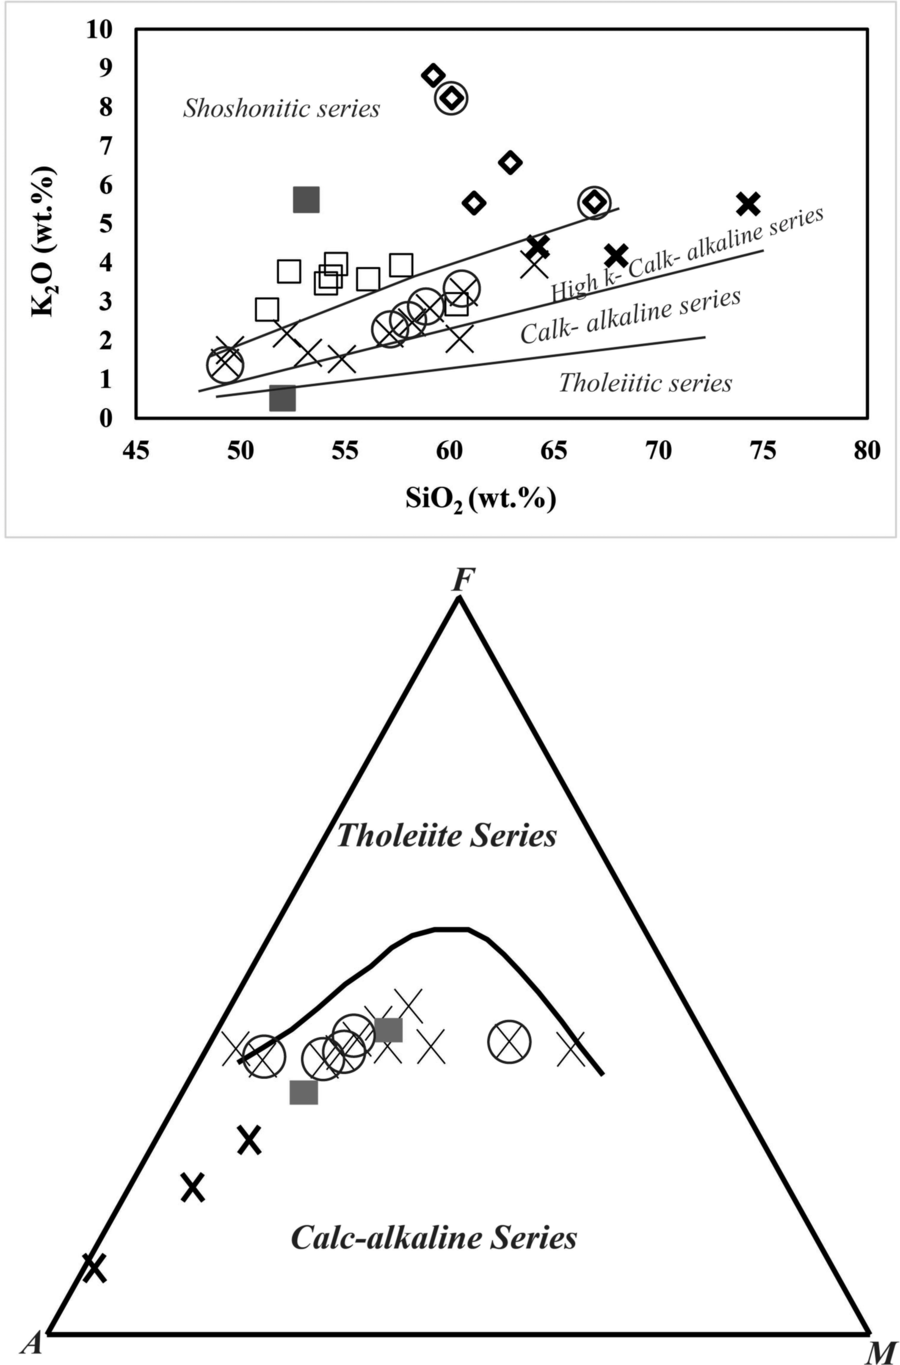
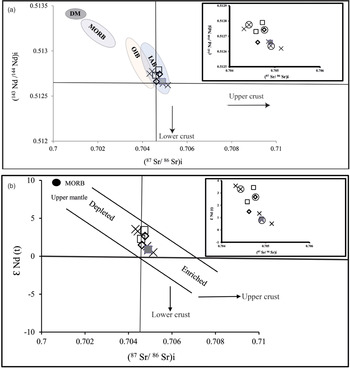
The position of the subalkali basalts–andesites on major-element discrimination diagrams such as the K2O versus silica or the AFM (i.e. Al2O3–FeO–MgO) diagram is consistent with the definition of normal calc-alkaline rocks (Fig. 8). The rocks show rather low abundances of highly incompatible immobile trace elements, specifically HFSEs and LREEs–MREEs, so they are akin to the calc-alkaline geochemical characteristics. Most importantly, they are enriched in LILEs and show negative Nb–Ta anomalies (Keppler, Reference Keppler1996; Foley et al. Reference Foley, Barth and Jenner2000). Both of these are well-established signatures of melts created by partial melting in a metasomatized mantle wedge when hydrous fluids and melts released by the subducting slab react with the overlying mantle wedge. This idea is further supported by Sr–Nd data showing that rocks of the basalt–andesite group plot in a region compatible with derivation of their parental melt from a lithospheric mantle (Fig. 9).
Subalkaline rocks from the study area, mainly subalkali basalts–andesites (see TAS diagram, Fig. 5), plot in the calc-alkaline domain on the K2O versus SiO2 and AFM (Al2O3–FeO–MgO) diagrams. Diagrams after Peccerillo & Taylor (Reference Peccerillo and Taylor1976) and Irvine & Baragar (Reference Irvine and Baragar1971), respectively. Symbols as in Figure 5.

(a) Initial Sr–Nd isotopic ratios are shown for representative samples from different groups of SE Ahar volcanic rocks. Domains for depleted mantle (DM), ocean island basalts (OIB) and island arc basalts (IAB) are after Zindler & Hart (Reference Zindler and Hart1986). (b) ɛNd(t) versus initial Sr isotopic ratio for SE Ahar volcanic rocks. Symbols as in Figure 5.

Different partition coefficients for REEs in aluminous phases of the upper mantle help estimate the mineralogy of the source mantle (Thirlwal et al. Reference Thirlwall, Smith, Graham, Theodorou, Hollings, Davidson and Arculus1994; Shaw et al. Reference Shaw, Baker, Menzies, Thirlwall and Ibrahim2003). Garnet prefers HREEs, so garnet-bearing mantle sources produce melts with fractionated REE patterns (i.e. with Dy/Yb(N) >2.5) whereas melts produced by shallower mantle sources, where spinel is stable, show lower Dy/Yb(N) ratios (<1.5; Yang et al. Reference Yang, Niu, Shan, Luo, Sun, Li, Li and Yu2012). Accordingly, the basaltic–andesitic rocks from the study area are rooted in spinel lherzolite mantle sources. However, using Sm/Yb ratios for modelling mantle partial melting (Aldanmaz et al. Reference Aldanmaz, Pearce, Thirwall and Mitchell2000) suggests a spinel–garnet-bearing mantle source (online Supplementary Material Fig. S6).
5.d. Eocene A-type volcanic rocks (∼42 Ma)
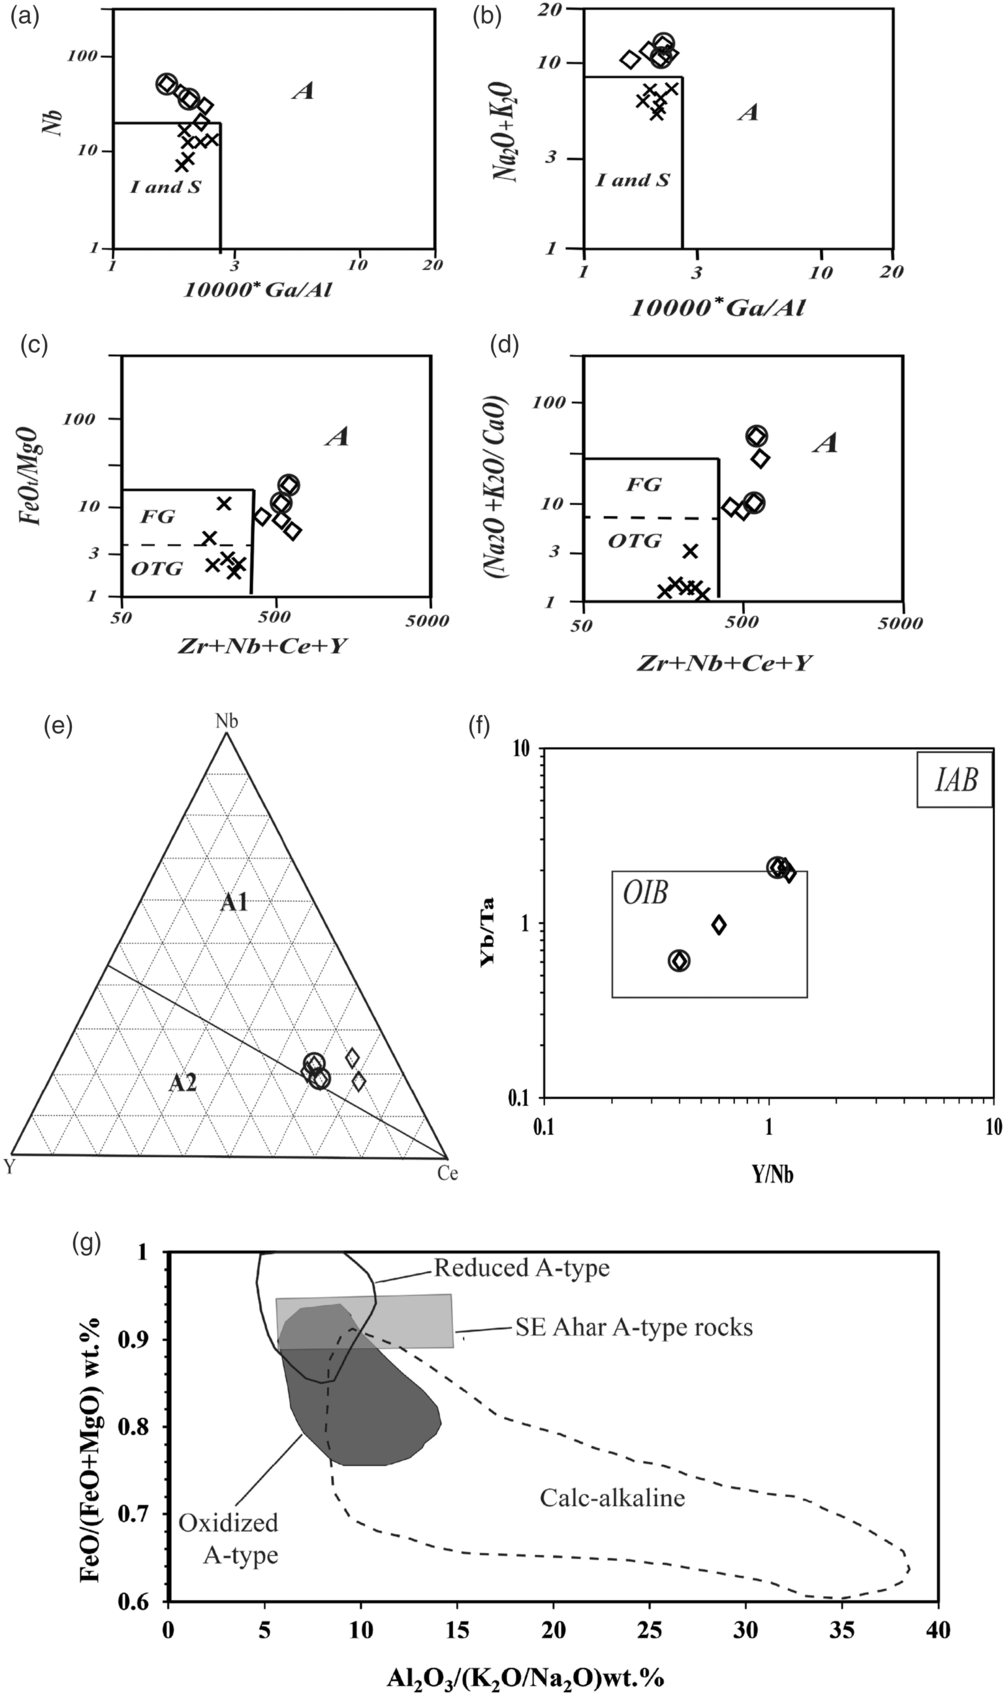
SE Ahar trachytic rocks are exceptionally enriched in incompatible trace elements, particularly K, Rb, Th, HFSEs, LREEs, HREEs and Y; therefore, they are considered to represent A-type magmatic rocks. The term ‘A-type felsic rocks’ is introduced to represent magmatic rocks with characteristic high alkaline abundances, high Ga/Al ratios and enrichments in Nb, Ta, Zr and Hf (Loiselle & Wones, Reference Loiselle and Wones1979; Collins et al. Reference Collins, Beams, White and Chappell1982; Whalen et al. Reference Whalen, Currie and Chappell1987) (Fig. 10a–d).
Felsic rocks from the study are shown on (a) Nb versus 10000* Ga/Al; (b) Na2O + K2O versus 10000* Ga/Al; (c) FeO/MgO versus Zr + Nb + Ce + Y; (d) (Na2O + K2O/CaO) versus Zr + Nb + Ce + Y diagrams. (e) Nb–Y–Ce ternary diagram discriminating between A1 and A2 subtypes. (f) Yb/Ta versus Y/Nb diagram discriminating between OIB-affinity and IAB-affinity rocks. (g) FeO/(FeO + MgO) wt % versus Al2O3/(K2O/Na2O) wt % diagram discriminating between oxidized A-type and reduced A-type rocks. These geochemical diagrams discriminate A-type magmatic rocks (SE Ahar trachytes) from other types (i.e. igneous, sedimentary and mantle types). These diagrams are usually used for granitic rocks. FG – fractionated granites; OTG – unfractionated granites. Domains shown for diagrams (a) to (d) are after Pearce et al. (Reference Pearce, Harris and Tindle1984) and Whalen et al. (Reference Whalen, Currie and Chappell1987), (e) and (f) are after Eby (Reference Eby1992) and (g) is after Dall’Agnol & Oliveira (Reference Dall’Agnol and Oliveira2007). Symbols as in Figure 5.

The SE Ahar A-type rocks show geochemical signatures atypical of magmatic rocks formed in a subduction-related setting. For example, they (1) lack a negative Nb–Ta anomaly, (2) are exceptionally poor in Ca, Mg and Sr, and (3) show extremely high abundances of K and other incompatible elements. An asthenospheric component is supported by trace-element enrichment (particularly high Nb–Ta) and normalized trace-element patterns similar to those of ocean island basalts (OIBs) (Fig. 7b). The A-type magmatic rocks indicate within-plate geochemical characters and are believed to have been commonly emplaced in an extensional geodynamic setting, either related to continental rift zones (i.e. anorogenic A-type rocks) or post-collision extensional regimes or continental arc to back-arc extension (Whalen et al. Reference Whalen, Currie and Chappell1987; Eby, Reference Eby1992; Turner et al. Reference Turner, Foden and Morrison1992; Dargahi et al. Reference Dargahi, Arvin, Pan and Babaei2010).
The binary A1–A2 classification scheme for A-type magmatic rocks is intended to reflect their contrasting origins and tectonic settings (Eby, Reference Eby1992). The A1-subtype shows intraplate OIB geochemical characteristics, whereas the A2-subtype shows island arc affinity. A-type samples from the study area plot at the boundary between the A1 and A2 subtypes (Fig. 10e), though a few of them tend towards the A1-domain. It seems as if the SE Ahar A-type samples show compositions intermediate between the A1 and A2 subtypes. This feature is supported by the SE Ahar A-type samples forming a compositional array between the OIB and island arc basalt (IAB) end-members (Fig. 10f) representing asthenospheric mantle and lithospheric mantle, respectively. Hence, a mixed asthenospheric–lithospheric mantle source is suggested to have supplied the parental magma for the A-type rocks. FeO/(FeO + MgO) ratios of these samples from the study area furnish further support for this hypothesis since the SE Ahar A-type rocks plot in the overlapping area of the reduced and oxidized subgroups (Fig. 10g) of A-type rocks (Anderson & Morrison, Reference Anderson and Morrison2005; Dall’Agnol & Oliveira, Reference Dall’Agnol and Oliveira2007). OIBs are usually evolved under conditions of lower H2O contents than IAB; these correspond to the reduced and oxidized subgroups, respectively.
In order to introduce an asthenospheric mantle component in subduction-related settings, slab break-off (Davies & von Blanckenburg, Reference Davies and von Blanckenburg1995; Wang et al. Reference Wang, Pandit, Zhao, Chen and Zheng2018) or slab roll-back (Okay & Sahinturk, Reference Okay, Sahinturk and Robinson1997; Boztug & Harlavan, Reference Boztug and Harlavan2008; Kaygusuz et al. Reference Kaygusuz, Siebel, Şen and Satir2008; Verdel et al. Reference Verdel, Wernicke, Hassanzadeh and Guest2011) have been suggested as the two major trigger mechanisms. Based on the sequences of events recognized in the study area, however, the slab roll-back mechanism is preferred here. A-type rocks from the study area are dated to ∼42 Ma. These pre-date the HNBs that are dated to ∼19 Ma (i.e. considered to represent slab break-off; see below). With increasing silica in the A-type rocks, they develop a negative P anomaly and their negative Ti anomaly deepens. These are associated with increasing Na, Ba, U–Th, Nb–Ta and LREEs and decreasing K, Rb and HREEs. It is thus likely that fractional crystallization of feldspar + opaque + apatite + a HREE-enriched accessory phase led to the variation trends observed in the A-type rocks from the study area.
5.e. Oligocene subalkali basalts–andesites (∼26 and 24 Ma)
The Oligocene subalkaline basic rocks are mainly andesitic with Fe and Mg abundances similar to the Eocene basaltic rocks. The Oligocene andesites do not follow curved variation trends as observed for the more basic rocks (i.e. mainly Eocene basalts). This rules out their differentiation from the basalts. Hence, the andesites are inferred to represent primitive melts. Trace elements and Sr–Nd isotopic signatures of the Oligocene andesites as compared to arc-related affinity settings support the derivation of their primitive melts from a lithospheric mantle (Fig. 9; online Supplementary Material Fig. S5). Higher Si and slightly higher alkalis and incompatible trace-element abundances in the andesites imply a moderately richer mantle source as compared to the Eocene basaltic rocks (Zindler & Hart, Reference Zindler and Hart1986; Müller & Groves, Reference Müller and Groves1995; Marquez et al. Reference Marquez, Oyarzun, Doblas and Verma1999). Higher fusible mineral contents (e.g. Cpx, Sp, Opx) and/or higher trace-element abundances of the fusible minerals in the source mantle help to develop such enriched mantle signatures (Pickering-Witter & Johnston, Reference Pickering-Witter and Johnston2000). The Oligocene basaltic rock shows geochemical characteristics more akin to the Oligocene andesites (see Section 4.c.2.a). The low Si content of this sample as compared to the Oligocene andesites might be due to the olivine cumulative nature of this sample (i.e. A3-14).
5.f. Oligocene A-type rocks (∼25 Ma)
The Oligocene A-type rocks have a similar compositional range to the Eocene A-type rocks and are inferred to have originated and evolved by the same petrogenetic processes as presented in the geodynamic model section (see Section 7 below).
5.g. Miocene high-Nb basalts (HNBs; ∼19 Ma)
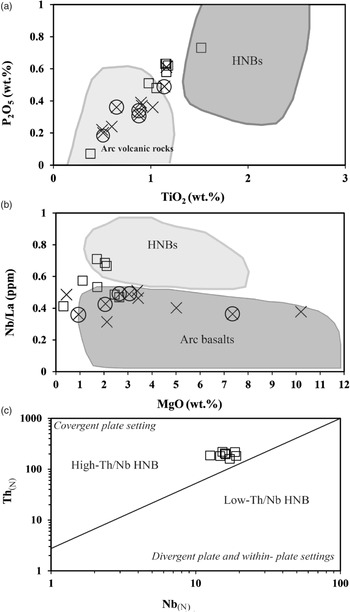
Basaltic trachyandesites with high Nb abundance (i.e. Nb >20 ppm) from the study area are defined as HNBs (Defant et al. Reference Defant, Jackson, Drummond, De Boer, Bellon, Feigenson, Maury and Stewart1992). These were found to represent a within-plate and arc-related geochemical signature. Various HNBs with positive to negative Nb–Ta anomalies on primitive-mantle normalized trace-element patterns (Fig. 7e) have been recognized in different arc-related settings and interpreted as OIB-like components in an arc geodynamic framework. Hastie et al. (Reference Hastie, Mitchell, Kerr, Minifie and Millar2011) believed that HNBs are basic melts with an intraplate signature generated in subduction zones (Fig. 11a, b); they were attributed to either (1) mantle wedge metasomatized by slab melts or (2) mixing products of an enriched (OIB-type) and a depleted (mid-ocean ridge basalt (MORB)-type) source mantle.
(a) P2O5 versus TiO2 plot; (b) Nb/La ratio versus MgO plot; and (c) ThN versus NbN diagram for SE Ahar mafic volcanic rocks that distinguishes high-Nb basaltic rocks (HNBs) from arc volcanic rocks (after Saccani, Reference Saccani2015). HNBs and arc volcanic domains are after Defant et al. (Reference Defant, Jackson, Drummond, De Boer, Bellon, Feigenson, Maury and Stewart1992). Symbols as in Figure 5.

The generation of HNBs in subduction settings is often attributed to either a mantle plume origin or a metasomatized mantle wedge (Reagan & Gill, Reference Reagan and Gill1989; Castillo et al. Reference Castillo, Rigby and Solidum2007). The mantle plume involvement (first hypothesis) is based on the compositional similarity of HNBs and OIB (Verma & Nelson, Reference Verma and Nelson1989; Castillo et al. Reference Castillo, Solidum and Punongbayan2002). We do not favour this hypothesis, because HNBs from the study area are not as rich in Nb and Ti as OIB, and their Sr–Nd isotopic values show no significant distinction from other volcanic rocks in the study area (Fig. 9). Instead we favour the second hypothesis, that the HNBs were derived from a metasomatized mantle wedge wherein the interaction between the mantle wedge and slab melts generates HFSE-rich mineral assemblages (Defant & Drummond, Reference Defant and Drummond1993; Sajona et al. Reference Sajona, Maury, Bellon, Cotton, Defant, Pubellier and Rangin1993, Reference Sajona, Maury, Bellon, Cotton and Defant1996; Zhang et al. Reference Zhang, Niu, Sato, Yu, Shan, Zhang, Ito and Nagao2005). This idea is supported by the high Sr/Y ratios of the high-Nb rocks, suggesting that the slab melts formed at high pressure. However, such a model would predict the existence of classic ‘slab-derived’ adakites in the study area. One explanation for their absence is that any slab melts formed were consumed in reaction with the mantle.
A significant oceanic crustal (slab) contribution in the petrogenesis of the high-Nb basaltic rocks from SE Ahar is implied by their high LOI abundances. Oceanic crust is well known for its hydrated nature and its involvement in the origin of HNBs, culminating in a high LOI content of the partial melt produced. High and low Th/Nb ratios were proposed as diagnostic identifiers of the petrogenesis of HNBs (Fig. 11c). High Th/Nb distinguishes convergent plate settings while low Th/Nb specifies divergent plate and within-plate settings. The SE Ahar volcanic rocks on these diagrams plot near the boundary between these two settings, with the majority of data plotting in the convergent plate domain.
Ca, Fe and K variation trends in the HNBs from the study area mimic the subalkali basalt–andesite compositional variation. However, the HNBs show decreasing Al and slightly increasing Mg variation trends that are different from the subalkaline series variation trends. A plagioclase + amphibole-dominated fractional crystallization appears to reasonably match the HNB compositional range. A major role for amphibole fractionation is particularly supported by decreasing MREE abundances in the HNBs from the study area. The petrography, too, is consistent with such a finding, because amphibole and plagioclase are ubiquitous phases in the HNBs from the study area.
5.h. Rhyolites (adakites)
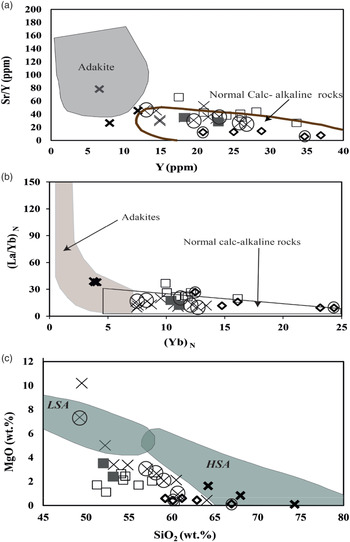
The rhyolites plot in the trachyte and rhyolite fields at the boundary between the alkaline and subalkaline series. The rhyolitic group is characterized by its lower HREE and Ca contents and higher Na as compared to the normal calc-alkaline rocks. These geochemical characteristics generally match the compositional signatures of adakites (Fig. 12a, b).
Rhyolitic rocks from SE Ahar tend towards the adakitic domain on (a) Sr/Y versus Y (domains are after Defant et al. Reference Defant, Richerson, De Boer, Stewart, Maury, Bellon, Drummond, Feigenson, Maury and Jackson1991; Defant & Drummond, Reference Defant and Drummond1990 and Martin et al. Reference Martin, Smithies, Rapp, Moyen and Charnpion2005) and (b) (La/Yb)N versus YbN (Defant & Drummond, Reference Defant and Drummond1990; Petford & Atherton, Reference Petford and Atherton1996) diagrams. (c) MgO versus SiO2 diagram for classifying adakites into high-silica adakites (HSA) and low-silica adakites (LSA) after Martin et al. (Reference Martin, Smithies, Rapp, Moyen and Charnpion2005). Adakitic rocks from SE Ahar plot in the HSA domain. Symbols as in Figure 5.

Adakites are regarded as subducted oceanic slab partial melts under high pressure where an omphacite and garnet ± amphibole mineral assemblage substitutes MORB (Rapp & Watson, Reference Rapp and Watson1995; Prouteau et al. Reference Prouteau, Scaillet, Picavant and Maury2001). The oceanic slab partial melt is highly enriched in Sr and depleted in HREEs. Martin et al. (Reference Martin, Smithies, Rapp, Moyen and Charnpion2005) classified adakites into high-silica and low-silica types. Adakite rocks from the study area are the high-silica (HSA) type (Fig. 12c), implying that they have not been derived from source regions that were reacted with the source mantle (Wang et al. Reference Wang, Song, Niu, Allen, Su, Wei, Zhang and Fu2017). The low contents of MgO and other incompatible elements confirm this finding.
Primarily, adakites were defined as the product of partial melting of subducted young, hot, flat oceanic slabs (Defant & Drummond, Reference Defant and Drummond1990). Other models proposed to account for the petrogenesis of adakitic rocks include partial melting of thickened mafic lower crustal rocks (Atherton & Petford, Reference Atherton and Petford1993; Yogodzinski et al. Reference Yogodzinski, Kay, Volynets, Koloskov and Kay1995; Petford & Atherton, Reference Petford and Atherton1996; Chung et al. Reference Chung, Liu, Ji, Chu, Lee, Wen, Lo, Lee, Qian and Zhang2003; Hou et al. Reference Hou, Gao, Qu, Rui and Mo2004; Chiaradia, Reference Chiaradia2009; Kamei et al. Reference Kamei, Miyake, Owada and Kimura2009) or high-pressure fractional crystallization from a mafic melt derived from mantle wedge peridotite (Muntener et al. Reference Muntener, Kelemen and Grove2001; Alonso-Perez et al. Reference Alonso-Perez, Muntener and Ulmer2009; Chiaradia, Reference Chiaradia2015).
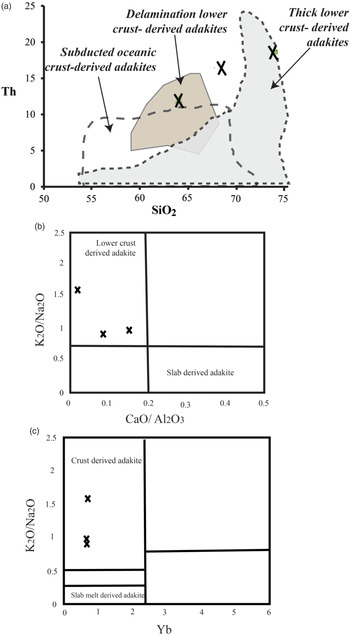
Although low HREE concentrations suggest classification as adakites, samples from the study area lack the Sr enrichment expected in typical adakites. The latter are derived from subducted oceanic slab melts at the high pressure of eclogite facies where plagioclase is unstable. High Th (Fig. 13a) and K abundances (Fig. 13b, c) in the SE Ahar adakites also make them akin to adakites derived from crustal rocks. Plagioclase might be considered as a residual phase in the crustal rocks. Plagioclase shows high partition coefficients (Kds) for Sr (>2; Reference Blundy, Robinson and WoodBlundy et al. 1998), so its presence in the crustal source rocks could lead to the Sr decrease in the induced adakite partial melt. High Sr isotopic ratios for the rhyolites would support this hypothesis. Isotopic data were not obtained for the rhyolitic rocks. Citing a relatively thin lithosphere (i.e. of 100 km thickness) and a rather thickened crust of 38.5–48 km for NW Iran, Lechman et al. (Reference Lechmann, Burg, Ulmer, Guillong and Faridi2018) suggested that asthenospheric ascent prompted thermal erosion of the lithospheric mantle, delamination of mantle slivers and a crustal lithospheric component. The latter idea of crustal delamination is consistent with a crustal source for the SE Ahar adakitic rocks.
Geochemical identification diagrams that help distinguish crustal-derived adakitic rocks from slab-derived adakites. (a) Th versus silica plot (after Wang et al. Reference Wang, Xu, Jian, Bao, Zhao, Li, Xiong and Ma2006 and references therein); (b) K2O/Na2O versus CaO/Al2O3 (after Li et al. Reference Li, Zhu, Wang, Zhao, Zhang, Liu, Chang, Lu, Dai and Zheng2016 and references therein), and (c) K2O/Na2O versus Yb plot (after Kamvong et al. Reference Kamvong, Zaw, Meffre, Mass, Stein and Lai2014 and references therein). Symbols as in Figure 5.

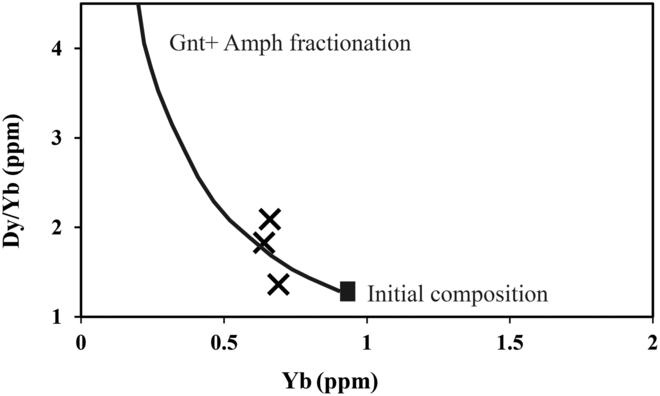
Rhyolitic rocks from the study area with adakitic characteristics could be formed by fractional crystallization of the more basic members of the volcanic succession described here. These rhyolites plot along a high-pressure differentiation trend on Figure 14. High-pressure fractional crystallization that mainly includes amphibole and garnet (Hidalgo et al. Reference Hidalgo, Vogel, Rooney, Currier and Layer2011) is expected to develop systematic Dy/Yb variation. However, the scarcity of amphibole phenocrysts in the rhyolitic rocks and the lack of a significant MREE negative anomaly does not support this hypothesis as the major process that led to the development of the adakitic characteristic of the SE Ahar rhyolitic rocks. Partial melting of lower crustal rocks appears to be the more acceptable alternative for the origin of the rhyolitic rocks.
High-pressure differentiation trend that mainly involves garnet + amphibole fractionation (Hidalgo et al. Reference Hidalgo, Vogel, Rooney, Currier and Layer2011) is shown along with the rhyolitic rocks (adakites) from SE Ahar. Symbols as in Figure 5.

5.i. The low-K basaltic rock and high-K basaltic rock
These are immobile trace-element poor volcanic rocks with contrasting LILE abundances. These rocks from the study area include two basaltic rocks, samples A3-15 and A2-49. The former is unique in the study area because, despite typical subduction characteristics (i.e. a high LILE/HFSE ratio), it is highly K enriched. It approaches the tephriphonolite field on the TAS diagram. This K-rich basaltic rock, which is of the same age as the HNBs from the study area (i.e. A1-35), is probably derived from a highly metasomatized part of the mantle wedge containing a higher amount of amphibole and phlogopite.
The latter sample from the study area (i.e. A2-49) apparently lacks the negative Nb–Ta anomaly that characterizes subduction-related magmatic rocks. However, its Nb–Ta abundances and its high LILE/HFSE ratios overlap those of subalkaline subduction-related melts. In fact this sample with low-K (i.e. tholeiitic) affinity is likely to represent the earlier stage of subduction-related magmatism in the region.
6. Degree of crustal contamination
Occurrence of a wide variety of magmatism in the study area in a rather short period of time (namely, 41–18 Ma) is an enigmatic aspect of the present study. This period of time coincides with events previously interpreted to be amplified or initial collisional events (e.g. Agard et al. Reference Agard, Omrani, Jolivet and Mouthereau2005; Vincent et al. Reference Vincent, Allen, Ismail-Zadeh, Flecker, Foland and Simmons2005; Ballato et al. Reference Ballato, Uba, Landgraf, Strecker, Sudo, Stockli, Friedrich and Tabatabaei2011; van Huen & Allen, Reference van Huen and Allen2011). Initial collisional magmatism was likely triggered by a variety of mechanisms that include slab break-off and delamination or thinning of the lithospheric mantle (Neill et al. Reference Neill, Melikestian, Allen, Navasarrdyan and Kuiper2015 and references therein). In addition to these processes, crustal contributions appear significant for some units. For example, the presence of inherited zircons in the SE Ahar volcanic rocks confirms some extent of crustal contamination. Inherited zircons in the subalkali basalts–andesites (i.e. three samples, A2-54, A2-23 and A2-81) and HNBs (i.e. one sample, A1-35) from the study area are restricted to late Palaeozoic–Precambrian basement zircons, whereas in the SE Ahar A-type volcanic rocks, they are mainly in the Palaeozoic–Mesozoic age range. Late Neoproterozoic – early Cambrian ages imply a hidden crustal basement for NW Iran, which is similar to the UDMA and Sanandaj–Sirjan Zone. These may be derived from rocks of the Cadomian orogeny (Ramezani & Tucker, Reference Ramezani and Tucker2003; Rahmati-Ilkhchi et al. Reference Rahmati-Ilkhchi, Faryad, Holub, Kosler and Frank2011) or amalgamation of NE Gondwana and the South China Block (Stampfli et al. Reference Stampfli, Hochard, Verard, Wilhem and vonRaumer2013; von Raumer et al. Reference von Raumer, Stampfli, Arenas and Sánchez Martínez2015). A few Palaeoproterozoic zircons indicate the incorporation of older crustal materials (i.e. those derived from the African craton and supplied by Central Iran sedimentary beds) in the late Neoproterozoic – early Cambrian magmatism (Chaharlang & Ghorbani, Reference Chaharlang and Ghorbani2020). The presence of 1870 Ma detrital zircons in the Tashk Formation siliciclastic rocks (Ramezani & Tucker, Reference Ramezani and Tucker2003) and their equivalent in N and W Iran, the Kahar Formation, indicates they could be the source of old xenocrystic zircons in the magmatic rocks. Alternatively, a hidden, subsurface Mesoproterozoic and Palaeoproterozoic magmatic source might be present. The zircons straddling the Carboniferous are regarded as being derived from the Eurasian arc, which resulted from Palaeotethyan oceanic plate subduction towards the north. The Cretaceous zircons indicate a Late Cretaceous magmatic episode that followed Neotethyan subduction (Chaharlang & Ghorbani, Reference Chaharlang and Ghorbani2020).
Another line of evidence for crustal contamination is high Th/La ratios in the SE Ahar HNBs (i.e. higher than former estimates of the Th/La ratios for Iranian magmatic rocks; see fig. 12 in Neill et al. Reference Neill, Melikestian, Allen, Navasarrdyan and Kuiper2015) that approach crustal values (Plank, Reference Plank2005), indicating a high degree of crustal contamination. Nevertheless, the SE Ahar subalkali basalts–andesites show relatively low Th/La ratios. High Th/La ratios in the HNBs might partly be due to the contribution of subducting slab partial melts that included oceanic sedimentary components.
7. Geodynamic evolution
Zircon U–Pb ages obtained for the volcanic rocks from the study area are integrated with the geochemical data to reconstruct the magmatic and geodynamic evolution; these are introduced here for the four groups of rocks. (1) The subalkali basalts–andesites present three ages, 57.0 ± 1.2 Ma, 23.7 ± 1.0 Ma and 26.1 ± 0.4 Ma. (2) The A-type rocks present two ages, 41.7 ± 1.2 Ma and 24.6 ± 0.6 Ma. (3) The HNBs present one age, 19.2 ± 0.3 Ma. (4) The adakitic rocks, owing to the low number of zircon grains retrieved, have not been age dated. The unique high-K basaltic sample appears to be 18 Ma in age, although this is based on a single zircon age. Except for its high potassium content, this basaltic sample is of the same geochemical characteristics as the subalkali basalts–andesites.
The subalkali basalts–andesites show explicit subduction-related signatures and settings. The A-type rocks and the HNBs are also closely affiliated with such settings (see Section 5 above). The U–Pb ages of these subduction-derived magmatic rocks allow speculation on whether they formed during a synorogenic or postorogenic phase of tectonism. Four samples with subduction-related signatures are dated as ∼57 Ma, 26 Ma, 24 Ma and 18 Ma. Former studies on magmatic rocks from NW Iran reported similar ages of 53 Ma (Hassanzadeh et al. Reference Hassanzadeh, Stockli, Horton, Axen, Stockli, Grove, Schmitt and Walker2008), 25 Ma and 23 Ma (Aghazadeh et al. Reference Aghazadeh, Castro, Rashidnejad Omran, Emami, Moinvaziri and Badrzadeh2010, Reference Aghazadeh, Castro, Badrzadeh and Vogt2011) for rocks with subduction-related signatures. These overlap temporally with samples from this study, which show the unprecedented geochemical signatures of A-type trachytic (∼42 Ma and 25 Ma) and Nb-enriched basaltic rocks (∼19 Ma), both well known for representing postorogenic and/or extensional conditions and settings (Zhao et al. Reference Zhao, Wang, Zou and Masuda1996; Han et al. Reference Han, Wang, Jahn, Hong, Kagami and Sun1997; Reference Jahn, Wu and ChenJahn et al. 2000a ,b; Wu et al. Reference Wu, Jahn, Wilde and Sun2000, Reference Wu, Sun, Li, Jahn and Wilde2002; Liu, Reference Liu2002; Liu & Fei, Reference Liu and Fei2006; Castillo, Reference Castillo2008; Macpherson et al. Reference Macpherson, Chiang, Hall, Nowell, Castillo and Thirlwall2010). Therefore, it appears that near ∼42 to 19 Ma both the mantle wedge and the asthenospheric mantle underwent concurrent partial melting. Asthenospheric mantle influx likely occurred through slab roll-back. Magmatic rocks with 37–42 Ma ages with an asthenospheric signature (Nabatian et al. Reference Nabatian, Ghaderi, Neubauer, Honarmand, Lui, Dong, Jiang and Bernroider2014) as well as magmatic rocks with 38–39 Ma ages with subduction-related signatures (Castro et al. Reference Castro, Aghazadeh, Badrzadeh and Chichorro2013) have been reported from NW Iran.
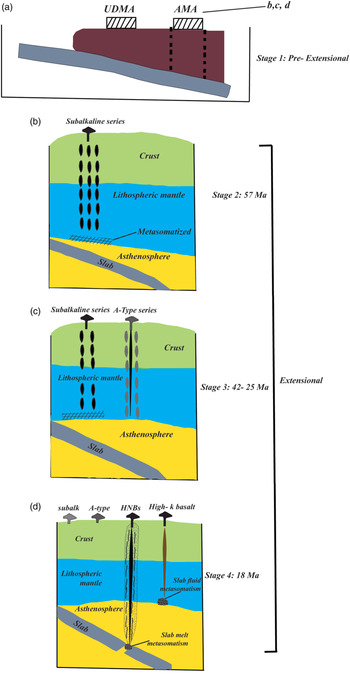
The results presented here are consistent with a model in which northeastward subduction of the Neotethyan oceanic slab gradually slowed, eventually prompting slab retreat followed by decompression melting and emplacement of the UDMA beginning in Eocene time (Fig. 15). Our results suggest that tholeiitic to calc-alkaline mafic melts and their differentiation products represent slab-fluid driven metasomatized mantle melting. Importantly, we show that this subalkaline magmatism in the SE Ahar area spans the Eocene to Late Miocene period (Fig. 15). We argue that asthenospheric mantle influx triggered by continued slab roll-back supplied the source material for the Early Miocene A-type melts that produced the trachytic rocks in SE Ahar. Further slab retreat and steepening exposed the slab to the higher temperatures and pressures of the asthenospheric mantle, which culminated in slab partial melting. The deep slab partial melts penetrated into and metasomatized the lithospheric mantle, thereby furnishing the source material for the Late Miocene HNBs in SE Ahar. Elevated temperature gradients imposed by the Late Miocene events might have induced lower crustal partial melting that produced the adakitic melts, which may be the youngest volcanic rocks in the suite.
Geodynamic model summarizing the SE Ahar magmatic compositional evolution through time.

This model is compatible with the timing/succession of asthenosphere-derived component emergence in the UDMA and AMA. Slab roll-back propagated westward (i.e. from the AMA towards the UDMA), so the asthenosphere influx underlying the AMA should have pre-dated the UDMA. A Late Eocene (i.e. 41 Ma) age for the A-type volcanic rocks from SE Ahar and an Oligocene (i.e. 25 Ma) age for the OIB-type rocks from the UDMA (Verdel et al. Reference Verdel, Wernicke, Hassanzadeh and Guest2011; Ghorbani et al. Reference Ghorbani, Graham and Ghaderi2014) seem consistent with the development of an enriched plume-type signature as roll-back proceeded towards the west. Higher alkaline and trace-element contents of the volcanic rocks from the AMA as compared to the UDMA are also compatible with the expected spatial distribution of arc magmatism. Both increasing continental crustal thickness towards the east (i.e. from the UDMA towards the AMA) and a likely back-arc position of the AMA are consistent with evolution of arc magmatism towards more alkaline affinities. Owing to the deeper slope of the slab beneath the AMA, slab melt metasomatism and subsequent HNB formation occurred here while it is absent in the UDMA. Ultimately, slab roll-back probably culminated in slab break-off.
Acknowledgements
This work is derived from the Ph.D. thesis by A.A. Funds and facilities provided by Tarbiat Modares University (TMU) is acknowledged. The authors are grateful for support and friendship provided by colleagues and students from TMU. This manuscript has greatly benefited from thoughtful reviews provided by Prof. I. Neill, Prof. K. Goodenough and an anonymous referee; their reviews are highly appreciated. Handling of the manuscript by Associate Editor, Prof. K. Goodenough is sincerely acknowledged. Whole-rock major- and trace-element analyses were financially supported by the National Science Foundation of China (41490614). Sr and Nd isotopic analyses were done under the scope of project Geobiotec (UID/GEO/04035/2013), funded by FCT (Portugal). Accommodation during fieldwork was generously provided by the Sungun Mine Complex.
Supplementary material
To view supplementary material for this article, please visit https://doi.org/10.1017/S0016756820000527