INTRODUCTION
The diagnosis of Alzheimer’s disease (AD) in clinical and research settings relies primarily on the observation of progressive cognitive and functional decline in the absence of other causes of dementia (American Psychiatric Association, 1994; McKhann, Drachman, Folstein, Katzman, Price, & Stadlan, Reference McKhann, Drachman, Folstein, Katzman, Price and Stadlan1984;). New research criteria for the diagnosis of AD were recently proposed which suggest that early and progressive decline in episodic memory with additional supporting suggestive features should form the core clinical basis for diagnosis (Dubois et al., Reference Dubois, Feldman, Jacova, DeKosky, Barberger-Gateau and Cummings2007).
The pattern of cognitive decline in AD typically involves early episodic memory impairment, followed by deficits in attention, visuospatial abilities, and language (Alladi et al., Reference Alladi, Xuereb, Bak, Nestor, Knibb and Patterson2007; Petersen, Reference Petersen1998) which is believed to correspond to initial pathology in the medial temporal lobe (particularly the entorhinal cortex and the hippocampal formation) with subsequent spread to other neocortical association regions (Alladi et al., Reference Alladi, Xuereb, Bak, Nestor, Knibb and Patterson2007; Hodges, Reference Hodges2006; Braak & Braak, Reference Braak and Braak1991). However, heterogeneity is observed both in brain regions affected by AD pathology and in clinical cognitive symptoms at presentation. Understanding the basis for this heterogeneity could lead to the elucidation of different etiological pathways amenable to intervention for the prevention and eventually treatment of AD.
AD primarily presents as an amnestic syndrome in contrast to other dementias such as frontotemporal dementia which may present with prominent speech or behavioral disturbances (Alladi et al., Reference Alladi, Xuereb, Bak, Nestor, Knibb and Patterson2007). Recent studies, however, indicate that considerable AD pathology can be observed in individuals presenting with focal syndromes (i.e., specific cognitive disturbances thought to originate from damage to certain cortical regions) (Alladi et al., Reference Alladi, Xuereb, Bak, Nestor, Knibb and Patterson2007; von Gunten, Bouras, Kovari, Giannakopoulos, & Hof, Reference von Gunten, Bouras, Kovari, Giannakopoulos and Hof2006) and that these atypical presentations may be more common than previously thought (Galton, Patterson, Xuereb, & Hodges, Reference Galton, Patterson, Xuereb and Hodges2000). Focal presentations described include posterior cortical atrophy, biparietal syndrome, progressive aphasia, cortical basal syndrome and “frontal” presentations involving marked behavioral symptoms and deficits in executive function (Alladi et al., Reference Alladi, Xuereb, Bak, Nestor, Knibb and Patterson2007; Schott et al., Reference Schott, Ridha, Crutch, Healy, Uphill and Warrington2006). Contrary to the pattern attributed to “typical AD,” amnesia may be a less prominent symptom in individuals with focal presentations suggesting relatively lower pathological burden of the medial temporal lobe (Alladi et al., Reference Alladi, Xuereb, Bak, Nestor, Knibb and Patterson2007).
Several studies have aimed to characterize the heterogeneity in the cognitive presentation of AD and to associate this heterogeneity with pathologic features (Kanne, Balota, Storandt, McKeel, & Morris, Reference Kanne, Balota, Storandt, McKeel and Morris1998; Pappas, Bayley, Bui, Hansen, & Thal, Reference Pappas, Bayley, Bui, Hansen and Thal2000); imaging profile (Snowden et al., Reference Snowden, Stopford, Julien, Thompson, Davidson and Gibbons2007; Stopford, Snowden, Thompson, & Neary, Reference Stopford, Snowden, Thompson and Neary2008); regional metabolism (Martin et al., Reference Martin, Brouwers, Lalonde, Cox, Teleska and Fedio1986); or clinical, demographic, and genetic features (Fisher, Rourke, Bieliauskas, Giordani, Berent, & Foster, Reference Fisher, Rourke, Bieliauskas, Giordani, Berent and Foster1996; Fisher, Rourke, & Bieliauskas, Reference Fisher, Rourke and Bieliauskas1999; Jacobs et al., Reference Jacobs, Sano, Marder, Bell, Bylsma and Lafleche1994; Sevush, Leve, & Brickman, Reference Sevush, Leve and Brickman1993; Sevush, Peruyera, Bertran, Cisneros, Reference Sevush, Peruyera, Bertran and Cisneros2003; Snowden et al., Reference Snowden, Stopford, Julien, Thompson, Davidson and Gibbons2007;). These studies often relied on factor or principal components analysis of data from cognitive tests believed to sample specific functions, or subscales of global scales of cognition. While some studies used individuals’ factor scores as the basis for tests of association with clinical or pathologic factors (Jacobs et al., Reference Jacobs, Sano, Marder, Bell, Bylsma and Lafleche1994; Kanne et al., Reference Kanne, Balota, Storandt, McKeel and Morris1998; Pappas et al., Reference Pappas, Bayley, Bui, Hansen and Thal2000; Sevush et al., Reference Sevush, Leve and Brickman1993; Sevush et al., Reference Sevush, Peruyera, Bertran and Cisneros2003), others used cluster analysis of factor scores to create homogenous groups of patients for analysis (Fisher et al., Reference Fisher, Rourke, Bieliauskas, Giordani, Berent and Foster1996, Reference Fisher, Rourke and Bieliauskas1999; Martin et al., Reference Martin, Brouwers, Lalonde, Cox, Teleska and Fedio1986; Stopford et al., Reference Stopford, Snowden, Thompson and Neary2008). Findings on the number of cognitive subgroups identified and the nature of these groups were not consistent.
Factor analysis has certain limitations in exploring subgroupings of individuals based on the analysis of cognition scores. Factor analysis should be performed on normally distributed data (Hatcher, Reference Hatcher1994), and it is likely that data from cognitive test scores, and particularly test subscales, may be extremely skewed due to floor and ceiling effects. Furthermore, the scaling of the different cognition tests or subscales may differ, with certain tests having greater inherent variance and sensitivity to differences between subjects than others. This might lead to difficulties in interpreting the results of factor analysis.
The current study aimed to explore the existence of cognitive subgroups of individuals with AD through the use of latent class analysis of cognitive subscale data collected from a large sample of subjects with AD. Latent class analysis (LCA) is a probabilistic technique used to detect homogenous subgroupings of individuals based on responses across several measured categorical variables (McCutcheon, Reference McCutcheon1987). Like factor analysis, it involves measurement of a latent variable but unlike factor analysis, an assumption is made that this variable is categorical in nature rather than continuous. An additional study aim was to explore potential associations of cognitive class membership with clinical, demographic and genetic factors. In particular, we were interested in investigating the role of age, disease duration, education and Apolipoprotein E-ε4 (APOE ε4) genotype in predicting class membership and in exploring the role of further covariates after adjustment for these factors.
METHOD
The analysis dataset of AD cases was drawn from a large case-control study of 875 AD patients and 850 nondemented control subjects recruited from nine Memory Referral Clinics in Canada between June 2002 and March 2005 described elsewhere (Li et al., Reference Li, Wetten, Li, St Jean, Upmanyu and Surh2008). The study protocol included neurological, neuropsychological, and laboratory assessments plus medical record review of dementia history (including neuroimaging) where available.
Inclusion criteria required that AD patients fulfilled criteria outlined in DSM-IV (American Psychiatric Association, 1994) and by NINCDS-ADRDA (McKhann et al., Reference McKhann, Drachman, Folstein, Katzman, Price and Stadlan1984) criteria for probable AD, with a Global Deterioration Scale (GDS) of 3–7 (ranging from mild to very severe cognitive decline) (Reisberg, Ferris, de Leon, & Crook, Reference Reisberg, Ferris, de Leon and Crook1982). Subjects were excluded if they were in a major depressive episode, acute psychosis, or acute manic or depressive episode of bipolar disorder at the time of recruitment. Neuroimaging was not required as part of the study protocol, although imaging at the time of AD diagnosis to rule out vascular and other causes of dementia would have been expected clinical practice. The study protocol was reviewed and approved by the appropriate ethics committee (EC) or investigational review board (IRB) for each study site before subject recruitment. Informed consent was obtained from study participants in accordance with all applicable IRB/EC and regulatory requirements.
The present study sample was restricted to 627 mild/moderate AD cases based on a total Mini-Mental State Examination (MMSE) (Folstein, Folstein, & McHugh, Reference Folstein, Folstein and McHugh1975) score of ≥15, to limit the influence of floor effects on the cognitive scales in severe AD.
Cognitive Assessment
Cognitive function was assessed with the MMSE (Folstein et al., Reference Folstein, Folstein and McHugh1975) and the Mattis Dementia Rating Scale-2 (DRS-2) (Jurica, Leitten, & Mattis, Reference Jurica, Leitten and Mattis2001; Mattis, Reference Mattis1976) scales. Scores on a total of 11 subscales from these tests were used in LCA to derive subgroups of cognitively similar patients based on impairment in specific cognitive domains. The DRS-2 subscales were defined according to Jurica et al. (Reference Jurica, Leitten and Mattis2001) as Attention, Conceptualization, Construction, Initiation/Perseveration, and Memory. The MMSE questions were grouped into the following categories: attention (spell “WORLD” backward), language (object naming, sentence repetition, writing a sentence, read and follow command “Close your eyes”), orientation (for time and place), memory (registration and recall of “apple,” “penny,” “table”), praxis (3-stage command), and construction (pentagon copy).
Data Analysis
Latent class analysis (LCA) of the 11 cognition subscale items was used to examine the latent structure of cognition in the sample of AD cases. To correct both for differences in range of possible scores on each subscale (1–37) which might affect weighting of the variable in the analysis, and for skewness of subscale score distributions, median total sample scores for each subscale were used as cut points to create dichotomous indicators for each subscale, corresponding to high/low scores based on the sample distribution. Low scores on both the MMSE and DRS-2 indicate greater impairment.
LCA is a probability-based clustering method which assumes that associations between individuals, based on responses for the observed items, can be explained by an underlying class structure (McCutcheon, Reference McCutcheon1987). This structure can be characterized through observation of the structural model consisting of latent class probabilities (gamma parameters which correspond to latent class prevalence) and the measurement model or item response probabilities, conditional on class membership (rho parameters) (Lanza, Collins, Lemmon, & Schafer, Reference Lanza, Collins, Lemmon and Schafer2007a). In the current analysis, the gamma parameters will correspond to the prevalence of each cognition class and the rho parameters, corresponding to probability of low scores in each of the measured cognitive domains, can be used to infer the cognitive profile associated with class membership. It is assumed that, within each latent class, individual items will be uncorrelated (McCutcheon, Reference McCutcheon1987). Selection of the number of latent classes was based on consideration of model parsimony, measures of goodness of fit [Bayesian Information Criterion (Schwartz, Reference Schwartz1978), and the Lo-Mendell-Rubin likelihood ratio test (Lo, Mendell, & Rubin, Reference Lo, Mendell and Rubin2001) as per Nylund, Asparouhov, and Muthén (Reference Nylund, Asparouhov and Muthén2007)] and substantive interpretation of class meaning. Consistency of model identification was examined by altering the seed that generates sets of random starting values.
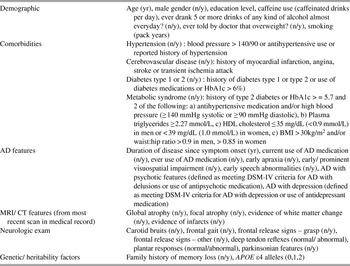
Association between class membership and covariates was assessed using multinomial logistic regression. Odds ratios reflect the increase in odds of class membership for each class (relative to a reference class) corresponding to a one-unit increase in the covariate. To characterize the classes, a large number of demographic, clinical, and disease-related factors were tested for association with class membership. These are described in Table 1. Variables found to improve model fit significantly (p < .05) in univariate regression models were then assessed via multiple regression models. First, we constructed a “minimal” regression model comprising variables believed to have the highest potential to confound univariate relationships. This “minimal” model included age, education, duration, and APOE ε4 genotype. Additional variables that were significant (p < .05) in univariate analyses were then assessed in turn for association with class membership, after adjustment for the minimal model covariates.
Summary of covariates

The possible confounding effect of disease duration on class membership was further assessed by stratifying the sample using cut points based on quartiles of disease duration. The latent class model was run again using duration quartile as a grouping variable to allow assessment of the probability of class membership within each duration stratum. A test for measurement invariance across groups was performed (see Lanza, Collins et al., Reference Lanza, Collins, Lemmon and Schafer2007a) to ensure that the measurement model held across the groups and that this analysis was valid.
LCA was performed with PROC LCA Version 1.1.3 (Lanza, Lemmon, Schafer, & Collins, Reference Lanza, Lemmon, Schafer and Collins2007b) using SAS software, Version 9.1 for WindowsFootnote a and was replicated using MPLUS Version 5.1 (Muthen & Muthen, Reference Muthen and Muthen2007). Covariate modeling was performed using PROC LCA. If data sparseness was highlighted as causing an error in the modeling process, the “Stabilize” function of Proc LCA was used, which added a data derived prior to stabilize the model (Lanza, Lemmon et al., Reference Lanza, Lemmon, Schafer and Collins2007b). Only PROC LCA results will be reported here as the class solutions derived were identical.
RESULTS
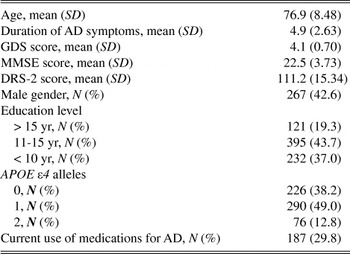
The study sample characteristics are summarized in Table 2.
Sample characteristics – total study sample (N = 627)

Review of the model fit statistics for LCA models fit sequentially with increasing numbers of classes indicated that a 4-class solution was optimal. The BIC was lowest for this solution and the Lo-Mendell-Rubin test for five classes failed to reach statistical significance suggesting that the addition of a fifth class did not improve model fit. The 4-class solution was substantively interpretable and variations in the seed value produced the same solution, indicating that the model estimation procedure identified the valid 4-class solution.
Class Descriptions
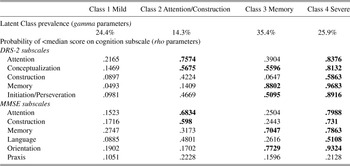
The prevalence of each class and the probabilities, conditional on class membership, of being in the lowest scoring 50% of the study sample for each cognition subscale are presented in Table 3 and graphically in Figure 1.
Graphic representation of Table 2 (Conditional Probability of < Median Score on Cognition Subtest by Class).

Latent class model

Note
Probabilities greater than .5 presented in bold to illustrate important items.
Based on review of the pattern of impairment across the cognition subscales, the classes were named “Mild,” “Attention/Construction,” “Memory,” and “Severe.” The Mild class was considered to represent a group of subjects with uniformly low probabilities of being in the lowest scoring half of the sample across all cognitive domains. The Severe class was also characterized by a fairly uniform level of impairment across all domains with consistently higher impairment across the domains relative to all the other classes. The Mild and the Severe classes were of nearly equal sizes with each accounting for approximately 25% of cases.
The other two classes showed distinct patterns of impairment in certain cognitive domains, rather than global mild or severe impairment. The Attention/Construction class was distinguished by predominant deficits in the attention and, to a lesser extent, the construction subscales of both the MMSE and the DRS-2 tests. Memory and orientation abilities appeared to be spared relative to attention and constructional abilities. Conversely, the “Memory” class was associated with predominant deficits on the DRS-2 memory and the MMSE memory and orientation subscales with relative sparing of attention, constructional, and language abilities. Probabilities for impairment on the conceptualization and initiation/perseveration DRS-2 subscales were fairly high both for the Attention/Construction class and the Memory class and these subscales thus did not differentiate between these two classes. The Attention/Construction class was also characterized by impairment in the MMSE language subscale relative to the Mild and Memory classes with probabilities of impairment similar to those for the Severe class. The Memory class was the most prevalent, accounting for 35% of cases, while the Attention/Construction class had the lowest prevalence at 14%.
Covariates Associated With Class Membership
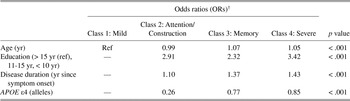
Univariate multinomial regression models indicated a significant role for age, duration, education, and APOE ε4 genotype (the minimum model covariates) in predicting class membership. These variables were entered into a multiple regression model (Table 4) and each covariate retained statistical significance after adjustment for all other variables. The Mild class were on average younger than the Severe and the Memory classes and slightly older than the Attention/Construction class. The Mild class was also the most highly educated with the Severe class having the greatest probability of lower education. The Severe class had the longest disease duration while the Mild class had the shortest.
Multiple multinomial logistic regression analysis: minimum model (N = 590)

† Odds ratio is odds of class membership relative to Class 1 associated with a one unit increase (continuous variables) or relative to reference value (categorical variables), adjusted for all other covariates.
Individuals in the Mild class were more likely than the other classes to have an APOE ε4 allele after adjustment for age, education, and disease duration. The Attention/Construction class were the least likely to be APOE ε4 positive. These findings were tested further with binary logistic regression modeling which compared each class with all the other classes. After adjustment for age, education, and disease duration, membership in the Mild class was associated with a higher likelihood of an APOE ε4 allele [odds ratio (OR) 1.53; p < .05] than membership in any other class, and membership in the Attention/Construction class was associated with a lower likelihood (OR 0.32; p < .001).
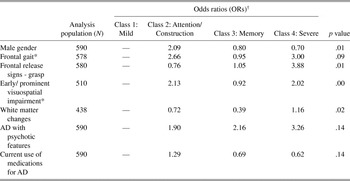
Of the additional variables explored, male sex, frontal gait, and frontal release signs as observed in the neurological examination, early/prominent visuospatial impairment, white matter changes as indicated on most recent MRI/CT scan, current use of medications for AD, and the presence of psychotic features were associated with class membership in univariate modeling and were, therefore, examined further after adjustment for the minimum model covariates (Table 5). Male sex, frontal release signs, early/prominent visuospatial impairment and white matter changes remained statistically significant (p < .05) after adjustment for age, education, disease duration, and APOE ε4 status while the other variables failed to contribute significantly to model fit.
Further multinomial logistic regression models: additional variables significant in univariate testing (p < .05) after adjustment for minimum model covariates

* Due to data sparseness, a data-derived prior was applied to stabilize logistic regression model.
† Odds ratio is odds of class membership relative to Class 1 associated with a one unit increase (continuous variables) or relative to reference value (categorical variables), adjusted for Minimum Model covariates.
Those in the Attention/Construction class were more likely to be male than those in the other classes. Those in the Severe class were more likely than those in other classes to show grasp reflexes; a sign consistent with their more advanced disease status even in this mild/moderate population. Early/prominent visuospatial impairment was most common in the Attention/Construction class and the Severe class and least common in the Memory class. The likelihood of white matter changes was lowest in the Memory class and greatest in the Severe class.
Class Prevalence by Duration Subgroup
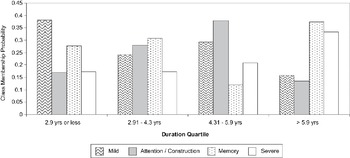
Figure 2 shows class membership probabilities (or class prevalence) generated from LCA conducted with disease duration quartile as a grouping variable. The test for measurement invariance was not statistically significant (difference in G2 log-likelihood = 156; df = 132; p = .08), indicating that comparison of class prevalence across duration categories was valid because the classes had the same composition across the different categories. Prevalence of the Mild class dropped across quartiles of disease duration, although this pattern was not monotonic, with a slightly increased prevalence in the third quartile compared with the second quartile. Conversely, prevalence of the Severe class increased with increased disease duration, although this increase was not particularly marked between quartiles 1 and 2. Prevalence of the Attention/Construction class increased with increasing disease duration but appeared to peak in the third quartile before dropping off in the highest quartile, possibly indicating that as duration progresses those with an Attention/Construction cognitive pattern assume a more globally severe profile. No clear pattern was observed for probability of membership in the Memory class; the prevalence appeared fairly constant across the quartiles of duration although lower in the third quartile.
Class Membership Probabilities as a Function of Duration.

DISCUSSION
Latent class analysis suggested the existence of four cognitive classes in our cross-sectional sample population. Two of the classes were characterized by a global pattern of impairment—one class with mild impairment and the other with severe. We did not find separate classes for predominant deficits in visuospatial construction and language respectively; instead individuals with deficits in these domains were grouped together with those who had predominant deficits in attention in our study, in the class designated Attention/Construction. This profile might be considered to represent a class with primary deficits in executive function, possibly associated with greater frontal pathology. The final, and largest, class comprised patients with a profile of predominant memory/orientation impairment, potentially representing predominant medial temporal lobe pathology.
Results from previous studies which used statistical methods to define typologies of AD based on patterns of cognitive impairment in AD differed markedly in their findings. Martin et al. (Reference Martin, Brouwers, Lalonde, Cox, Teleska and Fedio1986) applied cluster analytic methods to factor analysis of cognition tests from 42 AD patients and detected two clusters representing primary deficits in visuospatial function and in naming abilities. Using a similar methodology in two larger studies, Fisher et al. (Reference Fisher, Rourke, Bieliauskas, Giordani, Berent and Foster1996, Reference Fisher, Rourke and Bieliauskas1999) identified a globally impaired group in addition to groups with predominant impairments in visuospatial and naming abilities. A recent cluster analysis study identified global presentation types and focal presentations with disproportionate impairment in perceptuospatial ability, executive skills, praxis, and language (Stopford et al., Reference Stopford, Snowden, Thompson and Neary2008). Studies using factor analysis scores alone to characterize cognitive subtypes also differed in their findings, in terms of both the number of unique factors identified and the constructs believed to be measured by the factors. However, in keeping with our findings, several studies identified a memory (or memory/naming, memory/orientation) factor (Jacobs et al., Reference Jacobs, Sano, Marder, Bell, Bylsma and Lafleche1994; Kanne et al., Reference Kanne, Balota, Storandt, McKeel and Morris1998; Pappas et al., Reference Pappas, Bayley, Bui, Hansen and Thal2000; Sevush et al., Reference Sevush, Leve and Brickman1993, Reference Sevush, Peruyera, Bertran and Cisneros2003) and a factor indicating deficits in attention or mental control (Jacobs et al., Reference Jacobs, Sano, Marder, Bell, Bylsma and Lafleche1994; Kanne et al., Reference Kanne, Balota, Storandt, McKeel and Morris1998; Pappas et al., Reference Pappas, Bayley, Bui, Hansen and Thal2000) .
In a principal components analysis of subscale data from the MMSE and DRS from 236 AD patients, Jacobs et al. (Reference Jacobs, Sano, Marder, Bell, Bylsma and Lafleche1994) identified an attentional factor and a recall/naming factor. Early onset AD cases performed worse on the attentional items while late onset AD cases performed worse than early onset cases on measures of recall/naming. These findings correspond to our observation of a younger group with attentional deficits and an older group with predominant memory deficits. The younger group may indeed represent a group with younger age at onset, as disease duration did not differ markedly between the Attention/Construction class and the Memory class; however, it is not possible to conclude from the current analysis that membership in these classes was driven primarily by age at onset.
Members of the Attention/Construction class were more likely to be male than those in other classes after adjustment for age, duration, education and APOE ε4 genotype. This could reflect premorbid differences in cognitive style due to social or genetic factors although previous research suggests that males might be expected to outperform females in visuospatial tasks such as those required in the MMSE and DRS-2 construction subscales (Voyer, Voyer, & Bryden, Reference Voyer, Voyer and Bryden1995). It is also possible that there is an interaction between male sex and a potential AD disease pathway which manifests as a subphenotype with predominant attentional and/or constructional deficits.
The role of APOE ε4 as a risk factor for AD is consistently demonstrated but no clear association of this locus with a particular cognitive phenotype has been established. In studies of normal aging or mild cognitive impairment, associations were observed between APOE ε4 and emergent deficits in episodic memory (Bondi et al., Reference Bondi, Salmon, Monsch, Galasko, Butters and Klauber1995), spatial ability and naming (Bretsky et al., Reference Bretsky, Guralnik, Launer, Albert and Seeman2003), working memory/visuospatial attention (Greenwood, Lambert, Sunderland, & Parasuraman, Reference Greenwood, Lambert, Sunderland and Parasuraman2005), and orientation and language (Tsai, Gau, Liu, Hsieh, Liou, & Hong, Reference Tsai, Gau, Liu, Hsieh, Liou and Hong2008). There is also evidence from imaging studies that APOE ε4 is associated with greater hippocampal atrophy in the normally aging population (den Heijer, Oudkerk, Launer, van Duijn, Hofman, & Breteler, Reference den Heijer, Oudkerk, Launer, van Duijn, Hofman and Breteler2002); an area that is believed to be involved in memory function.
In a sample of 157 AD patients, Smith et al. (Reference Smith, Bohac, Waring, Kokmen, Tangalos and Ivnik1998) found an APOE ε4 effect on measures of memory (learning) and verbal comprehension but not on attention, perceptual organization, or naming. Marra et al. (Reference Marra, Bizzarro, Daniele, De Luca, Ferraccioli and Valenza2004) found APOE ε4 positive status to be associated with worse performance on measures of learning, verbal memory and general intelligence but only in those with early onset disease. Van der Flier, Schoonenboom, Pijnenburg, Fox, and Scheltens (Reference van der Flier, Schoonenboom, Pijnenburg, Fox and Scheltens2006) retrospectively classified 100 consecutive AD patients presenting to their clinic into those with memory and nonmemory phenotype based on description of earliest symptoms. The memory phenotype was associated with a higher likelihood of APOE ε4 positivity, while those with the nonmemory phenotype were less likely to be APOE ε4 positive. Schott et al. (Reference Schott, Ridha, Crutch, Healy, Uphill and Warrington2006) observed that some patients present with “biparietal” AD which is characterized by relatively preserved memory function but with impairment in calculation, spelling, praxis, and visuoperceptual and visuospatial abilities. They assessed the presentation of 39 AD patients and deemed 10 to have biparietal presentation according to neuropsychological criteria. Those with biparietal presentation were unlikely to have an APOE ε4 allele leading the authors to suggest that an alternative pathological pathway might be involved.
We did not find clear evidence that probability of membership in the Memory/Orientation class increased with increasing numbers of APOE ε4 alleles as might have been expected if APOE ε4 is primarily associated with a pathway that induces deficits in memory function; instead membership in the Mild class was most highly associated with increased numbers of APOE ε4 alleles. However, our finding that probability of membership in the Attention/Construction class decreased with APOE ε4 allele number is consistent with results from van der Flier et al. (Reference van der Flier, Schoonenboom, Pijnenburg, Fox and Scheltens2006) and Schott et al. (Reference Schott, Ridha, Crutch, Healy, Uphill and Warrington2006) in that we have identified a phenotype with less memory involvement, which may be associated with a pathway that is independent of the APOE ε4 allele .
In addition to the biparietal presentation described by Schott et al. (Reference Schott, Ridha, Crutch, Healy, Uphill and Warrington2006), frontal presentations of AD, characterized by behavioral symptoms and early executive dysfunction, were described in neuropathological studies (Alladi et al., Reference Alladi, Xuereb, Bak, Nestor, Knibb and Patterson2007; Johnson, Head, Kim, Starr, & Cotman, Reference Johnson, Head, Kim, Starr and Cotman1999; Kanne et al., Reference Kanne, Balota, Storandt, McKeel and Morris1998; von Gunten et al., Reference von Gunten, Bouras, Kovari, Giannakopoulos and Hof2006;). It is conceivable that the Attention/Construction class may represent those with biparietal AD or early frontal or prefrontal lobe involvement. It is also possible that this group included misclassified cases of frontotemporal or other types of dementia, even with the strict adherence to AD diagnostic algorithms in our study and at the time of AD diagnosis. Investigation of the pathologic or neuroimaging profile of those with APOE ε4-independent disease and nonmemory phenotype would be of interest in future studies.
Although our analyses of neuroimaging data were limited to those with information in the patient record, those in the memory class were least likely of any class to have evidence of white matter changes on MRI or CT and those with globally severe disease were most likely to have changes of this kind. It would be interesting to assess the role of vascular pathology as a source of heterogeneity in AD cognitive presentation and, specifically, to assess whether a persistent, singular memory impairment is indicative of a “purer” AD pathology.
Age and education were both significant predictors of class membership in our study. We chose to use unadjusted raw scores because age- and education-adjusted norms were not available for our MMSE subscales and because we were interested in exploring the contribution of these variables to class membership rather than in controlling their impact a priori. Age-associated decline in cognitive performance, independent of the decline in cognitive abilities associated with the AD disease process, may be associated with a specific pattern of deficits which may have obscured the pattern of deficits attributed to AD. After adjustment for age, education duration was highest in the mild group and lowest in the severe group. It is possible that high education may have masked deficits in certain cognitive domains and lower education may have led to the spurious finding of impairment. However, the extent to which education introduces a misclassification bias which should be controlled or is actually implicated in the pathological processes of AD is unclear (Tombaugh & McIntyre, Reference Tombaugh and McIntyre1992).
Although the presence of psychotic features appeared to be associated with membership in the severe class, this association did not hold after adjustment for age, duration, education, and APOE ε4 status. We were unable to detect any association between depression in AD and class membership. It is possible, however, that our capture of these features was insufficiently sensitive or, conversely, that the inclusion of medication use in the criteria for identifying patients with these features led to the inclusion of individuals with completely controlled symptoms, masking any potential effect. Furthermore, the study excluded subjects with acute depression or psychosis, which could potentially reflect behavioral subgroups.
While no association was detected between reported current use of medications indicated for the treatment of AD and class membership after adjustment for the minimum model covariates, a role for medication use in contributing to latent class membership cannot be ruled out. We did not analyze the effects of individual drugs or drug classes, and it is possible that these contributed to a certain cognitive profile to the extent that they may improve performance or reduce decline differentially across the cognitive domains. It is also possible that other medications commonly taken by the elderly may have affected cognitive performance, and the effect of this is difficult to ascertain.
The current study has several limitations. First, the MMSE and the DRS-2, while widely used screening tools for cognition, are crude instruments for measuring the cognitive domains in their subscales. Scaling in the latent class models as binary variables with cutoffs at the median potentially loses information relative to other approaches that consider the scores as continuous variables. Incorporating further neuropsychological testing as well as other cognitive domains may lead to a more refined classification. The cross-sectional study design and enrollment of subjects with different disease durations is a further limitation as it is not possible to ascertain whether individuals in the Attention/Construction and Memory classes had demonstrated a globally mild profile earlier in their disease or would develop a globally severe profile over time. Future longitudinal studies could enroll AD patients with recent onset of disease and could assess changes in class membership over time using latent transition analysis, an extension of the latent class analysis method (Lanza, Collins et al., Reference Lanza, Collins, Lemmon and Schafer2007a). Ceiling and floor effects of cognitive scales may make patterns difficult to detect at early and late stages of disease, and learning effects on cognitive tests may compromise accurate description of affected and unaffected domains over time (Zehnder, Blasi, Berres, Spiegel, & Monsch, Reference Zehnder, Blasi, Berres, Spiegel and Monsch2007). Finally, use of the DSM-IV and NINCDS-ADRDA criteria to define our AD sample may have yielded a research sample that was specific for AD but not fully representative of AD in clinical settings where mixed dementia and atypical AD presentations may be more common. This might have led to the exclusion of other latent classes which might be identified in a clinical setting.
An interesting point to consider is whether the underlying latent variable(s) inferred to exist through latent class analysis of cognition measures would truly be categorical in nature. Traditional factor analysis assumes a continuously distributed latent variable whereas latent class analysis assumes the latent variable to be categorical. The question is equivalent to asking whether inferred cognitive subtypes represent truly distinct categories, or arbitrary subdivisions of a spectrum. The answer to this is currently unclear given our current understanding of functional neuroanatomy and the etiology of cognitive deficits in AD. To the extent that a pattern of cognition, for example a deficit in attentional abilities, is driven by pathology in a certain brain region or the presence of a certain type of pathology, it is reasonable to suggest that the latent variable is categorical. It may also be that a certain threshold of pathology in an area must be reached for symptoms of loss to be detectable through tests of cognitive ability and this would give rise to a categorical latent variable. Finally, if unique patterns of cognitive deficits derive from pathology which is caused by genetic or other categorical risk factors, the latent variable could be categorical in nature.
In summary, our latent class analysis finding of multiple classes with unique cognitive profiles confirms the existence of heterogeneity in patterns of cognitive impairment in AD. To our knowledge this is the first application of latent class analysis to cognitive measures in AD. Several hypotheses have been suggested through this exploratory study that could be tested in future studies. In particular, class membership transitions should be explored over time, and the cognitive phenotype, pathological correlates, and potential etiology associated with APOE ε4-negative AD should be further investigated.
ACKNOWLEDGMENTS
We thank Daniella Dhalla and Natalie Coletta (GlaxoSmithKline Inc., Mississauga, Ontario, Canada) for study management; Allen Roses (GlaxoSmithKline R&D, Research Triangle Park, North Carolina, USA), Lefkos Middleton and Linda Surh (GlaxoSmithKline R&D, Harlow, UK) for GenADA study design and concept, and George Quartey (GlaxoSmithKline R&D, Harlow, UK) for analysis advice. This study was funded by GlaxoSmithKline R&D. Dr Bray’s contribution to the project described was supported by Award Number P50-DA-010075 from the National Institute on Drug Abuse. The content is solely the responsibility of the authors and does not necessarily represent the official views of the National Institute on Drug Abuse or the National Institutes of Health.