INTRODUCTION
Coffee is one of the most traded agricultural commodities, and worldwide millions of smallholder farming families depend on coffee as their main source of income (Rice, Reference Rice2003). The origin of coffee lies in Africa, with Coffea arabica L. (Arabica coffee) originating in Ethiopia and Coffea canephora Pierre ex A.Froehner (Robusta coffee) in the central lowlands of the African continent. Yearly over 6 million tons of coffee are traded, with an approximate value of 13.3 billion US Dollars (ICO, 2011). Africa exports about 21% of internationally traded coffee. While coffee exports from Asia and Latin America have shown an increasing trend between 2000 and 2011, the total coffee export from the African continent is decreasing (ICO, 2011).
The leading African coffee exporting country is Uganda, where approximately 500,000 smallholder farm systems with less than 1 ha of land depend on coffee as their main cash crop (You and Bolwig, Reference You and Bolwig2003). A smallholder farm system is ‘. . .a decision making unit comprising the farm household, cropping and livestock systems, that transform land, capital (external inputs) and labour (including genetic resources and knowledge) into useful products that can be consumed or sold’ (Fresco and Westphal, Reference Fresco and Westphal1988, p. 404). There is a rich diversity in smallholder farm systems at village level, and this diversity of farm systems requires the tailoring of development strategies, interventions and policies to their different needs and opportunities (Giller, Reference Giller2013). In the typical Ugandan smallholder farm systems with coffee production, coffee is intercropped with banana, which is the main staple food. Other crops are grown for own consumption and the surpluses are sold (Oduol and Aluma, Reference Oduol and Aluma1990). Besides providing income to smallholders, coffee production contributes about 20% to Ugandan national export revenues.
Following the general trend in Africa, total coffee production and coffee yield per ha in Uganda have been declining since the beginning of the 1990s (Baffes, Reference Baffes2006; ICO, 2011; You and Bolwig, Reference You and Bolwig2003). Two main reasons for this decline are the advanced age of the coffee trees and coffee wilt disease (Baffes, Reference Baffes2006). Coffee yield varies widely among smallholder farms as a result of differences in production systems, including management practices, investments in inputs, and soil fertility (Van Asten et al., Reference Van Asten, Wanyama, Mukasa, Nansamba, Kisaakye, Sserubiri, Bongers and Jassogne2012).
National and international agencies have identified coffee as a focus crop for development interventions (e.g. MAAIF, 2010; USAID, 2011), and they have defined activities that would allow farmers to increase coffee production and revenue bundled in four recommendations:
-
1. Improve productivity through enhanced coffee management practices (MAAIF, 2010; UCDA, 2008; USAID, 2011). The recommended activities for this are pruning and de-suckering coffee plants, soil erosion control, weeding with a slasher or herbicides (as opposed to weeding with a hoe), and pest control by pesticide application;
-
2. Increase productivity through improved soil nutrient management and fertility (Van Asten et al., Reference Van Asten, Wanyama, Mukasa, Nansamba, Kisaakye, Sserubiri, Bongers and Jassogne2012), by increasing the application of household compost, farmyard manure, mulch and mineral fertilizers;
-
3. Improve productivity, land-use efficiency and sustainability through intercropping with leguminous crops, shade trees and/or banana (Jassogne et al., Reference Jassogne, van Asten, Wanyama and Baret2013; UCDA, 2008; Van Asten et al., Reference Van Asten, Wairegi, Mukasa and Uringi2011); and
-
4. Increase revenue through coffee value addition at the farm level (MAAIF, 2010). This can be done by either drying and milling or de-husking the coffee, as opposed to selling fresh berries, or through certification schemes offering slightly higher prices.
These four recommendations to increase coffee production and revenue address the diversity of resources (land, labour and cash) among the farm systems. For example, to enhance coffee management practices requires labour or cash to hire labour, to improve the soil nutrient management and fertility requires labour and cash to buy nutrients, to apply intercropping requires space between coffee plants to grow another crop, and to add value to coffee requires labour and the possibility to postpone cash income. While the fastest and easiest way to obtain income from coffee is selling fresh berries directly from the field to middle-men, drying and milling or de-husking requires additional time and labour but gives a higher price. Selling through certification schemes might require even more time as this is done through farmer organizations that bulk coffee before sales, and the premium payments are often in the form of ‘second payments’ for each kilogram of coffee actually exported. The time between coffee harvest and cash income can therefore range between weeks and a few months. On the other hand, certification could offer opportunities for training and advice on recommended practices and could be developed to cater for access to inputs on a check-off basis.
The current recommendations to increase coffee production and revenue in Uganda disregard any diversity among the farms producing coffee. The potential for adoption, defined as ‘the likelihood of uptake of a new technology or practice when required information and material are made available to the farmer’ (Franzel et al., Reference Franzel, Coe, Cooper, Place and Scherr2001, p. 38), of recommended practices however also differs much among farms. Many studies have looked at which variables influence adoption potential of agricultural practices (e.g. Adesina and Baidu-Forson, Reference Adesina and Baidu-Forson1995; Franzel, Reference Franzel1999; Gibreel, Reference Gibreel2012), but there seems to be no universal understanding (Knowler and Bradshaw, Reference Knowler and Bradshaw2007). The availability of the resources land, labour and cash however is often identified to be of influence in small-scale farm systems in Africa (Bidogeza et al., Reference Bidogeza, Berentsen, De Graaff and Oude Lansink2009; Franzel et al., Reference Franzel, Coe, Cooper, Place and Scherr2001; Kamanga et al., Reference Kamanga, Waddington, Robertson and Giller2009; Shepherd and Soule, Reference Shepherd and Soule1998), and the way resources are used and interlinked influences the flexibility of farm systems (Darnhofer et al., Reference Darnhofer, Bellon, Dedieu and Milestad2010). The diversity in resource availability among smallholder farms with coffee in Uganda manifests as large variability in coffee production and income (Van Asten et al., Reference Van Asten, Wanyama, Mukasa, Nansamba, Kisaakye, Sserubiri, Bongers and Jassogne2012). Also, building on current practice is easier than adopting entirely new practices. Thus understanding the farm types’ resource availability, farm systems output in terms of coffee production and revenue, and current use of recommended practices contribute to understanding the adoption potential of recommended practices for the different farm types.
With the intention of guiding efforts to increase coffee production and revenue in Uganda, in this paper we (i) provide a typology of farm systems with coffee, (ii) assess the diversity in resource availability, coffee production and revenue, and current use of recommended practices, and (iii) evaluate the adoption potential of recommendations for different farm types with coffee.
MATERIALS AND METHODS
Research area
The research was conducted in Uganda, East Africa. Uganda has a tropical climate with generally two rainy seasons. Uganda produces an average of 190,000 tons of coffee annually (2009–2011), of which approximately 80% is Robusta coffee and 20% is Arabica coffee (ICO, 2011). Both types of coffee are important cash crops for smallholder farming households. We therefore analysed farm systems on Mount Elgon in the Eastern region growing Arabica coffee, and farm systems in the lower areas of the Southern region of Uganda growing Robusta coffee. Farmers on Mount Elgon produce Arabica coffee at altitudes of 1300–2300 m above sea-level, with rainfall of 1000–1500 mm, and farmers in the Southern region produce Robusta coffee at altitudes of 1100–1500 m above sea level, with rainfall of 875–1125 mm (NEMA, 2009). According to the Uganda National Household Survey of 2005–2006 approximately 40% of all the farm systems in both regions produce coffee. Tenure systems in the two regions are the same, and farm sizes are comparable with 1.1 ha in the East and 1.0 ha in the Central-South (UBOS, 2010 B). Slightly more farming households in the Eastern region report to experience food shortage (57.5% compared to 49.1% in the Central-South), but they also report to access slightly more agricultural credit than the farming households in the Central-South (UBOS, 2010 A).
Data collection
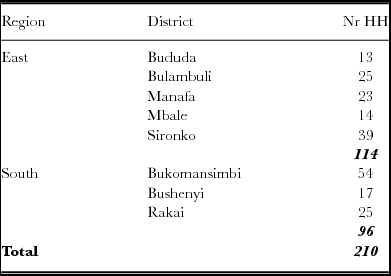
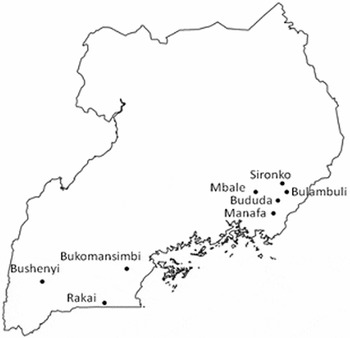
The heads, or other available household-members, of 210 farm households were interviewed using semi-structured questionnaires in August 2011 and February 2012 in eight districts in Eastern and Southern Uganda (Table 1 and Figure 1). We collected information to understand (a) general characteristics of the farm systems, (b) coffee production and revenue, and (c) current use of recommended practices. For general characteristics of the farm system we gathered information on farm size (total amount of land used for agriculture), number of plots, family size, family labour availability, livestock ownership, proportional sources of income and number of coffee trees. Farm size gives an indication of the resource land available. Family labour availability reflects the resource labour available. As hired labour is used only occasionally, this was excluded. Livestock ownership in terms of tropical livestock unit (TLU) indicates the wealth of the household and the manure available. Proportional sources of income show the main sources of income and therewith the orientation of the farm system. The number of coffee trees is important for evaluating the current status of the household involvement in coffee production. We also gathered information for calculation of the total household revenue (excluding costs) from different farm- and off-farm activities at farm level. This variable was used to reflect the resource cash available. To understand current coffee production and revenue we obtained information on the area of the farm under coffee production, the yield of coffee in kilogram green bean per farm, per ha and per tree, and the revenues obtained from coffee per farm, per ha and per coffee tree. To understand current use of recommended practices we gathered information on whether or not the household is active (yes/no) in different coffee management practices. Soil samples were taken from one coffee plot per household (one in each corner and one in the middle), and analysed for soil organic matter (SOM) content.
Sample size per research area and district.

The research-districts in Eastern and Southern Uganda.

Households interviewed were randomly selected for a study conducted in 2005–2006 (for details see Van Asten et al., Reference Van Asten, Wairegi, Mukasa and Uringi2011). For this study, individual coffee plots were selected along different village footpaths based on proximity to established demo-plots, after which the associated farming household were identified. Demo-plots were established through collective selection of one farmer-group-member based on (i) acceptance of the group-member to host a demo-plot, (ii) active involvement of the group-member in farming activities, (iii) willingness of the group-member to contribute labour to the demo-plot, (iv) the gender of the group-member, and (v) the accessibility and visibility of the demo-plot. Data collection in the former study focused mainly on coffee and banana agronomic practices. To collect more detailed data on household characteristics and other crops, all households were re-visited in 2011–2012.
Data analysis
Farm systems typology: To analyse diversity among farm systems with coffee we constructed a farm typology (Andersen et al., Reference Andersen, Elbersen, Godeschalk and Verhoog2007; Köbrich et al., Reference Köbrich, Rehman and Khan2003; Tittonell et al., Reference Tittonell, Muriuki, Shepherd, Mugendi, Kaizzi, Okeyo, Verchot, Coe and Vanlauwe2010), and it enables categorization of different farm systems with similar characteristics into specific farm types.
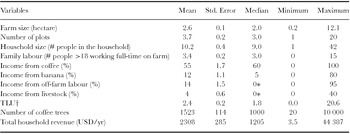
To identify farm types we first conducted a factor analysis (FA) using the continuous variables assessed across the 210 farms (Table 2). Factor Analysis reduced the number of variables into a small number of components, where each component represents a cluster of variables, while retaining the variance of the original variables. The Kaise–Meyer–Olkin (KMO) and the Bartlett's test of sphericity were used to determine the suitability of the set of variables used in the FA. Variables with a significant factor loading (> 0.700) were selected as input for cluster analysis. We used agglomerative hierarchical clustering (AHC) with Ward linkages (Bidogeza et al., Reference Bidogeza, Berentsen, De Graaff and Oude Lansink2009; Blazy et al., Reference Blazy, Ozier-Lafontaine, Doré, Thomas and Wery2009; Dossa et al., Reference Dossa, Abdulkadir, Amadou, Sangare and Schlecht2011). Ward linkages in the AHC uses the means for the variables and the squared Euclidean distance to the cluster means for each case, therewith minimizing the variance within clusters and increasing the chance of obtaining clusters of relatively equal sizes (Köbrich et al., Reference Köbrich, Rehman and Khan2003). Twelve out of 210 farm households were excluded from the clustering due to missing data. The resulting dendrogram was used to determine the final number of clusters. We based the number of clusters on visual observation of possible ‘cutting points’ giving information about the diversity and sizes of each cluster. For all analyses IBM SPSS Statistics version 22 was used.
Descriptive statistics of the continuous variables used in the factor analysis based on 210 interviews with farming households in two main coffee producing areas of Uganda.

†Tropical livestock unit: sum of the animals with loading cow = 0.7/goat = 0.1/chicken = 0.01/pigs = 0.2/sheep = 0.1.
*More than 50% of the farmers have value 0, but
− 42.7% of the farmers obtain between 5 and 95% of total income from off-farm activities.
− 23.1% of the farmers obtain between 2 and 40% of total income from livestock.
Assessment of diversity: After clustering the individual farm households in farm types, we used ANOVA to test for the significance of the differences between the means of the clusters concerning: (a) household characteristics and resource availability, (b) coffee production and revenue, and (c) current use of recommended practices. Where Levene test of ANOVA showed significant differences in variances within groups, Welch correction was applied. We also conducted the Kruskal–Wallis test for dichotomous independent variables. These statistical tests indicated that there were significant differences between clusters, but they did not specify between which clusters. For the latter purpose we applied the Post-Hoc LSD-test.
To test for differences in general characteristics of the farm systems including resource availability we used all variables (11) used in the factor analysis. The availability of the resource ‘land’ is represented by the variable farm size, ‘labour’ is represented by the variable family labour, and ‘cash’ is represented by the variable total household revenue per year (which is the sum of monetary revenues of coffee production, banana production, production of annual crops, sales of livestock resources, off-farm activities and other sources).
To test for differences in coffee production and revenue we used seven variables: area under coffee production, total coffee production, total coffee revenue, coffee yield per ha, coffee revenue per ha, yield per coffee tree, and revenue per coffee tree. Coffee production is expressed in kilograms green bean and revenue is expressed in US Dollars.
To test for differences in current use of recommended practices we used 13 variables. The percentage of farmers conducting pruning, de-suckering, soil erosion control, weeding with a slasher or herbicides and pesticide application indicate current use of the recommendations to enhance coffee management practices. The percentage of farmers conducting organic manure application, mulch application, application of mineral fertilizers, and measurements of SOM indicate current involvement in soil nutrient management and soil fertility status. The percentage of farmers owning at least one mono-cropped coffee field, the percentage of total coffee area being intercropped, and coffee-tree density index defined as the relative coffee tree density in the area allocated to coffee production, compared to the recommended spacing (in Eastern region 1700 trees ha–1, in Southern region 1100 trees ha–1), indicate current use of intercropping practices. Finally the percentage of farmers processing coffee indicates current involvement in practices of coffee value addition.
Evaluation of the adoption potential of recommended practices: The assessment of the adoption potential of the recommendations was based on a comparative assessment of (i) what resources farmers have, (ii) what agronomic management practices farms currently apply, and (iii) the requirements of the recommended practices. An overview of the adoption potential of recommended practices was generated based on a qualification of high (+) and low (−) potential.
RESULTS
Classification of farm systems with coffee production
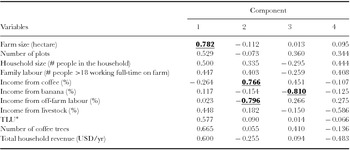
The factor analysis based on 11 variables resulted in 4 principal components, together explaining 64% of the variance among the farming households. The KMO value was greater than 0.5 and Bartlett's test showed a significance of 0.000, implying that the chosen set of variables was suitable for FA (Nainggolan et al., Reference Nainggolan, Termansen, Reed, Cebollero and Hubacek2013). Four out of these eleven variables had a factor loading > 0.700 in the extracted components: the size of the farm, percentage of income from coffee, percentage of income from banana and percentage of income from off-farm labour (Table 3), and were therefore selected to be used in the agglomerative hierarchical cluster analysis.
Component matrix with factor loadings for each variable to the components obtained through factor analysis. Variables with a factor loading > 0.700 (underlined) were selected for use in agglomerative hierarchical clustering.

*Tropical livestock unit: sum of the animals with loading cow = 0.7/goat = 0.1/chicken = 0.01/pigs = 0.2/sheep = 0.1.
Based on the dendrogram we divided our data set into five clusters with a minimum of 20 and a maximum of 72 farm households per cluster. We also took into account that the number of clusters must be realistic with respect to the empirical situation, and not only be imposed on the data by the methods used, to be accepted as a meaningful classification (Bidogeza et al., Reference Bidogeza, Berentsen, De Graaff and Oude Lansink2009; Köbrich et al., Reference Köbrich, Rehman and Khan2003).
Farm typology and diversity between farm types
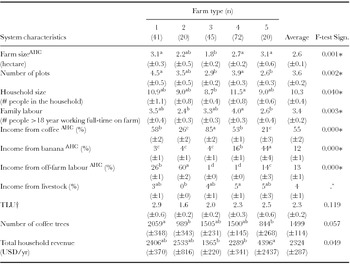
Diversity in household characteristics and resource availability: Five farm types with coffee production were identified. Table 4 presents the household characteristics and resource availability of each of these identified farm types.
Descriptive statistics (mean ± standard error) for system characteristics including availability of the resources land (farm size), labour (family labour) and cash (total household revenue), of farms in each of the five farm types.

†Tropical livestock unit: sum of the animals with loading cow = 0.7/goat = 0.1/chicken = 0.01/pigs = 0.2/sheep = 0.1.
*Significant difference with p < 0.05. Different letters indicate statistically significant differences between farm types to Post-Hoc LSD test.
AHCThis variable was used in the agglomerative hierarchical clustering.
^Test of equality of means could not be performed because at least one group has 0 variance.
Farm type 1, the ‘large coffee farm’ had an average farm size of 3.1 ha distributed over 4.5 plots. The household had almost 11 members of which 3.5 worked full-time on the farm. The large coffee farm obtained 58% of total household income from coffee, 26% from off-farm activities, and less than 10% from banana and livestock. This farm type had the highest number of TLU. With on average 2059 coffee trees it had most coffee trees of all farm types. Total farm revenue was about 2400 USD per year.
Farm type 2, the ‘farm with off-farm activities’, had an average farm size of 2.2 ha distributed over 3.5 plots. This household had nine household members of which less than three worked full-time on the farm. The farm with off-farm activities obtained 26% of total household income from coffee production, 60% from off-farm activities, and less than 5% from banana production and livestock. This farm type had lowest number of TLU. The total number of coffee trees was less than 1000. Total farm systems revenue was about 2500 USD per year.
Farm type 3, the ‘coffee-dependent farm’, had an average farm size of 1.8 ha distributed over less than three plots. This household had less than 9 household members of which more than three worked full-time on the farm. The coffee-dependent farm obtained 85% of total household income from coffee production, and about 10% from off-farm activities, banana production and livestock. This farm type had an average number of TLU. The total number of coffee trees was 1500. Total farm systems revenue was low with less than 1400 USD per year.
Farm type 4, the ‘diversified farm’, had an average farm size of 2.7 ha distributed over less than 4 plots. This household had more than 11 household members of which four worked full-time on the farm. The diversified farm obtained 53% of total household income from coffee production, 16% from banana production, and less than 10% from off-farm activities and livestock. This farm type had an average number of TLU. The total number of coffee trees was 1500. Total farm systems revenue was about 2300 USD per year.
Farm type 5, the ‘banana–coffee farm’, had an average of 3.1 ha distributed over 2.6 plots. This household had nine household members of which less than three worked full-time on the farm. The banana–coffee farm obtained 21% of total household income from coffee production, 44% from banana production, 14% from off-farm activities, and 5% from livestock. This farm type had an average number of TLU. The total number of coffee trees was less than 1000. Total farm systems revenue was high with more than 4000 USD per year.
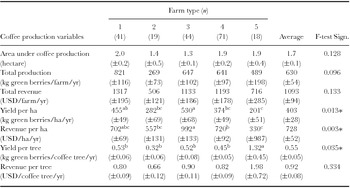
Diversity in coffee production and revenue: The five farm types differed, although not significant, in area allocated to coffee production, farm level coffee production and revenue, and revenue from coffee production per coffee tree (Table 5). Values for coffee yield and revenue per ha, and for coffee yield per coffee tree, did however show significant differences among the farm types. Values for yield (p = 0.108) and revenue (p = 0.100) per ha did not show significant differences between Robusta and Arabica coffee.
Descriptive statistics (mean ± standard error) of coffee production variables including area under coffee production, coffee production and revenue per year, and coffee yields and revenue per hectare and per coffee tree, of farms in each of the five farm types.

*Significant difference with p < 0.05. Different letters indicate statistically significant differences between farm types to Post-Hoc LSD test.
Farm type 1, the large coffee farm, had relatively much area under coffee production (2.0 ha), a high total coffee production of 821 kilogram green bean per year, and a high total coffee revenue of 1317 US Dollar per year. Yield and revenue per ha were close to the overall average. Farm type 2, the farm with off-farm activities, had a low total coffee production of 269 kg per year, a low total coffee revenue of 506 USD per year, and relatively little area under coffee production (1.4 ha). Yield per ha and revenue per ha were lower than the overall average. Farm type 3, the coffee-dependent farm, had the highest coffee yield per ha of 530 kg ha–1 and the highest coffee revenue per ha of 992 USD ha–1. Farm type 4, the diversified farm, had an average production, an average revenue, average yield per ha, and average revenue per ha. Farm type 5, the banana–coffee farm, had an average total coffee production and average total coffee revenue. Coffee yield per ha was low with 201 kg ha–1 and coffee revenue per ha was also low with 330 USD ha–1.
The coffee yield per tree showed a significant difference in which Farm type 5, the banana–coffee farm, had a much higher value of 1.32 kg green beans per coffee tree per year, than all other farm types. Revenue per tree showed no significant differences, but the trend was the same as for the coffee yield per tree.
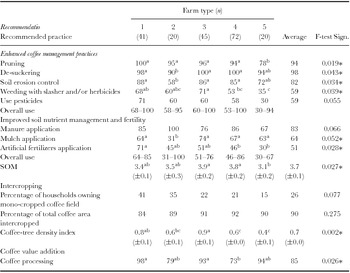
Diversity in current use of recommended practices: Analyses of current use of recommendations showed that significant differences exist between the farm types (Table 6). Actual use of the recommended enhanced coffee management practices showed a significant difference between some of the farm types, except for the use of pesticides. On average, more than 90% of all farmers applied pruning and de-suckering of the coffee, around 80% was involved in soil erosion control, and approximately 60% of all farmers weeded with a slasher and/or herbicides and used pesticides. Farm type 5, the banana–coffee farm, had a relatively low percentage of farmers involved in the recommended activities, with least involvement in pruning, weeding with slasher and/or herbicides and the application of pesticides compared to all other farm types. The farm type with off-farm activities (type 2) was least involved in de-suckering the coffee trees and in soil erosion control.
Descriptive statistics (percentages/mean ± standard error) of current use of recommendations including percentages of households using different recommended practices, soil organic matter (SOM) content, percentages of total coffee area intercropped, and coffee tree density index, of farms in each of the five farm types.

*Significant difference with p < 0.05. Different letters indicate statistically significant differences between farm types to Post-Hoc LSD test.
The use of recommended improved soil nutrient management and fertility practices, significantly differed in the application of mulch (60%) and mineral fertilizers (50%). Only one third of the farmers in Farm type 2, however, applied mulch, and only one third of the farmers in Farm type 5 applied mineral fertilizers. In contrast, 71% of the farmers in Farm type 1, the large coffee farm, applied mineral fertilizers on the farm. No significant differences were observed for application of manure, which was done by 80% of the farmers. The percentage of SOM was significantly higher in Farm types 3 (3.9) and 4 (3.8), and lower for Farm type 5 (3.1).
Use of recommended intercropping practices did not show significant differences between the farm types concerning percentage of households owning mono-cropped coffee fields and percentage of total coffee area intercropped, but coffee-tree density index did show significant differences. The large coffee farm, type 1, showed however a slightly higher percentage of households with at least one field with mono-cropped coffee trees (41%), and a lower percentage of total coffee area intercropped (84%). Farm type 5 had a low percentage of households with a mono-cropped coffee field (15%). Coffee-tree density index was significantly highest for Farm type 3 (0.9), and lowest for Farm types 4 (0.6) and 5 (0.4).
Analysis of use of recommended coffee value addition practices showed that Farm types 4 and 2 (although the latter not significant) were less involved in coffee processing activities than the other farm types.
Analysis of the adoption potential of the recommended practices
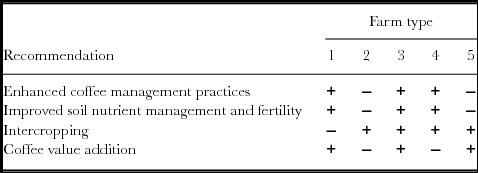
We related the adoption potential of recommended practices to increase coffee yield and revenue, to (1) the resources available, (2) the actual farm outputs in terms of coffee yield and revenue, and (3) the current use of recommended practices. Table 7 indicates which recommendations have a high adoption potential (+) and which have a low adoption potential (−) for each farm type.
Adoption potential of the different recommendations for each farm type. High adoption potential (+) and low adoption potential (−).

Farm type 1 has significantly more land available than other farm types, while availability of labour and cash are average. Coffee yield and revenue are average and the current use of the recommendations to enhance coffee management practices, to improve soil nutrient management and fertility, and to add coffee value are significantly higher than for other farm types. The current high use of recommended practices indicates that they seem to fit well with this farm type, and adoption potential seems high. The current use of intercropping, however, seems to be low. This farm type has the highest percentage of households owning a mono-cropped coffee field, the lowest percentage of total area intercropped, and current coffee tree index is also relatively high. Also, as labour and cash availability are average, and coffee yield and revenue are average, the adoption potential of intercropping might be low for this farm type.
Farm type 2, the farm with off-farm activities, has significantly least household members working on the farm and land and cash availability are average compared to other farm types. Coffee yield is average with significantly less revenue than Farm type 1, and farmers use few recommended practices. This farm type mostly relies on off-farm activities for their income (60%), and investments in coffee production seem to be limited. The adoption potential of the recommendations to enhance coffee management practices, improve soil nutrient management and fertility, and add coffee value are therefore low. The potential to adopt intercropping practices however might be high. Current coffee tree index is low, and almost 90% of the total coffee area seems to be intercropped. This indicates that intercropping is currently done, which increases adoption potential for other farm systems in this farm type.
Farm type 3 has significantly least land and cash available of all farm types, and the number of household members working full-time on the farm seems to be relatively average. Current coffee production and revenue are high, and current use of recommended practices is significantly higher than for all other farm types (only the use of mineral fertilizers is average). The current high use of recommended practices indicates that they seem to fit well with this farm type. Therefore, the adoption potential of the recommended practices is high for this farm type.
Farm type 4 has significantly most labour available, much land, average amount of cash, and average coffee yield but low coffee revenue. The current use of the recommended enhanced coffee management practices and improve soil nutrient management and fertility practices is high, except for the use of herbicides, pesticides and mineral fertilizers. Labour is invested in the recommended practices, but limited cash availability might be constraining the adoption of the practices concerning external inputs. The adoption potential of the recommended practices seems however to be high. Also, the recommendation to intercrop has a high adoption potential as the current coffee-tree index density is low leaving space for intercropping practices, and currently more than 90% of the total coffee area is intercropped. The current use of coffee value addition is low compared to other farm types, with a related low value for coffee revenue. The adoption potential to add value to coffee therefore seems to be low.
Farm type 5, the banana–coffee farm, has limited labour resources, but much land and significantly more cash (higher total farm revenue) available. Current coffee yield and revenue are much lower than for other farm types. Even though the availability of cash can be used to increase labour availability through hiring labour, the current use of recommended practices is also low. With the main source of income coming from banana production (44%), investments in coffee production seem to be limited. The adoption potential of the recommendations to enhance coffee management practices and improve soil nutrient management and fertility seems to be low. The recommended practices to intercrop, however, seem to have a high adoption potential as current coffee-tree index is low, 90% of the total coffee area seems to be intercropped and this farm type has least of the households owning at least on mono-cropped coffee field (15%). Also, the current use of coffee value addition is high. Adding value to the coffee increases coffee revenue without much labour or cash investments, and as income from banana might enable postponing the income from coffee after harvest, this recommendation seems to have a high adoption potential.
DISCUSSION
Farm typologies
World-wide many farm system typologies have been developed. These typologies often focus on differences at field level in terms of main crop produced (Andersen et al., Reference Andersen, Elbersen, Godeschalk and Verhoog2007; Carmona et al., Reference Carmona, Nahuelhual, Echeverría and Báez2010; Dossa et al., Reference Dossa, Abdulkadir, Amadou, Sangare and Schlecht2011; Zorom et al., Reference Zorom, Barbier, Mertz and Servat2013), or specific production system (Fleskens, Reference Fleskens2008; Hernández-Martínez et al., Reference Hernández-Martínez, Manson and Hernández2009). Other typologies which take into account diversity at household level, often focus on differences in resource endowment levels (Iraizoz et al., Reference Iraizoz, Gorton and Davidova2007; Righi et al., Reference Righi, Dogliotti, Stefanini and Pacini2011; Somda et al., Reference Somda, Kamuanga and Tollens2005; Tittonell et al., Reference Tittonell, Muriuki, Shepherd, Mugendi, Kaizzi, Okeyo, Verchot, Coe and Vanlauwe2010). A limited number of farm systems typologies classify farm systems with the same perennial cash-crop production taking into account diversity at household level (Blazy et al., Reference Blazy, Ozier-Lafontaine, Doré, Thomas and Wery2009). Our study with a classification of farms with coffee production, contributes to the last category. Moguel and Toledo (Reference Moguel and Toledo1999) and Hernández-Martínez et al. (Reference Hernández-Martínez, Manson and Hernández2009) classified coffee production systems in Mexico at a systematic and production level, but without analysis of the diversity in household characteristics and resource availability and limited analysis of management practices. Their classification differentiates farm types according to differences at production level, at plot level, and the classified coffee systems are related to conservation effort. Our study classifies different farm types according to differences at system level, including household and resource characteristics, and explores the differences in adoption potential for recommended practices for enhanced production and improved local livelihoods.
Our study shows that the main influencing variables to classify farm types are the size of the farm, and the percentages of total yearly income coming from coffee, banana and from off-farm activities. Personal field observations in different areas of Uganda, and results of focus group discussions with farmers concur that farmers prefer to distinguish themselves according to their main farming activities, being coffee farmers, banana farmers or mixed farmers with both perennial crops and multiple annual crops. The variables we identified and used for the classification therefore seem to distinguish farm types (clusters) with a good representation of reality.
The farm typology focused mainly on structural farm characteristics and does not include farmers’ willingness and attitudes towards adoption of proposed agricultural practices. This means that even though we show that the circumstances might be suitable for adoption of recommended practices, the acceptability can be low and constrain actual adoption (Franzel et al., Reference Franzel, Coe, Cooper, Place and Scherr2001). Including farmers’ opinion about adoption potential for the recommended practices should therefore be part of further analysis to understand actual adoption practices beyond just the adoption potential. We would furthermore suggest that future studies would include participatory field measurements of yields, labour inputs and costs and revenues within the farm system, and repeat these measurements over multiple years. This would contribute in enhancing the accurateness of data, as the sole use of farmers’ information provided as in this survey does not guarantee accurate values and should hence be treated as estimations. The use of measurements would furthermore shed more light on the actual relation between resource availability and use, actual benefits of adopting the recommended practices for enhancing the small-scale farming livelihoods, and variability over time.
Farm type diversity
The average size of the different farm types ranges between 1.8 and 3.1 ha, with an average of 2.6 ha over the total sample. This is relatively high for smallholder farm systems in Uganda (UBOS, 2010 B), but other studies specifically focussed on Uganda smallholder farm systems find comparable farm sizes ranging between 0.5 and 8 ha in Eastern Uganda (Tittonell et al., Reference Tittonell, Muriuki, Shepherd, Mugendi, Kaizzi, Okeyo, Verchot, Coe and Vanlauwe2010), and 0.2 and 4 ha in south-western Uganda (Briggs and Twomlow, Reference Briggs and Twomlow2002). Ellis and Bahiigwa (Reference Ellis and Bahiigwa2003) also found farm sizes in the Central and Eastern regions of Uganda ranging between <0.5 ha and >4 ha. They indicate however, that more than 60% of the farmers in the sample size has less than 1 ha of land and 10% has more than 4 ha.
Average coffee yield per ha in our sampled farms is 403 kg ha–1 year–1, ranging between 201 and 530 kg ha–1 year–1 in different farm types. These values are lower than other Ugandan coffee production values (Van Asten et al., Reference Van Asten, Wairegi, Mukasa and Uringi2011), and also the FAO (2013) estimates that Ugandan coffee yields are slightly higher with an average of 600 kg ha–1 year–1. Our values are probably slightly different because they are based on recall data rather than calculations like the FAO values (FAO, 2013). However, most important is to focus on the significant differences between the farm types taking into account that all values for coffee yield are obtained in the same way and that all values are structurally below other values. Related to the lower production levels, we also observe lower values for revenue obtained through coffee production, ranging between 330 and 992 USD ha–1 year–1, compared with Van Asten et al. (Reference Van Asten, Wairegi, Mukasa and Uringi2011) who reported the value of coffee to be above 1000 USD ha–1 year–1 for Robusta coffee and above 2000 USD ha–1 year–1 for Arabica coffee.
Significant differences observed between farm types concerning the coffee yield per individual coffee tree are a result of extremely high values of yield per tree observed in farm type 5. This farm type is little involved in recommended practices and has most income coming from banana production. Coffee yields per ha per year are however lowest for farm type 5 compared to all other farm types. Cluster 5 has the lowest coffee-tree density index, indicating that this farm type has the lowest density of coffee trees and coffee trees are widely spaced. This can give (1) large coffee trees with high production (hence high value for yield per coffee tree), and (2) a low value for yield and revenue per ha as there are very few coffee trees per ha. It is also possible that the high value for yield per coffee tree is the result of an overestimation of small numbers of coffee bags (yield), and an underestimation of a large number of coffee trees. The latter combination of reasons for the high values of yield per tree might be most accurate, as it is noticed also in other studies that farmers generally tend to overestimate small quantities and underestimate large quantities leading to errors in data available for analysis (Van Asten et al., Reference Van Asten, Kaaria, Fermont and Delve2008).
Current use of recommended enhanced coffee management practices, and improved soil nutrient management and fertility practices, seems to be high for all farming households. Overall average values range between 51% and 98% of the farmers being involved in the recommended activities. Between farm types, however, there seem to be large differences in involvement, especially concerning the use of external inputs such as herbicides, pesticides, mulch and mineral fertilizers. Over the entire sample more than 50% of the farmers indicate to apply these external inputs, ranging between approximately 30% and almost 70% for the different farm types. For the application of mineral fertilizers specifically this still seems to be a high use compared to a study by Pender et al. (Reference Pender, Jagger, Nkonya and Sserunkuuma2001) who estimate that less than 10% of the Ugandan farmers use mineral fertilizers. Also, comparing our results to Kenya, where only 37% of farmers in a poor district reported ever having used fertilizers (Duflo et al., Reference Duflo, Kremer and Robinson2008), our values are high. Moreover, while we expected farmers with more cash available to use more mineral fertilizers to boost production (Pender et al., Reference Pender, Jagger, Nkonya and Sserunkuuma2001), the farm type with most cash available (Farm type 5) is least involved in the application of mineral fertilizers (30%).
Farm types 1 and 3 are both most involved in the recommended coffee management practices, with the only significant difference being that 71% of farmers in Farm type 1 use mineral fertilizers and only 51% of farmers in Farm type 3 use mineral fertilizers. Also, the highest values for SOM correspond with the highest use of mulch in Farm type 3. Striking is that the coffee yield and revenue per ha for this farm type are significantly higher, with significantly least resources available. This might indicate that this farm type, being coffee-dependent, works most efficiently with its limited resources. On a related note, least involvement in the recommended coffee management practices (Farm type 5) seems to be related to least coffee yield and revenue per ha. Further research however is needed on the intensity of the practices, analysing which frequencies and quantities of the application of mineral fertilizers, other inputs (mulch, manure, herbicides and pesticides) and specific coffee management practices influence farm coffee yield per ha in order to relate the quality of recommended practices with coffee yield and revenue.
Current use of the recommendations to intercrop and to add value to coffee show little differences between the farm types. In both cases it is important to take into account that the intensity of the activity is highly influential. Intercropping practices can highly vary, and in this case both intercropping with a few fruit-trees, as with multiple annual crops is considered as one variable. Many Ugandan farmers practice at least some degree of intercropping in their field, and differences between the farm types are hard to assess at farm level. Practices of coffee value addition equally vary. Coffee can be sold in different forms going beyond fresh red berries, but farmers who sell just dried berries and farmers who sell dried and de-husked coffee beans are all taken as ‘yes’ adding value to coffee. Indeed, being less involved in coffee value addition corresponds with low revenue obtained from coffee production per ha in farm types 2 and 4, while the yields per ha are average.
Adoption potential
The adoption potentials of the different recommendations differ between farm types. The recommendations to enhance coffee management practices and to improve soil nutrient management and fertility seem to have a high adoption potential for Farm types 1, 3 and 4, and a low adoption potential for Farm types 2 and 5. There is no clear link between the adoption potential of these recommendations and the availability of resources in the different farm types. The main difference between the farm types for which the adoption potential of the recommendations are high versus the farm types for which the adoption potential of the recommendations are low, is that Farm types 1, 3 and 4 rely most on coffee for their income, while farm type 2 relies more on off-farm income and Farm type 5 relies more on banana production. This difference does not have to do with production orientation in terms of subsistence or market orientation of the farm systems, but differentiates which crop or activity provides most income to the household. This ‘income orientation’ seems to be most related to current use of the recommendations to enhance coffee management practices and improve soil nutrient management and fertility. This relation indicates that income orientation has a very large influence on adoption potential, and might even be more influential than resource availability. Unfortunately, income orientation is not taken into account in many adoption studies (Knowler and Bradshaw, Reference Knowler and Bradshaw2007).
The recommendation to intercrop seems to have a high adoption potential with most farm types, excluding Farm type 1. Current coffee tree density at this farm type is almost at the recommended coffee spacing density, and it seems that there might be limited space available for intercropping practices at this farm type with the highest percentage (41) of household owning at least one mono-cropped coffee field, and the lowest percentage of total coffee area intercropped. The actual area intercropped is however still more than 80%. Farm type 3, which also has a coffee density spacing reaching almost the recommended spacing, seems to be currently more involved in intercropping, with more than 90% of the total coffee area intercropped and less than 25% of the households owning at least one mono-cropped coffee field. An important difference between these farm types is that Farm type 1 has significantly more land available than Farm type 3. Therefore, intercropping might have a higher potential for adoption in farm type 3 than in Farm type 1. The actual outcome of intercropping practices however depend much on the agro-ecological environment, and is influenced by the specific crop and trees intercropped with coffee and at which density. Intercropping coffee with banana for example seems to increase overall revenue per ha without threatening either coffee or banana production (Van Asten et al., Reference Van Asten, Wairegi, Mukasa and Uringi2011), and might therefore be a better practice than growing coffee in dense agroforestry systems with less than 25% coffee yield compared to coffee yields from mono-cropped systems (Campanha et al., Reference Campanha, Santos, Freitas, Martinez, Garcia and Finger2004). It is important to take into account moreover that the density of coffee trees and possibility for intercropping practices is highly variable over time.
The recommendation to add value to coffee at farm level seems to have a high adoption potential for Farm types 1, 3 and 5, and a low adoption potential for types 2 and 4. This difference seems not to be related to the availability of the resources land and labour, nor to the availability or cash to be able to postpone cash-income after coffee harvest. We do see that the coffee yield per tree per year in Farm types 2 and 4 seem to be the lowest among all farm types, but no significant difference is observed anywhere between these farm types and the other farm types enabling the identification of the drivers behind the lower use of the recommendation. Also, we have not taken into account the actual prices that the farm types obtained for the coffee sold in different formats. To obtain different prices for different forms of coffee (no value added, dried, dried and de-husked) markets should be in place to sell the products and farming households should be able to bargain for better prices. Bussolo et al. (Reference Bussolo, Godart, Lay and Thiele2007) indicate that higher coffee prices are associated with substantial reductions in poverty which can be retained when coffee prices reduce again. This indicates that it might be beneficial for farming households to be involved in coffee value addition and obtaining higher prices for their coffee temporarily in order to lift their household out of poverty. Further research is therefore needed concerning the different practice of coffee value addition and related prices in order to better understand the adoption potential of this recommendation and the likely influence on household revenue and poverty reduction.
Our assessment of the adoption potential of current recommendations lacks the identification of better or other recommendations more suitable to the different farm systems in order to increase coffee production and income in Uganda. That is beyond the scope of this paper. To identify more farm type specific recommendations, an additional analysis of the intensity and returns to investments is required, both of activities carried out for coffee production as well as of other income-generating activities. Harris and Orr (Reference Harris and Orr2014) argue that the actual impact of adopting new technology on poverty is limited, because farms are simply too small in land area and the net returns are too low. Our study for example shows that while more than 50% of the farmers indicate to use external inputs, the actual volume used is still very low. As we were not able to collect reliable data on the volume of inputs (i.e. quantity of labour and chemical inputs) the analysis was restricted to gross benefits.
Our analysis shows that the diversity in these farm systems influence the potential to adopt recommended practices. As the farm systems with coffee production in Uganda we analysed for our study, are similar to smallholder farm systems with coffee production in other East African countries like Kenya, Tanzania, Rwanda, Burundi and Ethiopia (Abebe et al., Reference Abebe, Wiersum and Bongers2010; Baijukya et al., Reference Baijukya, de Ridder, Masuki and Giller2005), the presented typology can be relevant for efforts aiming to increase coffee production regionally. The promotion of intercropping coffee with Tephrosia to enhance coffee productivity in the East African Highlands (Bucagu et al., Reference Bucagu, Vanlauwe and Giller2013), can benefit from insights of our presented typology. Also for efforts to promote integrated crop management to sustainably increase coffee production in Malawi (Hillocks, Reference Hillocks2000) it is important to acknowledge the diversity among farm systems. And even the promotion of agroforestry practices to mitigate the effect of climate change on coffee production and quality in Mexico (Lin, Reference Lin2007) should acknowledge and take into account the diversity among farm systems with coffee production for increased adoption of practices.
CONCLUSION
In this paper we have shown that an analysis of different farm systems with coffee production, a level beyond the ‘smallholder coffee farmer’ as a homogenous entity, is important to understand adoption potential of recommended practices. Development strategies, interventions and policies aiming to increase coffee production and reduce poverty in Uganda should be tailored to these farm types, encompassing individual farm systems, in order to achieve their goal.
Acknowledgements
The authors are grateful to the farmers who participated in this study, to the field enumerators who helped collecting the data, and to the reviewers for useful comments. The authors would furthermore like to acknowledge the staff of IITA and Hanns R. Neumann Stiftung Africa for their help, as well as BMZ, CCAFS and Humidtropics for their support to this study. In addition, the lead author has received support from the Netherlands Government as a beneficiary of the JPO program.