
I. INTRODUCTION
Currently, flexible electronic devices such as sensors, Reference Huang, Liu, Cheng, Shin, Fan, Liu, Lu, Kong, Chen, Patnaik, Lee, Hage-Ali, Huang and Rogers1 batteries, Reference Liu, Xu, Xu and Zhang2 displays, Reference Kim, Kwon, Lee, Shim, Chun, Choi, Kwack, Han, Song, Kim, Mohammadi, Kee and Lee3 and solar cells Reference Li, Lee, Kim, Kim, Park, Kim, Shin, Choi and Ko4 are attracting great interest as next-generation devices due to their high portability and light weight. These flexible devices are supposed to be operated under repeated mechanical deformation unlike conventional rigid electronics, which is very susceptible to mechanical impact. Repeated bending or stretching generally results in the gradual degradation of device properties. Specifically, severe and complex deformation such as twisting deformation is more dangerous to the reliability of the device. Therefore, an understanding of the effect of complex mechanical deformation on the electrical reliability of flexible devices is essential to guarantee their long-term reliability.
A metal layer, used as an interconnect or an electrode, is a basic component in flexible electronics and covers a large area in a flexible device. The conductivity of flexible metal under mechanical deformation is directly related to the electrical performance and reliability of an entire device. Therefore, many studies have been conducted to investigate the effect of mechanical deformation on the deformability of a metal layer. The mechanism of damage formation Reference Zhu, Zhang, Gao and Zhang5,Reference Lee, Kim, Kim and Joo6 and associated parameters such as the thickness of the metal film, Reference Kim, Shin, Lee, Yang, Haas, Gruber, Choi, Kraft and Joo7 the width of the metal line, Reference Lee, Shin, Nam, Yeon, Nam, Woo and Joo8 different kinds of metal, Reference Glushko, Klug, List-Kratochvil and Cordill9 and the thickness of over-layers Reference Akinwande, Petrone and Hone10 were investigated. Additionally, the methods for improving the stretchability or long-term reliability by modifying micro and nanostructures, such as nanowires, Reference Lee, Lee, Lee, Yeo, Hong, Nam, Lee, Lee and Ko11 nanoholes, Reference Kim, Cho, Jung, Shin, Moon, Han, Nam, Joo and Choi12 nanosheets, Reference Moon, Lim, Song, Shin, Yu, Lim and Jeong13 self-similar serpentine lines, Reference Zhang, Fu, Su, Xu, Cheng, Fan, Hwang, Rogers and Huang14 and wavy patterns, Reference Hsu, Gonzalez, Bossuyt, Axisa, Vanfleteren and De Wolf15,Reference Gonzalez, Axisa, Bulcke, Brosteaux, Vandevelde and Vanfleteren16 have been suggested. The majority of the studies on fatigue behavior of the metals on compliant substrates have been investigated under simple bending or uniaxial stretching methods. The strain applied to a specimen by bending is well defined and can be simply expressed by the following equation:
 $$\varepsilon = {{\left( {{t_{{\rm{sub}}}} + {t_{{\rm{film}}}}} \right)} / {2r}}\quad ,$$
where the ε, t sub, t film, and r are the bending strain, substrate thickness, film thickness, and the radius of curvature, respectively. These variables have only a uniaxial stress component, such as stretching, before fracture.
Majority of these previous studies on fatigue behavior of flexible devices were limited to uniaxial and uniform deformation on a whole sample and analysis of single stress components. In actual operations, the complicated deformation causing multiaxial and multicomponent stress such as twisting will definitely be applied. Twisting, which causes the biaxial and multi-component stresses in thin film systems, is one of the deformation mode which is close to the actual operating conditions of flexible electronics. Therefore, understanding the fundamentals of fatigue behavior under twisting is essential for approaching to the real operating conditions of flexible devices and should be preceded before combined and complex deformation. Several papers related to twisting have been published. Reference Zhou, Guo, Yu and Pan17–Reference Song, Jang, Ji, Park, Kim, Song, Yoon, Ko, Jung and Lee20 However, the twisting test in these studies were conducted in short-term cycles (<100 cycles), which are insufficient to clearly explain the twisting fatigue behavior. Most of the studies mainly focused on the demonstration of flexible devices. In addition, majority of the previous researches on twisting test only specified the condition of twisting angles. Similar to bending deformation, well studied by relating the bending strain to microstructural damages based on statistical analysis, twisting deformation must be investigated based on systematic quantification considering geometric parameters.
In this study, the electrical and mechanical reliability of Cu interconnects on a flexible substrate is investigated during cyclic twisting deformation. The change in electrical resistance of the metal lines was measured in situ during the twisting test to assess parameters quantitatively. The fatigue behavior was analyzed by the microstructure and damage analysis using various pattern positions and different twisting angles. By correlating the morphologies and degree of damages and fatigue lifetimes, the effect of pattern positions and the twisting angle is discussed. Subsequently, these statistical results were analyzed by both computational calculations and analytic equations. By using the strain from the analytic equation, failure cycles versus the strain were plotted using the Coffin–Manson or Basquin equations. Fatigue coefficients according to the various conditions were designated, allowing to predict the fatigue lifetime at various test conditions. This study can provide a fundamental understanding of the fatigue behavior of the metal film under more complex and multiaxial deformation, with which we can take a step forward toward the realization of flexible electronics.
II. EXPERIMENTAL
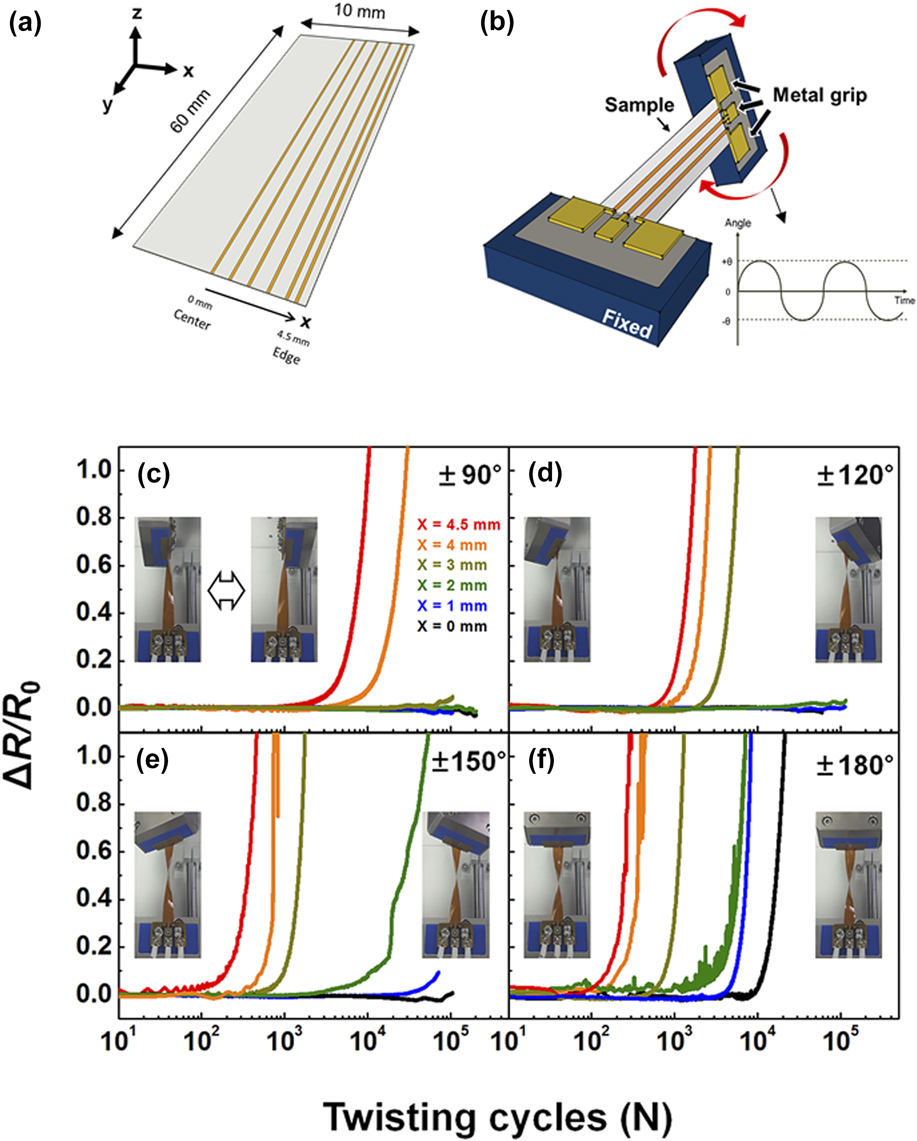
A 125-µm-thick polyimide (PI) (DuPont, Kapton, Wilmington, DE) substrate was used in a rectangular shape with a width of 10 mm and a length of 60 mm. Cu interconnects with a thickness of 1 µm were deposited on a the PI substrate using a thermal evaporator. The base pressure and deposition rate were 5 × 10⁻⁶ torr and 6 nm/min. The Cu interconnects were patterned using a width of 200 µm and a length of 60 mm, as shown in Fig. 1(a). The x-axis is defined as the direction of width in the sample, and the y- and z-axes are the length and thickness directions, respectively. The center of the sample along the x-axis is defined by the position x = 0, and the Cu interconnects were patterned with different distances from the center of the substrate (x = 0, 1, 2, 3, 4, and 4.5 mm).
Schematics of (a) Cu interconnects used on the PI substrate with different positions on the x-axis and (b) twisting tester. Change of the normalized resistance as a function of the twisting cycles with different x positions of x = 0, 1, 2, 3, 4, and 4.5 mm under (c) 90°, (d) 120°, (e) 150°, and (f) 180°. The tester rotates periodically from clockwise to counterclockwise alternatively.

Cyclic twisting was applied to the Cu interconnects using a twisting test machine (CKSI, Suwon, Korea), as shown in Fig. 1(b). The samples were gripped by two holders, with one holder being fixed and the other holder repeating a rotating motion, which induced the twisting motion in our samples. Experiments were carried out by alternating the direction of the twisting deformation clockwise and then counterclockwise, which are indicated by ± sign, as shown in Fig. 1(b). The twisting angle was varied by ±90°, ±120°, ±150°, and ±180° with a constant twisting rate of 30 cycles/min. The maximum number of twisting cycles was 105 cycles. To observe the change in electrical resistance during the twisting, both ends of the interconnects were gripped and placed in contact with the metal grips. Three metal grips were placed in one holder, which allowed the simultaneous measurement of the electrical resistance of the Cu interconnects at different positions on the same substrate. The electrical resistance was measured in situ using an Agilent 34410A (Agilent Technologies, Santa Clara, California) and Keithley 7007 (Keithley Instruments, Solon, Ohio).
After testing, the morphologies of the metal interconnect were observed by field-emission scanning electron microscopy (FESEM; MERLIN Compact, Carl ZEISS, Oberkochen, Germany) and optical microscopy (OLYMPUS BX51M, OLYMPUS, Tokyo, Japan). To analyze the stress evolution during twisting deformation, a finite-element simulation was performed using a commercial simulation program (ABAQUS, Dassault Systémes, Vélizy-Villacoublay, France). The PI model had a thickness of 125 µm, a width of 10 mm, and a length of 60 mm, which were the same dimensions as the actual sample. In the simulation, the elastic modulus used and Poisson’s ratio for PI were 2.34 GPa and 0.34, respectively. Reference Lu, Suo and Vlassak21,Reference Yu and Spaepen22
III. RESULTS AND DISCUSSION
A. Degradation of electrical properties and damage morphologies
Figure 1(c) shows the changes in the electrical resistance of the Cu interconnects as a function of twisting cycles at different twisting angles and line positions. For the ±90° twisting test, the electrical resistances of metal lines located near the center of the sample (x = 0, 1, 2, and 3 mm) did not increase until 105 cycles. In contrast, the resistances of the metal lines positioned at the edge (x = 4 and 4.5 mm) maintained their initial resistance in the early stages and increased after approximately 1000 cycles. As the twisting angle increased from ±90° to ±150°, the electrical resistance increased earlier. Furthermore, the resistance of even the metal lines positioned near the centerline increased, which did not show a resistance change under the small-angle twisting test. For instance, the resistance of a Cu line at x = 3 mm under the ±90° twisting test barely changed until 105 cycles, as shown in Fig. 1(c), but those at the same position increased significantly under the ±120°, ±150°, and ±180° twisting tests, as shown in Figs. 1(d)–1(f), respectively. For the ±180° twisting test, the resistances of all metal lines even including the line on the centerline (x = 0 position) increased as shown in Fig. 1(f).
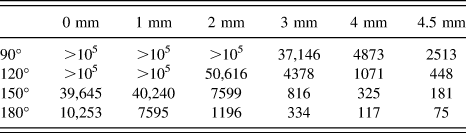
To systematically quantify the electrical reliability of a metal layer under twisting deformation, the failure cycle (N f) was defined as a 5% resistance increase. N f was obtained from at least 3 samples by a cumulative failure plot of data points, and the values of the lifetimes are listed in Table I. The fcc-structured Cu has no endurance limit, which means that the metal eventually failed even under the small strain range. Reference Suresh23,Reference Dieter24 To save the experiment time, maximum cycles of repeated twisting deformation were limited to 105 cycles. It was found that the fatigue lifetime depends on both the twisting angle and the line position. For the same line position, the decrease in N f was found to increase at a given twisting angle unless no failure was observed until 105 cycles. Likewise, N f decreased as a function of the line position at the same twisting angle. A significant decrease in N f was estimated, especially under ±180° condition. Comparing the x = 0 mm position with x = 4.5 mm at the 180° twisting motion, N f was about 140 times different as listed in Table I. The effect of each parameter is discussed quantitatively in Sec. III.B.
Fatigue lifetime according to the x position and twisting angle.

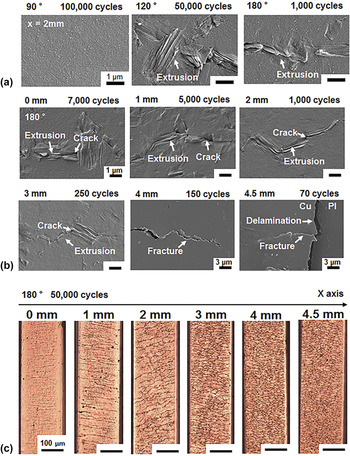
To elucidate the relationship between the electrical resistance and mechanical damage, the surface morphologies of Cu interconnects were investigated. Because N f could be determined from the in situ measurement, the surface morphology was observed by FESEM after a twisting fatigue test for a given number of cycles equal to N f. The effects of multicomponent stress depending on the twisting angle and position of the line pattern were investigated by comparing the damage morphologies and the resistance changes. Images of the damage morphologies in Fig. 2 were captured where the Cu interconnects reach a resistance increase of 5% which is defined as a failure criterion. Figure 2(a) is the comparison of the fatigue damage when the twisting angle was varied from ±90° to ±180° at a fixed line position. At the same position of the Cu line (x = 2 mm), no fatigue damage, even the nucleation of the extrusions or intrusions was observed under ±90° until 105 cycles. That is, for a ±90° twisting motion, the fatigue damage was negligible after 105 cycles. This result is consistent with the small increase of electrical resistance of the metal line at the x = 2 mm position after 105 cycles. However, under ±120° and ±180°, extrusions were easily generated and twisting cycles that are needed to form the extrusions decreased significantly. For the ±150° and ±180° twisting tests, the extrusions were observed after 50,000 cycles and 1000 cycles, respectively. These measurements are related to the electrical resistance changes in Figs. 1(d) and 1(e). From this correlation, it can be argued that the increase in the resistance during the cyclic twisting is induced by the nucleation and propagation of the fatigue damages and cracks.
FESEM and OM images of surface damage morphologies after the twisting test. Initial damage formation where the resistance change of Cu interconnects reached 5% (a) at x = 2 mm under 90°, 150°, and 180° and (b) at x = 0, 1, 2, 3, 4, and 4.5 mm under 180° by FESEM. (c) Surface damage in a whole view of electrically failed Cu interconnects after 50,000 cycles of twisting under 180° by OM.

It is reported that fatigue damage in metal films is generated as a form of extrusion or intrusion. Reference Suresh23–Reference Kim, Shin, Jung, Cho, Kraft, Choi and Joo25 At first, dislocations accumulate on the glide plane under repeated strain. Dislocations interact with each other, forming ordered network structures especially persistent slip band (PSB). PSB causes the local plastic strain, resulting in surface roughening. The surface roughening includes ‘extrusion’ and ‘intrusion’ which are the hill and valley, respectively. Extrusions and intrusions produce an effect of micronotch, where the stress is concentrated. In the stress concentration sites, the crack is easily nucleated and propagated. Eventually, crack evolution leads to electrical failure of the metal conductor due to electron scattering.
The surface morphologies of the metal interconnects during the ±180° twisting test at different positions are shown in Fig. 2(b). For the line samples located at x = 0, 1, 2, and 3 mm, extrusions were found on the surface and cracks seemed to be propagated along the extrusions were cross linked with each other. These are typical morphologies in the fatigue damage for metal films. Reference Kim, Shin, Lee, Yang, Haas, Gruber, Choi, Kraft and Joo7,Reference Lee, Shin, Nam, Yeon, Nam, Woo and Joo8,Reference Kim, Shin, Jung, Cho, Kraft, Choi and Joo25 In contrast, for the lines located at x = 4 and 4.5 mm, few extrusions and fracture-like cracks were observed on the surface. Instead, delamination of the metal layer, which generally occurs under a high-stress condition, Reference Li, Wang and Meng26,Reference Toth, Rammerstorfer, Cordill and Fischer27 was observed for the sample at the 4.5 mm position. From the damage morphologies, it can be asserted that the fatigue damages and electrical reliability were strongly affected not only by the twisting angle but also by the line position according to the multicomponent stress evolution.
Additionally, to clarify the relationship between crack density and electrical degradation, the optical images of the Cu interconnects were compared after 5 × 10⁴ constant fatigue cycles with ±180° twisting. It was observed that the crack density increased significantly as the positions of the interconnects were changed from x = 0–4.5 mm. When the line location was 4 mm and greater, cracks were linked together, resulting in a mesh-like crack over the whole surface area. Therefore, it is clear that the large increase in electrical resistance in the far-located pattern [Fig. 1(f)] contributes to the severe crack evolution [Fig. 2(c)].
B. Multicomponent stress analysis: FEM simulation and the analytic solution
When the sample was twisted as shown in Fig. 3(a), the multi-component stress including shear stress and tensile stress is applied to the metal layer. Here, we conducted an FEM simulation for multi-stress evolution and suggest an analytic solution considering multi-component stress that can be used to quantify the stress/strain in a twisting motion.
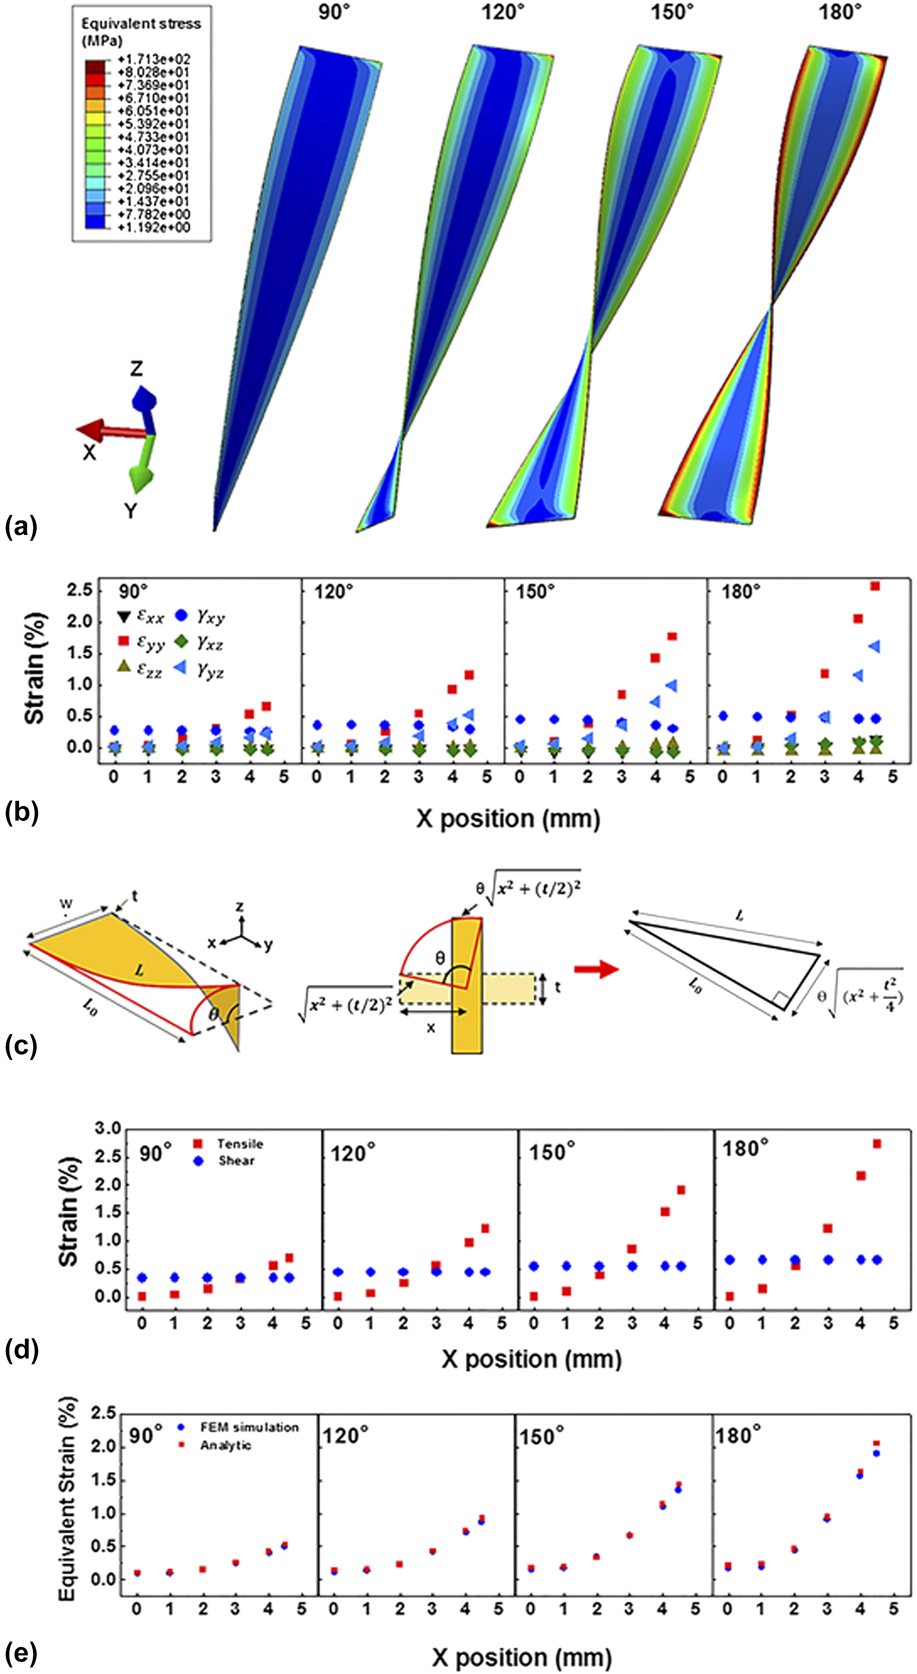
Analysis of the stress and strain distribution by the FEM simulation and analytic solution. (a) Distribution of the equivalent stress with different angles and (b) analysis of each of the strain component values of the position and the twisting angle by the FEM simulation. (c) The analytic model for the shear and tensile strain against the axial shortening and (d) calculated values of the strain components by the analytic solution. (e) Comparison of equivalent strain values by using the FEM simulation and analytic solution.
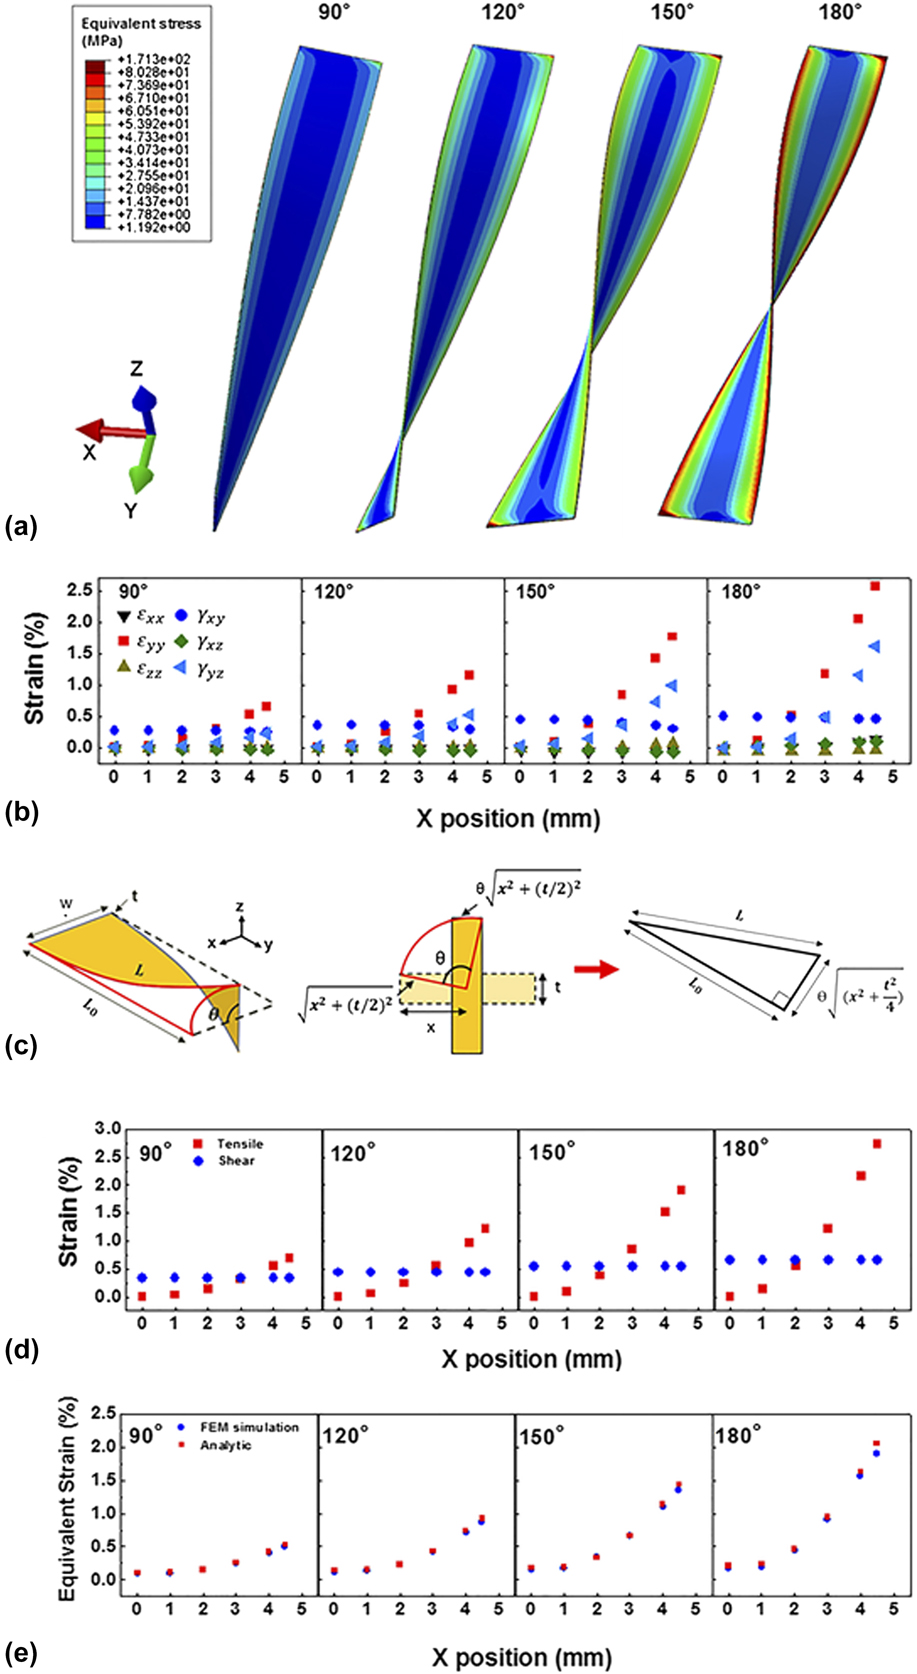
To determine the stress state during a twisting motion, an FEM simulation was conducted, and the stress and strain along the x position at various twisting angles were calculated [Figs. 3(a) and 3(b)]. A model of the sample was designed on the basis of the assumption that the Cu interconnects were so thin that their strains were governed by the strain of PI substrate. The Cu interconnects were not included in the model, and only the PI substrate was considered as homogeneous and continuous. The twisting axis was placed on the center of the rectangular cross section of the x–z plane. The distance between both sides was fixed at 60 mm. For a more accurate calculation, the FEM simulation model was a 3-D structure unlike the following analytic model of a 2-D structure, which means that ε z , γ xz , and γ yz were not zero.
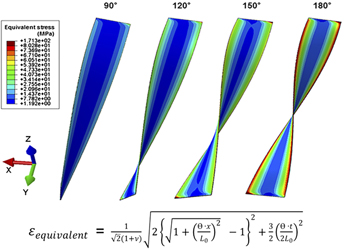
Figure 3(a) shows the results of the FEM simulation and the equivalent stress distributions on the surface of the PI. Higher stress was evolved in an edge area and under large-angle twisting conditions. From the simulation, each strain component was obtained and plotted in Fig. 3(b). Shear strains (γ xy ) were almost equal regardless of the position in all angle conditions, but as the twisting angle increased, shear strain (γ yz ) increased. The increase of the γ yz components was not significant at lower angles, but as the angle increased, this change in γ yz became noticeable. The increase in γ yz was caused by the nonlinear twisting deformation. Large twisting deformation leads to longitudinal stress (ε yy ), which induces additional stiffening torques. This effect is called the nonlinear Wagner stiffening effect. Reference Huang and Spaepen30 The tensile strain (ε yy ) also showed an increase under higher twisting angle conditions. This result implies that the twisting motion results in longitudinal elongation, and this effect can also be explained by the following analytic solution.
An analytic solution to represent the stress/strain during twisting was also developed. The analytic model was assumed to be a nearly 2-D plane structure because of the thin film system. Only the tensile strain in the y direction and the shear strain in the xy plane were considered, i.e., strains containing the z components were not taken into account. Figure 3(c) shows the analytic model, which has a rectangular shape with a length of L 0, a width of w, and a thickness of t. First, the shear strain was considered based on the analytic model. When the sample is twisted with an angle of θ, the twisting angle is expressed by the following equation Reference Shames and Pitarresi28 :
 $$\theta = {{{M_y}{L_0}} \over {{c_1}w{t^3}G}}\quad ,$$
where M y and G mean torque and shear modulus, respectively. The value of c 1 is about 0.33 when w/t is over 50. From Eq. (2) we then have
 $${M_y} = {{{c_1}w{t^3}\theta G} \over {{L_0}}}\quad .$$
The shear stress equation in the rectangular cross section is shown as follows:
 $${\tau _{{\rm{shear}}}} = {{{M_y}} \over {kw{t^2}}}\quad ,$$
k is 0.33 when w/t is over 50 like c 1. By applying Eq. (3) to (4), the shear stress can be simplified as
 $${\tau _{{\rm{shear}}}} = {{{c_1}x{t^3}\theta G} \over {kx{t^2}{L_0}}} = {{\theta tG} \over {{L_0}}}\quad .$$
Therefore, the shear strain is expressed as below:
 $${\gamma _{{\rm{shear}}}} = {{{\tau _{{\rm{shear}}}}} \over G} = {{\theta tG} \over {{L_0}G}} = {{\theta t} \over {{L_0}}}\quad .$$
It is reported that the shear strain under a twisting condition has similar values for all positions except for a very small region near the edge, where the shear strain is zero. Reference Shames and Pitarresi28,Reference Gupta and Siller29 By considering that the metal interconnects are located apart from the edges, the shear strain was assumed to be the same for all positions at the same twisting angle in this study. The shear strain at different twisting angles was plotted in Fig. 3(d). The shear strain did not change according to position, but it increased with increasing the twisting angle, as described in Eq. (6).
The stretching of the sample along the y-axis was also investigated using the model in Fig. 3(c). When the gap between the two grips is fixed by L 0, which occurred in the twisting tests in this study, the length of the edge line in the sample [indicated by red line in Fig. 3(c)] should be stretched to L by a twisting motion and an additional tensile stress should be induced on the sample. The tensile strain can be expressed by the following equation: When the model is twisted with an angle of θ, the initial length of the model is stretched to L after the deformation. On the rectangular cross section in the xz plane, an arbitrary point that has a distance x from the center moves on the arc, forming a sector. Using Pythagorean theorem, the radius of the sector r sector is expressed by the following equation:
 $${r_{{\rm{sector}}}} = \sqrt {\left( {{x^2} + {{{t^2}} \over 4}} \right)} \quad .$$
The length of the arc L arc is the product of the radius of the sector and the twisting angle as follows:
 $${L_{{\rm{arc}}}} = \theta \cdot {r_{{\rm{sector}}}} = \theta \cdot \sqrt {\left( {{x^2} + {{{t^2}} \over 4}} \right)} \quad .$$
It is assumed that the L arc, L 0, and L form a right triangle, and the L can be formulated by the Pythagorean theorem as follows:
 $$L = \sqrt {{L_0}^2 + {L_{{\rm{arc}}}}^2} = \sqrt {{L_0}^2 + {\theta ^2}\left( {{x^2} + {{{t^2}} \over 4}} \right)} \quad .$$
The tensile strain is expressed in terms of L 0 and L, which is represented by using Eqs. (8) and (9).
 $${\varepsilon _{{\rm{tensile}}}} = {{L - {L_0}} \over {{L_0}}} = {{\sqrt {{L_0}^2 + {\theta ^2}\left( {{x^2} + {{{t^2}} \over 4}} \right)} - {L_0}} \over {{L_0}}} = \sqrt {1 + {{{\theta ^2}\left( {{x^2} + {{{t^2}} \over 4}} \right)} \over {{L_0}^2}}} -1\quad .$$
In the thin film system, t is a negligible dimension compared to x, removing the t term in Eq. (10)
 $${\varepsilon _{{\rm{tensile}}}} = \sqrt {1 + {{\left( {{{\theta \cdot x} \over {{L_0}}}} \right)}^2}} - 1\left( ∵{t \ll x} \right)\quad .$$
Therefore, the equation can be expressed by using only θ, x, and L 0. The tensile strain by twisting increases with the increase of the twisting angle and distance from the rotation axis and the decrease of the initial length.
The sample thickness (t) was ignored because it is a negligible dimension compared to the sample position (x) in the thin film system. Consequently, the equation can be a function of only θ, x, and L 0. As shown in Fig. 3(d), the tensile strain by twisting increased with the increase in the twisting angle, the distance from the axis of rotation, and the decrease in the initial length. The tensile strain values (ε yy ) were almost identical to those of the FEM simulation. The tensile strain by the analytic model showed an error of less than 5% when compared to the FEM simulation results. It is noteworthy that the tensile stress during the twisting motion can be negligible under free end conditions. As opposed to the experimental conditions of this study, if the ends of the sample were free to move back and forth, the total length of sample can be shortened during the twisting motion, and no elongation and no significant tensile stress would evolve.
From the analytic model, a quantitative comparison between the shear strain and tensile strain can be conducted. As mentioned above, the shear strain is almost identical for all line positions at the same twisting angle. In contrast, the tensile strain proportionally increases as the distance of the line pattern from the central axis (x = 0 mm) increases. Because both tensile and shear strains are applied simultaneously by a twisting deformation, multiple components affect the fatigue behavior of the metal films, depending on the twisting angle and x position. From Eqs. (6) and (11), it seems that the twisting angle is important, but the position has little influence on the shear strain. However, it must be considered that the increment of the tensile strain becomes significant at a high-angle twisting test in comparing to the shear strain. For example, for the ±90° twisting test, tensile strains of all x positions were under 0.7%, but for the ±180° twisting test, tensile strains for the x = 4 and 4.5 mm conditions were 2.17 and 2.74%, respectively, while the shear strain was smaller than 0.5% for those conditions. In other words, both the twisting angle and the x position have to be considered for assessment of the twisting reliability of the interconnects. The calculated strain agrees with the damage morphologies, as shown in Fig. 2(b). The strain of over 2% during the twisting test was far beyond the yield strength and the ultimate tensile strain of the Cu film. Reference Huang and Spaepen30,Reference Xiang and Vlassak31 Therefore, the high stress resulting from the multicomponent stress in the line located far from the central axis caused the fracture-like cracks and delamination in the images for 4 and 4.5 mm in Fig. 2(b).
To express the total strain due to twisting, all the strain components should be considered. Equivalent (von Mises) strain has generally been used to predict the failure of materials under multiaxial loading, including tensile and shear strains. Therefore, the equivalent strain is appropriate to represent the overall strain in twisting, which is defined by the following equation:
 $${\varepsilon _{{\rm{equivalent}}}} = {1 \over {\sqrt 2 \left( {1 + \nu } \right)}}\sqrt {{{\left( {{\varepsilon _{xx}} - {\varepsilon _{yy}}} \right)}^2} + {{\left( {{\varepsilon _{yy}} - {\varepsilon _{zz}}} \right)}^2} + {{\left( {{\varepsilon _{zz}} - {\varepsilon _{xx}}} \right)}^2} + {3 \over 2}\left( {{\varepsilon ^2}_{xy} + {\varepsilon ^2}_{yz} + {\varepsilon ^2}_{xz}} \right)} \quad .$$
In the results of the FEM simulation, the equivalent strain was estimated using Eq. (12). In the analytic model, the shear strain on the xy plane and the tensile strain in the y direction using Eqs. (6) and (11), respectively, were substituted into Eq. (12), resulting in Eq. (13),
 $${\varepsilon _{{\rm{equivalent}}}} = {1 \over {\sqrt 2 \left( {1 + \nu } \right)}}\sqrt {2{{\left\{ {\sqrt {1 + {{\left( {{{\theta \cdot x} \over {{L_0}}}} \right)}^2}} - 1} \right\}}^2} + {3 \over 2}{{\left( {{{\theta \cdot t} \over {2{L_0}}}} \right)}^2}} \quad .$$
Eq. (13) is consistent with the morphologies of fatigue damage under various conditions in Fig. 2. When the Cu interconnect is located at the central twisting axis (x = 0 mm) at which the tensile strain term is equal to zero, the shear strain is dominant, and the equivalent strain is determined by thickness and length. Since only the shear strain was applied on the Cu film at x = 0 mm during the twisting deformation, fatigue damages were generated except at the edges of the film in Fig. 2(c). Reference Shames and Pitarresi28 On the contrary, the tensile strain is applied on the entire surface of metal film including the edge of the film. After the x = 1 mm position, the tensile strain starts to be effective [Fig. 3(d)]. Therefore, after a certain position, fatigue damage was observed on the entire surface including the edge of the Cu film in Fig. 2(c). Additionally, the farther the position of the Cu interconnect away from the central twisting axis is, the greater the tensile strain term increases as expressed in Eq. (13). The density of the fatigue damages significantly increased after 1 mm in Fig. 2(c). The higher twisting angle enlarges the increase rate of the tensile strain term, depending on the position parameter.
The equivalent strains from the FEM simulation and the analytic model are compared in Fig. 3(e). Even though the analytic model was assumed to be a 2-D plane structure and additional shear strain from the Wagner stiffening effect Reference Trahair32 was not considered, the equivalent strains of both methods are almost the same under all twisting conditions. The biggest error range in the ±180° twisting test was below 10%, which means that the approximation of strain by the analytic solution shown in Fig. 3(e) and Eq. (13) is a reasonable expression of the twisting strain. Further modifications of the analytic solution are necessary for an exact description, but this model is a very powerful tool for simply calculating the strain in torsional deformation. The bending strain is widely known already to academic researchers and industrial engineers, and it is generally used to quantify the bending deformation. The equation and analysis suggested in this study can be applied to a more complex mechanical deformation of flexible electrodes.
C. Fatigue lifetime during the twisting test
The estimation and expectation of the fatigue lifetime under repeated deformation are very important not only for structural materials but also for functional materials such as flexible metal electrodes. The fatigue lifetime of a metal film depends on the applied mechanical stress or strain and can be divided into the following two regimes: low-cycle fatigue (LCF) and high-cycle fatigue (HCF), which correspond to the plastic and elastic behavior of a metal film, respectively. Reference Suresh23 In the LCF region, concentration of stress and high amplitude of stress during cyclic loading attribute to harsh plastic deformation, which can result in significant shortening of the fatigue lifetime (<104 cycles). In the HCF region, a small amplitude of stress is applied, which causes localized damages rather than macroscopic plasticity and failure of the material in >104 cycles. The lifetime in LCF and HCF is generally fitted using the Coffin–Manson and Basquin equations. Reference Coffin33,Reference Manson34 Coffin–Manson equation is expressed as follows:
 $${{\Delta {\varepsilon _{\rm{p}}}} \over 2} = {\varepsilon _{\rm{f}}}^\prime {\left( {2{N_{\rm{f}}}} \right)^{\rm{c}}}\quad ,$$
where
 ${{\Delta {\varepsilon _{\rm{p}}}} \over 2}$
is the plastic strain amplitude, εf is the fatigue ductility coefficient, N
f is the number of twisting cycles to failure, and c is the fatigue ductility exponent, which has a negative value. The value of the fatigue ductility exponent has a range of −0.2 to −0.4 in thin films under monotonic tension.
Reference Kraft, Schwaiger and Wellner35,Reference Sun, Wang, Zhang, Liu, Zhang, Ding, Zhang and Sun36
On the other hand, the Basquin equation presents the HCF region that is expressed in terms of the elastic stress amplitude and fatigue lifetime.
Reference Basquin37
 $${{\Delta {\varepsilon _{\rm{e}}}} \over 2} = {{\Delta \sigma } \over {2E}} = {{{\sigma _{\rm{f}}}^\prime } \over E}{\left( {2{N_{\rm{f}}}} \right)^{\rm{b}}}\quad ,$$
where
 ${{\Delta {\varepsilon _{\rm{e}}}} \over 2}$
is the elastic strain amplitude,
 ${\sigma _{\rm{f}}}^\prime$
is the fatigue strength coefficient, and b is the fatigue strength exponent. The fatigue strength exponent is in the range of −0.05 to −0.12.
Reference Dieter24
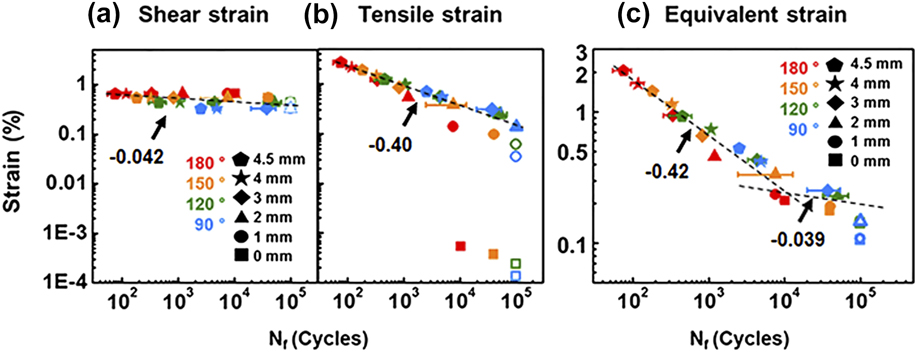
The elastic strain and plastic strain, used in either equation, can be calculated easily for most fatigue tests under monotonic tensile or simple uniaxial bending deformation. However, the calculation of multicomponent stress during twisting deformation is complex. Additionally, it is necessary that comprehensive stress and strain should be applied to the S–N curve, which means that the conventional S–N curve using the single-component strain is not appropriate. Therefore, the S–N curves were plotted by employing equivalent strain in Eq. (13) as well as single-strain components (tensile strain and shear strain) as shown in Fig. 4. The open symbol means that the electrical resistance did not increase until the restricted test cycles (105 cycles).
Strain of the single component of (a) shear or (b) tensile strain versus the number of cycles to failure. (c) Equivalent strain versus the number of cycles to failure. The Coffin–Manson and Basquin relationships are well fitted in the LCF and HCF regions, respectively. Open symbols mean that the resistance change of the Cu interconnects was not over 5% until after 105 cycles.

When the lifetime was compared only to the shear strain [see Fig. 4(a)], two distinctive regimes are not identified clearly. In the S–N curve using the shear strain, all data were fitted to one single fatigue strain-life curve which has an exponent value of −0.042. The exponent is close to the range of the fatigue strength exponent in the HCF region. This curve cannot clarify the relation of the strain and fatigue lifetime. The fatigue lifetimes show a wide range from 102 cycles to over 105 cycles, even though there are no large differences in shear strains (0.3–0.6%). The short fatigue lifetime at a low twisting angle, for instance ±90° at x = 4.5 mm or ±120° at x = 4.5 mm, cannot be explained sufficiently. In Fig. 4(b), which shows the comparison of lifetime to tensile strain, most of the points were fitted to a single fatigue strain-life curve similar to the shear strain-life curve in Fig. 4(a). The exponent value is −0.40 which is close to the range of the fatigue ductility exponent in LCF region. In this S–N curve, some points deviate from the linearity. A large deviation between the fitting and data points was found at a low tensile strain of 0.1% and smaller. It is hard to explain the gradual increase of the fatigue lifetime with an almost identical strain value. For example, fatigue lifetime under 150° at x = 1 mm is 4 times longer than that under ±180° at x = 1 mm, even if the tensile strains of the two conditions are close to 0.1%. These points barely have a linear relationship. To complement the S–N curves in Figs. 4(a) and 4(b), the strain term should include all the multiple strain components at once. When the fatigue lifetime was plotted as a function of the equivalent strain, all data points fit well to the S–N curve, as shown in Fig. 4(c). In the S–N curve with an equivalent strain, the two linear fitting lines are clearly distinguished. Both LCF and HCF regimes were found with the transition at a strain of 0.2–0.3% and 104 cycles. The exponents for each regime were −0.42 and −0.039 for LCF and HCF, respectively. These exponents were reasonable when compared to the previously reported values in the fatigue of metallic materials. Reference Dieter24,Reference Kraft, Schwaiger and Wellner35,Reference Sun, Wang, Zhang, Liu, Zhang, Ding, Zhang and Sun36 The ductility exponent value of −0.42 in LCF is close to the exponent of −0.40 in Fig. 4(b), and similarly, the fatigue strength exponent of −0.039 in HCF is close to −0.042 in Fig. 4(a). Therefore, it is clear that the S–N curve using the equivalent strain encompasses the effects of both tensile strain and shear strain terms, which can simplify the multiaxial stress condition. These results imply that the fatigue lifetime under multiple-stress conditions can be modeled using the equivalent strain, and the expectation of lifetime is also possible using fatigue exponents and constants obtained by fatigue tests.
IV. CONCLUSIONS
The multicomponent stress effect during the twisting fatigue of Cu interconnects with different positions on a compliant substrate was investigated under various twisting angles. Fatigue lifetime was estimated by the in situ measurement of the electrical resistance. The electrical resistance increased due to fatigue damage, which included extrusions and cracks, caused by the irreversible motion of dislocation in the metal interconnects. Interestingly, the failure cycles when the resistance starts to increase depended not only on the twisting angle but also on the position of the Cu interconnects. As the location of the Cu interconnects became more distant from the rotation axis, the increase in resistance was more rapid and extrusions were formed after fewer cycles. Even the fracture-like cracks were observed on the film at the edge of the substrate under high angle. To quantify the twisting strain, the strain value was calculated by an FEM simulation, and an analytic solution was suggested by considering the parameters of the line position and the twisting angle. Both shear strain and tensile strain were applied simultaneously in the twisting deformation, but the dominant strain was determined mainly by the position of the interconnects on the substrate and the twisting angle. The overall strain due to twisting was represented by the equivalent strain including both strains at the multi-axial condition. Using the equivalent strain, the S–N curve was plotted and the LCF and HCF regimes were distinguished by the corresponding fatigue coefficients. The fatigue coefficients were valid compared to the range of the reported values of the metals. In the twisting deformation, equivalent strain consisting of tensile strain and shear strain is found to be important. This study provides a fundamental understanding of the twisting fatigue behavior of the Cu thin films. Numerical analysis and analytic solution of the multicomponent stress during twisting may aid in developing the guidelines for designing flexible devices with long-term reliability. The S–N curve using the equivalent strain is also useful in predicting the reliability of flexible devices in the multiaxial stress and strain conditions.
ACKNOWLEDGMENTS
This research was supported by “Development of Interconnection System and Process for Flexible Three Dimensional Heterogeneous Devices” funded by MOTIE (Ministry of Trade, Industry and Energy) and National Research Foundation of Korea (NRF) grant funded by the Korea Government (MSIP; Ministry of Science, ICT & Future Planning) (No. 2017R1C1B5017889) in Korea.