Introduction
Reductions in gray matter volume have been extensively reported in patients with schizophrenia, predominantly in temporal, frontal, and parietal brain regions (Bora et al. Reference Bora, Fornito, Radua, Walterfang, Seal, Wood, Yucel, Velakoulis and Pantelis2011; Chan et al. Reference Chan, Di, McAlonan and Gong2011; Haijma et al. Reference Haijma, Van Haren, Cahn, Koolschijn, Hulshoff Pol and Kahn2013). Such volumetric decreases are also found, albeit attenuated, in unaffected relatives of schizophrenia probands (Boos et al. Reference Boos, Aleman, Cahn, Hulshoff Pol and Kahn2007; McDonald et al. Reference McDonald, Dineen and Hallahan2008), and in subjects at ultra-high risk (UHR) for psychosis (Fusar-Poli et al. Reference Fusar-Poli, Borgwardt, Crescini, Deste, Kempton, Lawrie, Mc Guire and Sacchetti2011). In UHR individuals, gray matter volume reductions in medial temporal regions are shown to predict subsequent transition to psychosis (Mechelli et al. Reference Mechelli, Riecher-Rossler, Meisenzahl, Tognin, Wood, Borgwardt, Koutsouleris, Yung, Stone, Phillips, McGorry, Valli, Velakoulis, Woolley, Pantelis and McGuire2011) and, longitudinally, an accelerated thinning of frontal areas has been associated with progression to psychosis (Cannon et al. Reference Cannon, Chung, He, Sun, Jacobson, van Erp, McEwen, Addington, Bearden, Cadenhead, Cornblatt, Mathalon, McGlashan, Perkins, Jeffries, Seidman, Tsuang, Walker, Woods and Heinssen2015). However, the neurobiological mechanisms underlying volumetric changes in patients with psychosis and in people with subclinical psychotic-like experiences are unclear.
A possible mechanism for neuroanatomical changes in psychosis is hypofunction of the N-methyl D-aspartate (NMDA) glutamate receptor (Deutsch et al. Reference Deutsch, Rosse, Schwartz and Mastropaolo2001; Abbott & Bustillo, Reference Abbott and Bustillo2006). NMDA-receptor dysfunction is found to lead to insufficient excitation of GABAergic inhibitory interneurons, downregulating their activity and consequently increasing activity of pyramidal glutamatergic neurons; this may in turn result in excessive glutamate concentrations around neurons and potentially in excitotoxicity through the influx of calcium ions (Choi, Reference Choi1994). Thus, excessive glutamate is proposed as a mechanism that would give rise to alterations in gray matter volume in schizophrenia and groups at risk of developing the disorder (Port & Agarwal, Reference Port and Agarwal2011).
Increased concentrations of glutamatergic metabolites are observed in schizophrenia across several cortical areas (Marsman et al. Reference Marsman, van den Heuvel, Klomp, Kahn, Luijten and Hulshoff Pol2013; Merritt et al. Reference Merritt, Egerton, Kempton, Taylor and McGuire2016), and prefrontal elevations in levels of Glx (glutamate + glutamine) are found in antipsychotic-naïve individuals at UHR for psychosis (Merritt et al. Reference Merritt, Egerton, Kempton, Taylor and McGuire2016), highlighting a role for abnormal levels of glutamatergic metabolites in increasing psychosis vulnerability. Currently, however, human imaging studies provide only limited evidence to support the hypothesis that increased glutamate signaling may lead to excitotoxicity and reduced gray matter volume. In support of this hypothesis, there are negative relationships between caudate Glx levels and caudate volume in first-episode psychosis (Plitman et al. Reference Plitman, Patel, Chung, Pipitone, Chavez, Reyes-Madrigal, Gomez-Cruz, Leon-Ortiz, Chakravarty, de la Fuente-Sandoval and Graff-Guerrero2016), left hippocampal Glx levels and left hippocampal volume in unmediated patients (Kraguljac et al. Reference Kraguljac, White, Reid and Lahti2013), and thalamic glutamate levels and cingulate cortex volume in UHR subjects (Stone et al. Reference Stone, Day, Tsagaraki, Valli, McLean, Lythgoe, O'Gorman, Barker and McGuire2009). In contrast, positive relationships between thalamic glutamate metabolite levels and more widespread volumetric reductions have also been reported (Theberge et al. Reference Theberge, Williamson, Aoyama, Drost, Manchanda, Malla, Northcott, Menon, Neufeld, Rajakumar, Pavlosky, Densmore, Schaefer and Williamson2007; Stone et al. Reference Stone, Day, Tsagaraki, Valli, McLean, Lythgoe, O'Gorman, Barker and McGuire2009; Aoyama et al. Reference Aoyama, Theberge, Drost, Manchanda, Northcott, Neufeld, Menon, Rajakumar, Pavlosky, Densmore, Schaefer and Williamson2011). Given that brain glutamate levels can be affected by antipsychotic treatment (Egerton et al. Reference Egerton, Bhachu, Merritt, McQueen, Szulc and McGuire2017), further evidence in antipsychotic-naïve individuals may help clarify the relationship between glutamate levels and gray matter changes associated with psychosis.
Consistent with a continuum model of psychosis, which proposes dimensional continuity between subclinical psychotic-like experiences in healthy individuals (or schizotypy) and in clinically relevant psychosis (Linscott & van Os, Reference Linscott and van Os2013; Nelson et al. Reference Nelson, Seal, Pantelis and Phillips2013), volumetric changes have also been documented in schizotypy (Modenato & Draganski, Reference Modenato and Draganski2015). While the majority of healthy people with schizotypy as identified through self-report questionnaires are not expected to develop psychosis, high schizotypy (HS) is associated with higher risk for developing a psychotic disorder (Kwapil et al. Reference Kwapil, Gross, Silvia and Barrantes-Vidal2013), and represents a useful and widely applied paradigm to investigate neurobiological factors associated with schizophrenia spectrum disorders (Barrantes-Vidal et al. Reference Barrantes-Vidal, Grant and Kwapil2015). HS involves typically non-treatment-seeking individuals from the general population who are commonly identified through psychometrically validated self-report measures, such as the Oxford and Liverpool Inventory of Feelings and Experiences (O-LIFE) questionnaire (Mason et al. Reference Mason, Linney and Claridge2005), or the Schizotypal Personality Questionnaire (SPQ) (Raine, Reference Raine1991). After our initial report of increased gray matter volume in posterior cortical midline areas in HS (Modinos et al. Reference Modinos, Mechelli, Ormel, Groenewold, Aleman and McGuire2010), subsequent studies found decreases in other fronto-temporal regions including the anterior cingulate cortex (ACC; Ettinger et al. Reference Ettinger, Williams, Meisenzahl, Moller, Kumari and Koutsouleris2012; Nenadic et al. Reference Nenadic, Lorenz, Langbein, Dietzek, Smesny, Schonfeld, Fananas, Sauer and Gaser2015; Wang et al. Reference Wang, Yan, Yin, Fan, Cheung, Pantelis and Chan2015; Satterthwaite et al. Reference Satterthwaite, Wolf, Calkins, Vandekar, Erus, Ruparel, Roalf, Linn, Elliott, Moore, Hakonarson, Shinohara, Davatzikos, Gur and Gur2016), while also a positive association between posterior cortical midline volume and schizotypy scores was reported (Nenadic et al. Reference Nenadic, Lorenz, Langbein, Dietzek, Smesny, Schonfeld, Fananas, Sauer and Gaser2015). Furthermore, a more recent study described both negative and positive associations between gray matter volume and the degree of schizotypy, with negative correlations involving frontal and temporal lobes and positive correlations comprising parietal, temporal, and subcortical regions (Wiebels et al. Reference Wiebels, Waldie, Roberts and Park2016). With regard to glutamate levels in schizotypy, we recently reported no differences between high and low schizotypes in the ACC, although the striking finding in this group was that glutamate levels were associated with increased neural response to emotion in the striatum, medial prefrontal cortex, and amygdala (Modinos et al. Reference Modinos, McLaughlin, Egerton, McMullen, Kumari, Barker, Keysers and Williams2017). Since replication studies are infrequent in neuroimaging research, and considering that the HS paradigm allows investigation of neurobiological processes on the psychosis continuum without confounding effects of exposure to previous antipsychotic treatment or illness chronicity, our study sought to address the issue of whether the predicted alterations in gray matter volume in HS subjects would be related to glutamate levels in the ACC. The cingulate cortex was chosen given that abnormalities in glutamatergic metabolites in this region are particularly apparent in the at-risk stage of psychosis (Merritt et al. Reference Merritt, Egerton, Kempton, Taylor and McGuire2016), and that altered anterior cingulate volume has been found in schizotypy (Ettinger et al. Reference Ettinger, Williams, Meisenzahl, Moller, Kumari and Koutsouleris2012). We tested the hypothesis that volumetric changes in HS individuals would be negatively correlated with glutamate levels in the ACC.
Materials and methods
Participants
The recruitment procedure is described in detail in our recent article (Modinos et al. Reference Modinos, McLaughlin, Egerton, McMullen, Kumari, Barker, Keysers and Williams2017). Briefly, 250 healthy volunteers who responded to the Research Volunteer Recruitment Webpage of King's College London were prescreened with the short version of the O-LIFE questionnaire (Mason et al. Reference Mason, Linney and Claridge2005). Participants with high scores on the unusual experiences (UE) subscale of the O-LIFE (UE score >7, HS group), and participants with low levels of UE [score <2, low schizotypy (LS) group] were then invited to participate, following previous imaging research in HS (Premkumar et al. Reference Premkumar, Ettinger, Inchley-Mort, Sumich, Williams, Kuipers and Kumari2012). The UE subscale of the O-LIFE was used as it is associated with higher severity of positive symptoms in schizophrenia (Cochrane et al. Reference Cochrane, Petch and Pickering2010), and our first neuroanatomical study in schizotypy had also selected individuals based on positive-dimension scores on a similar self-report instrument (Modinos et al. Reference Modinos, Mechelli, Ormel, Groenewold, Aleman and McGuire2010).
Twenty-three individuals were included in the HS group (11 females; age range 18–55 years; mean age 28.48 years) and 23 in the LS group (11 females; age range 18–58 years; mean age 28.36 years). Participants with personal history of neurologic or psychiatric disorders were excluded, as assessed with the Mini International Neuropsychiatric Inventory (Sheehan et al. Reference Sheehan, Lecrubier, Sheehan, Amorim, Janavs, Weiller, Hergueta, Baker and Dunbar1998), administered by a trained interviewer. All participants were magnetic resonance imaging (MRI)-safe, and none had used recreational drugs in the 2 weeks prior to MRI scanning, or met criteria for substance abuse/dependency by self-report. Of note, there was no sample overlap between the current study and our previous volumetric study in HS (Modinos et al. Reference Modinos, Mechelli, Ormel, Groenewold, Aleman and McGuire2010). All participants gave written informed consent to the study protocol, which was approved by the King's College London Research Ethics Committee. The authors assert that all procedures contributing to this work comply with the ethical standards of the relevant national and institutional committees on human experimentation and with the Helsinki Declaration of 1975, as revised in 2008.
Assessments
Subjects completed the following assessments before scanning commenced: a validated short version of the Wechsler Adult Intelligence Scale-III (WAIS-III) (Velthorst et al. Reference Velthorst, Levine, Henquet, de Haan, van Os, Myin-Germeys and Reichenberg2013); a semi-structured interview adapted from the Early Psychosis Prevention and Intervention Centre (EPPIC) Drug and Alcohol Assessment Schedule (http://www.eppic.org.au) to assess current/past medication use, current/past use of alcohol, tobacco, and illicit drugs; and the Social Functioning Questionnaire (SFQ) (Tyrer et al. Reference Tyrer, Nur, Crawford, Karlsen, McLean, Rao and Johnson2005).
Volumetric MRI protocol
For all subjects, a three-dimensional T1-weighted inversion recovery prepared gradient echo sequence was obtained on a General Electric Discovery MR750 3 T system (Milwaukee, WI, USA) at the Institute of Psychiatry, Psychology and Neuroscience, King's College London (voxel size: 1.05 × 1.05 × 1.2 mm, field of view: 270 mm, 196 slices, TR: 7.3 ms, TE: 3.0 ms, inversion time: 400 ms, flip angle = 11°), based on the well-validated ADNI 2/ADNI GO protocols (see http://adni.loni.usc.edu/methods/documents/mri-protocols/).
Structural images were preprocessed using the Voxel-Based Morphometry protocol (Ashburner, Reference Ashburner2010) implemented in SPM12 (http://www.fil.ion.ucl.ac.uk/spm/software/spm12), running on Matlab 9.2 (The MathWorks, Natick, MA, USA). The following steps were applied: (1) segmentation of all images into gray matter (GM), white matter (WM), and cerebrospinal fluid (CSF) partitions; (2) Warping of GM partitions into a new study-specific reference space, to provide increased accuracy of inter-subject alignment; (3) normalization of the warped GM partitions to the Montreal Neuroanatomical Imaging (MNI) space, to generate smoothed [10 mm full-width-half-maximum (FWHM)], spatially normalized and modulated GM images in MNI space. Global GM volume and total intracranial volume were calculated. Global GM volume was estimated using the total amount of gray matter in the GM images obtained from segmentation, including the cerebellar gray matter. Total intracranial volume was calculated for each subject by summing together the voxel values of GM, WM, and CSF from the original tissue partitions using the ImCalc function in SPM12.
Proton magnetic resonance spectrum protocol and quantification
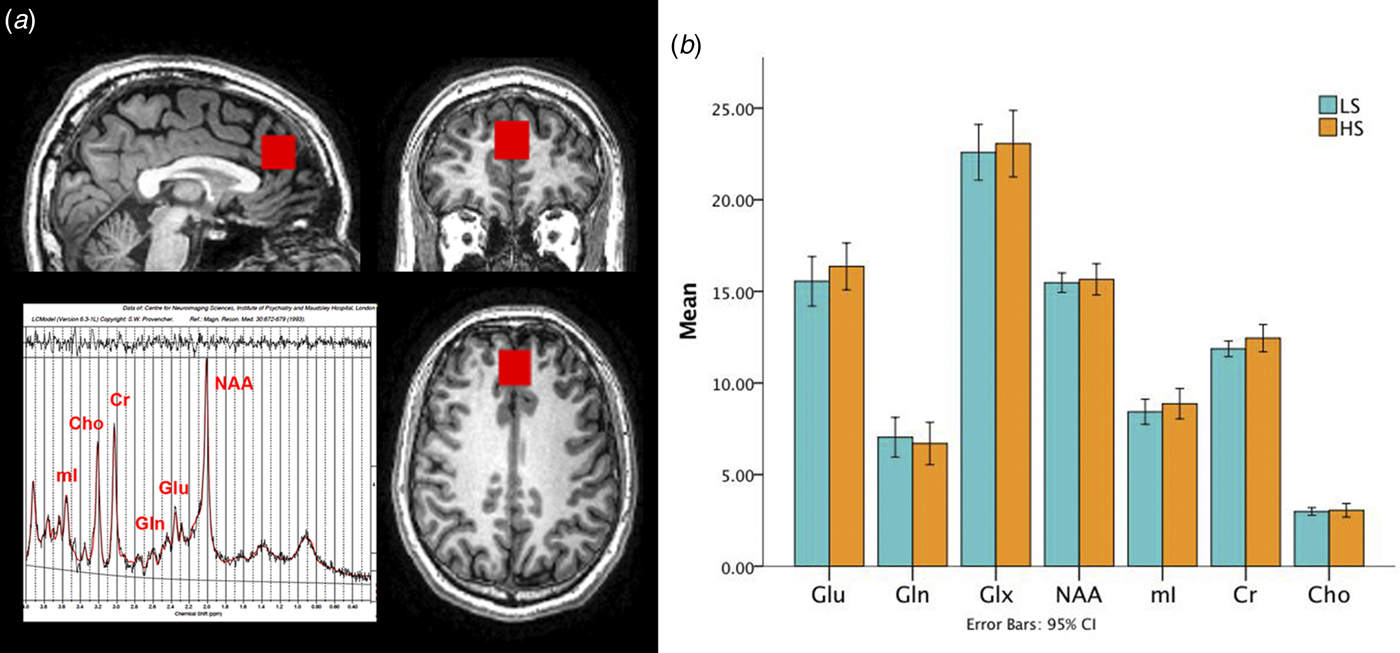
A proton magnetic resonance spectrum (1H-MRS; PRESS, Point RESolved Spectroscopy) was acquired during the same scanning session, after the structural MRI scan, from the bilateral ACC (Fig. 1a), as described in previous studies from our group in UHR subjects and patients with first-episode psychosis (Stone et al. Reference Stone, Day, Tsagaraki, Valli, McLean, Lythgoe, O'Gorman, Barker and McGuire2009; Egerton et al. Reference Egerton, Brugger, Raffin, Barker, Lythgoe, McGuire and Stone2012; Egerton et al. Reference Egerton, Stone, Chaddock, Barker, Bonoldi, Howard, Merritt, Allen, Howes, Murray, McLean, Lythgoe, O'Gorman and McGuire2014), and schizotypy (Modinos et al. Reference Modinos, McLaughlin, Egerton, McMullen, Kumari, Barker, Keysers and Williams2017).
(a) Magnetic resonance spectroscopy voxel placement in the anterior cingulate cortex. (b) Bar graphs showing metabolite levels (in institutional units) in each group (LS, low schizotypy; HS, high schizotypy). Glu, glutamate; Gln, glutamine; Glx, glutamate + glutamine; NAA, N-acetylaspartate; Mi, myo-inositol; Cr, creatine; Cho, choline.

A standard GE PROBE (proton brain examination) sequence was used, which incorporates a standardized chemically selective suppression water suppression routine (TE: 30 ms; TR: 3000 ms; 96 averages collected). For each acquisition, unsuppressed water reference spectra (16 averages) were also acquired. Shimming was optimized, with auto-prescan performed twice before each scan. The region of interest (ROI) in the bilateral ACC was prescribed medially from the midline sagittal localizer, and the center of the 20 × 20 × 20 mm ROI mostly covering the ACC was placed 16 mm above the anterior section of the genu of the corpus callosum at 90° to the anterior commissure–posterior commissure line.
Spectra were analyzed using LCModel version 6.3-1L (http://s-provencher.com/pages/lcmodel.shtml) (Provencher, Reference Provencher1993). Water-scaled glutamate (Glu), glutamine (Gln), Glx (glutamate + glutamine), myo-inositol (mI), choline (Cho), creatine (Cre), and N-acetylaspartate (NAA) values were corrected for voxel CSF using the formula: metabolite corrected = metabolite concentration×[proportion WM + (1.283×proportion GM) + (1.548×proportion CSF)]/(proportion WM + proportion GM) (Provencher, 2016). Voxel GM, WM, and CSF content for each subject were ascertained by extracting the location of the voxel from the spectra file headers, and using an in-house program to calculate the percentage of GM, WM, and CSF using the segmented T1-weighted images. We used Cramer-Rao minimum variance bounds (CRLB) >20% as reported by LCModel, which are estimates of fit of the metabolite peaks, and signal-to-noise ratio (SNR) <8 to exclude poorly fitted metabolite peaks from statistical analysis (Mouchlianitis et al. Reference Mouchlianitis, Bloomfield, Law, Beck, Selvaraj, Rasquinha, Waldman, Turkheimer, Egerton, Stone and Howes2016; Provencher, 2016); only one HS subject exceeded the CRLB threshold and the final sample thus involved 22 HS subjects and 23 LS subjects. This sample largely overlaps with our recent publication in 21 HS and 22 LS subjects on functional MRI–MRS interactions (Modinos et al. Reference Modinos, McLaughlin, Egerton, McMullen, Kumari, Barker, Keysers and Williams2017). The primary 1H-MRS measure was glutamate corrected for voxel CSF. No correction was made for T1 and T2 relaxation, and metabolite concentrations are given in ‘institutional units’.
Statistics
Analysis of behavioral and demographic data was performed in SPSS 23 (http://www-01.ibm.com/software/uk/analytics/spss/). The effect of group on these measures was tested using independent samples t tests for parametric data and χ2 tests for non-parametric data. Significant effects are reported at p < 0.05.
1H-MRS data analysis
Group differences in bilateral ACC glutamate concentrations were examined with an independent samples t test in SPSS. Exploratory analyses of the other metabolites present in the spectra were also conducted with a t test corrected for multiple comparisons (threshold for six metabolites, one voxel; p = 0.008). Levene's test was used to check for equality of variance across groups.
MRI data analysis
Statistical analyses of MRI data were implemented in SPM12 using an independent samples t test, with proportional scaling of the total intracranial volume to adjust for global effects. We examined significant group effects in GM volume in HS and LS using a voxel-wise ROI approach. ROIs in the precuneus and posterior cingulate gyrus were specified a priori using the coordinates from our previous structural study in an independent HS sample (Modinos et al. Reference Modinos, Mechelli, Ormel, Groenewold, Aleman and McGuire2010) and in the ACC from a previous UHR study (Borgwardt et al. Reference Borgwardt, McGuire, Aston, Berger, Dazzan, Gschwandtner, Pfluger, D'Souza, Radue and Riecher-Rossler2007a): MNI coordinates precuneus x, y, z = 0, −54, 44; posterior cingulate gyrus x, y, z = 2, −42, 18; and ACC x, y, z = −6, 0, 43. These coordinates were used for small volume correction with a 10-mm sphere. For all tests, we used an initial voxel-wise search threshold of p < 0.005 uncorrected, to then only consider significant effects which survived voxel-wise family-wise error (FWE) correction for multiple comparisons at p < 0.05. Exploratory whole-brain results were analyzed at the same initial uncorrected threshold for completeness, but only effects surviving voxel-wise p < 0.05 FWE correction are discussed.
Integration of MRI and 1H-MRS data
The relationship between GM volume and glutamate levels in the ACC was established by using the individual glutamate concentrations as a regressor in a voxel-wise ROI analysis of variance (precuneus, posterior cingulate gyrus, and ACC as described above), also using proportional scaling of the total intracranial volume to adjust for global effects. The same correction for multiple comparisons as described above was used.
Correlations between imaging and schizotypy/social functioning levels
Relationships between glutamate levels and both schizotypy scores and social functioning levels were explored in the HS group using Pearson's product moment correlation, correcting for the number of correlations performed (threshold p < 0.05/2 comparisons = 0.025). To assess correlations between GM volume and schizotypy scores/social functioning levels in HS individuals, two separate ROI regression analyses using the individual O-LIFE total/SFQ total scores as regressor in SPM12 were conducted, with the ROI coordinates as described above and applying the same correction for multiple comparisons.
Results
Demographic and questionnaire data
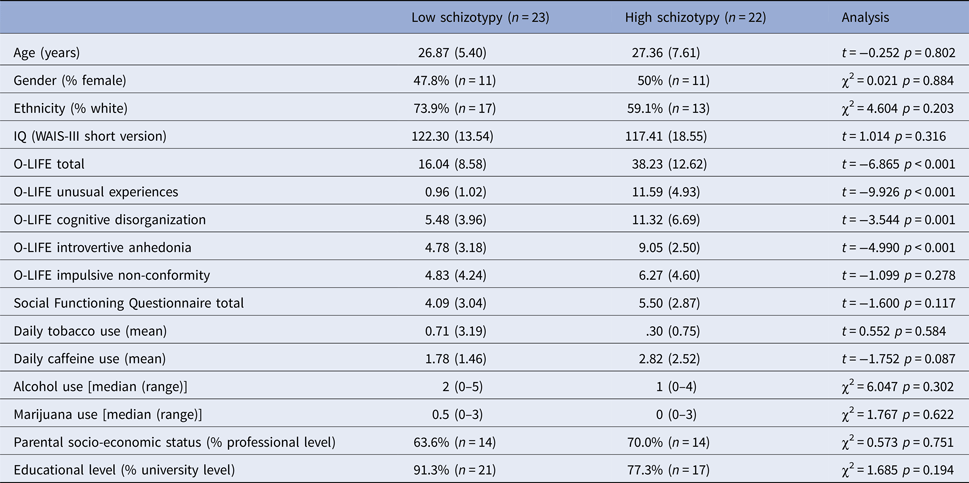
Full demographic and behavioral results are presented in Table 1. The HS and LS groups only differed significantly by design in the schizotypy measures, with HS subjects showing higher scores than those with LS on the O-LIFE: total (p < 0.001), UE (p < 0.001), cognitive disorganization (CD; p = 0.001), and introvertive anhedonia (IA; p < 0.001). High positive schizotypy (UE subscale) was positively associated with the CD (r = 0.505, p = 0.017) and marginally with the IA subscales (r = 0.381, p = 0.080).
Sample characteristics

Note: higher scores on the Social Functioning Questionnaire reflect lower social functioning. O-LIFE = Oxford–Liverpool Inventory of Feelings and Experiences; Wechsler Adult Intelligence Scale-III.
1H-MRS spectral quality
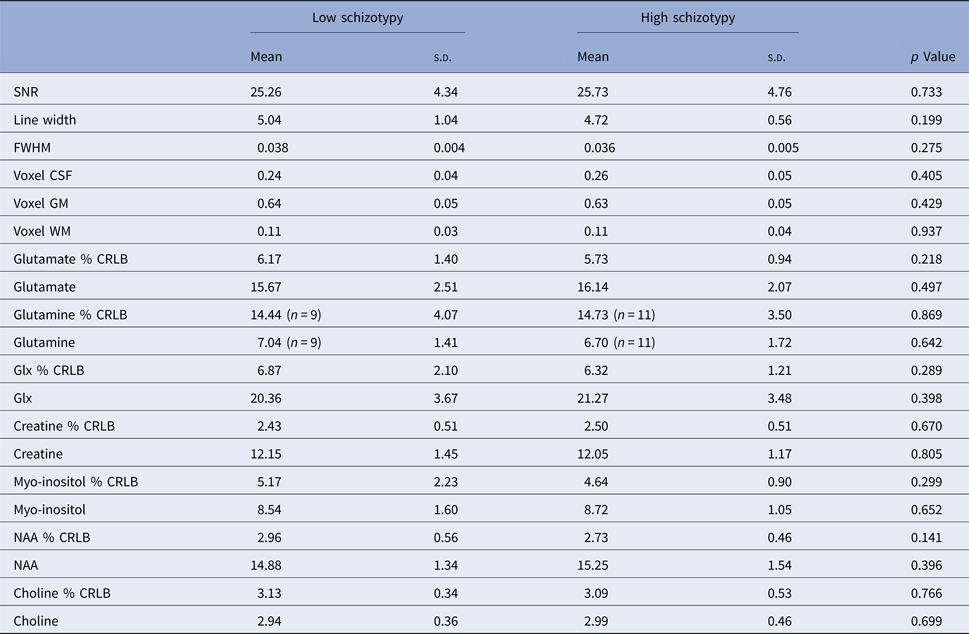
Spectra obtained were of good quality, with LCModel reporting mean ± s.d. SNR of 25.6 ± 4.6, line width of 4.9 ± 0.8 Hz, and FWHM of 0.04 ± 0.004. For Gln, only data from nine LS subjects and 11 HS subjects were usable, with a similar number of subjects excluded from each group. There were no significant group differences in any of the parameters relating to spectral quality or voxel tissue content (Table 2).
1H-MRS quality parameters and metabolite levels by group

SNR, signal-to-noise ratio; CRLB, Cramer-Rao Lower Bounds; CSF, cerebrospinal fluid; FWHM, full-width-half-maximum; GM, gray matter; NAA, N-acetylaspartate; WM, white matter.
Group differences in 1H-MRS
There was no evidence of between-group differences in glutamate levels, or in any of the other metabolites present in the bilateral ACC voxel (glutamine, Glx, myo-inositol, choline, creatine, and NAA; Fig. 1b; Table 2). There were no significant correlations between glutamate concentrations and age (r = −0.194, p = 0.203) or caffeine use (r = 0.189, p = 0.215). Similarly, in the HS group, no associations were found between GABA levels and social functioning scores (r = 0.318, p = 0.149), or O-LIFE total scores (r = 0.107, p = 0.634).
Group differences in gray matter volume
Groups did not differ in global GM volume (LS, mean: 797.54 ± 63.15 mm3; HS, mean: 784.27 ± 75.29 mm3; t = 0.642; p = 0.525) or total intracranial volume (LS, mean: 1.0 × 10+03 × 1.49 ± 0.14 mm3; HS, mean: 1.0 × 10+03 × 1.50 ± 0.11 mm3; t = −0.174; p = 0.862).
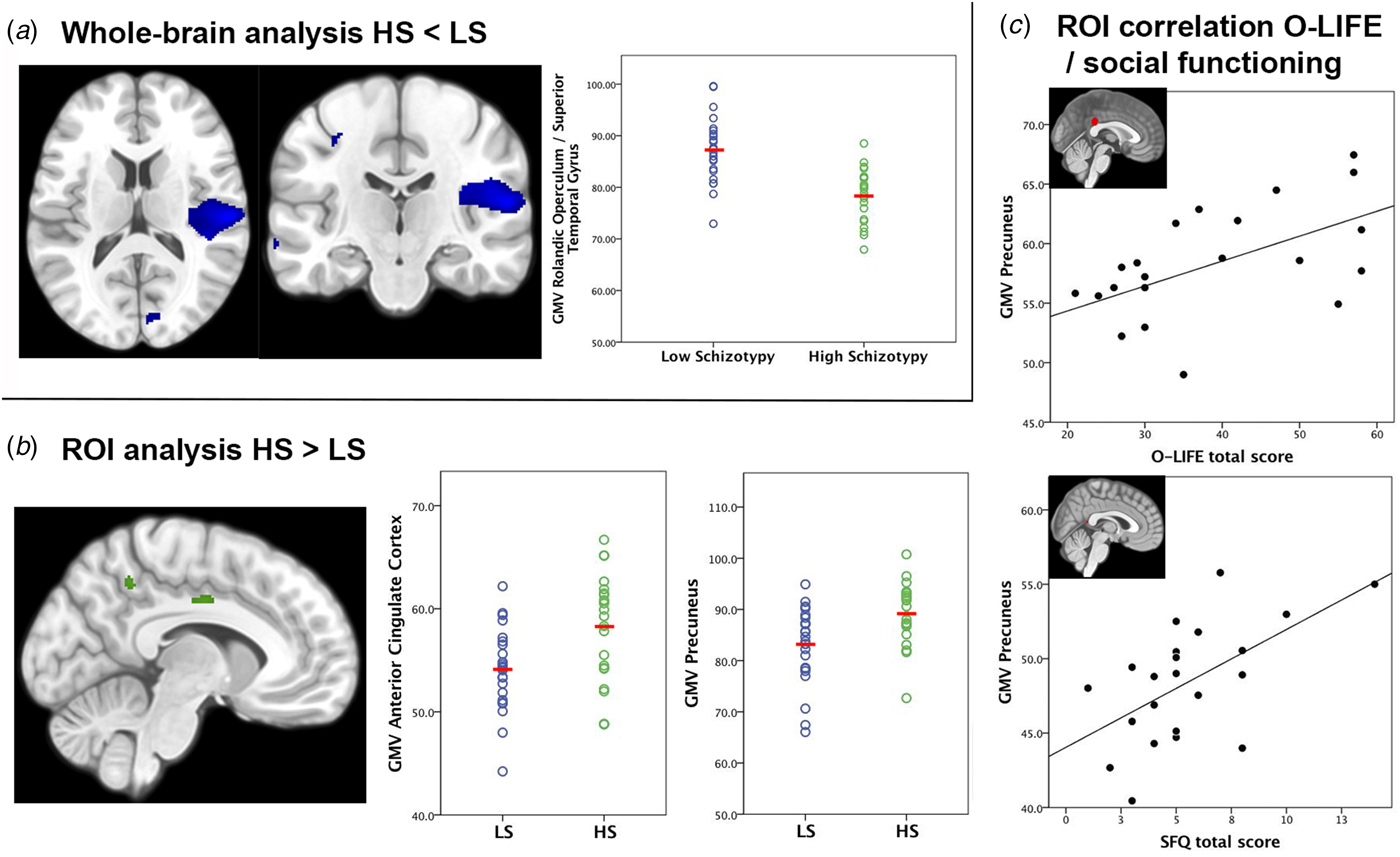
Exploratory whole-brain analyses revealed smaller GM volume in HS compared with LS subjects in a right-sided region including the rolandic operculum and the superior temporal gyrus (peak coordinate at x, y, z = 58, −20, 14; T = 5.07; Z = 4.46; p FWE = 0.045) (Fig. 2a). There were no other significant whole-brain effects, nor significant effects were identified in our ROIs for the HS < LS contrast (voxel-wise FWE-corrected).
(a) Decreased gray matter volume (GMV) in the rolandic operculum/superior temporal gyrus in subjects with high schizotypy (HS) compared with those with low schizotypy (LS). (b) Increased GMV in the precuneus and the anterior cingulate cortex in HS compared with LS subjects. (c) Positive associations between GMV in the precuneus and levels of schizotypy (O-LIFE total, upper panel) and levels of social functioning (SFQ total, lower panel). Higher O-LIFE scores indicate higher schizotypy, and higher SFQ scores indicate poorer social functioning. All effects were considered significant at voxel-wise p < 0.05 FWE correction; statistical parametric maps thresholded at p < 0.005 uncorrected for display purposes.
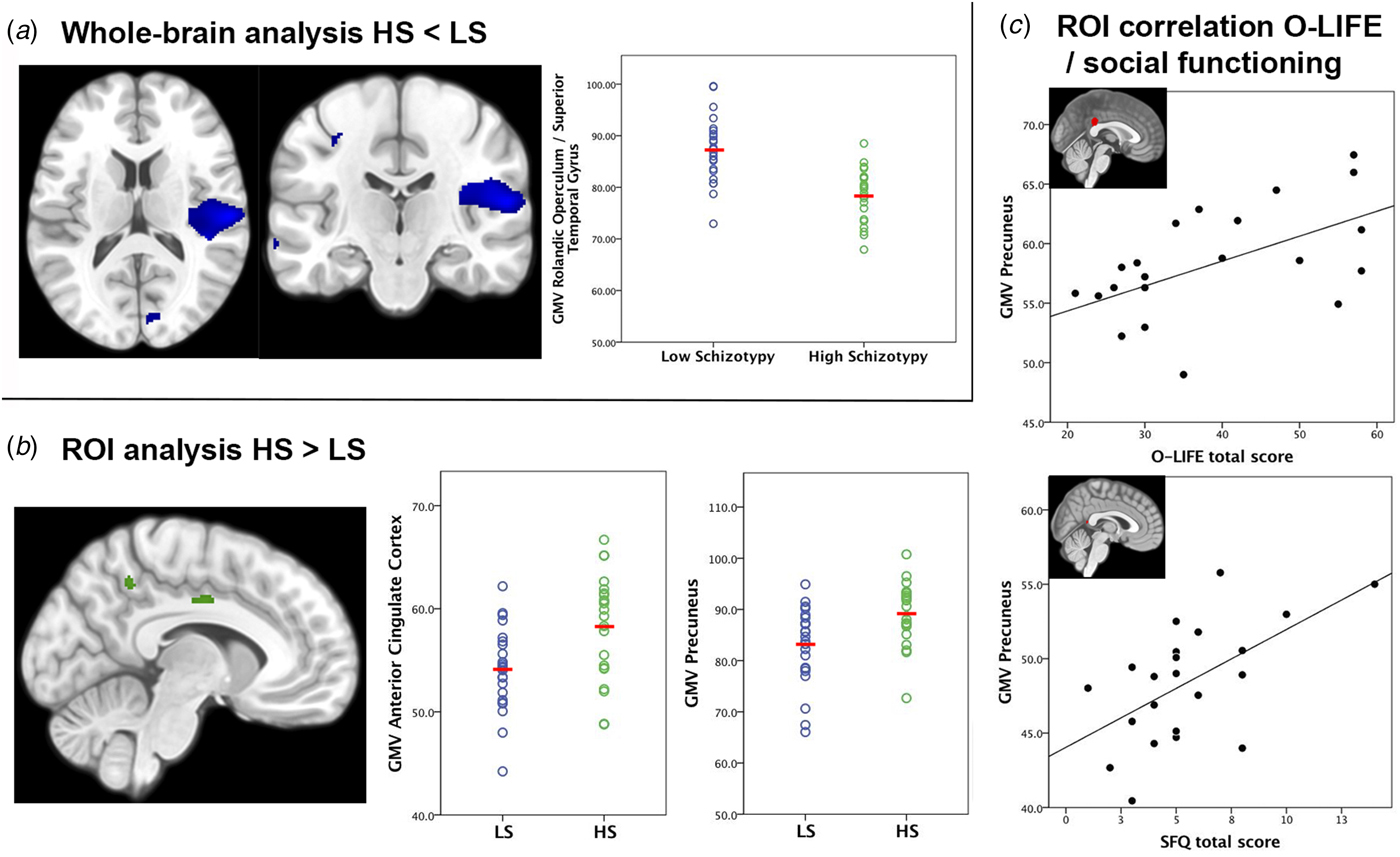
Using ROI analysis, subjects with HS showed larger GM volumes in the precuneus (peak coordinate at x, y, z = −8, −50, 46; T = 3.03; Z = 2.87; p FWE = 0.043) and in the ACC (peak coordinate at x, y, z = −9, −8, 39; T = 3.05; Z = 2.89; p FWE = 0.041) (Fig. 2b). Groups did not differ in age or illicit drug/alcohol use, and the results of the GM volume comparisons did not change when age or illicit drug/alcohol use were added to the model. No regions survived voxel-wise FWE correction for the HS > LS contrast at the whole-brain level.
ROI regression analyses were used to assess correlations between GM volume and schizotypal scores and social functioning. These revealed a positive association between O-LIFE total scores and GM volume in the precuneus (peak coordinate at x, y, z = 0, −38, 24; T = 3.03; Z = 2.72; p FWE = 0.044), as well as positive association between SFQ total scores and precuneus volume (peak coordinate at x, y, z = 2, −45, 12; T = 3.11; Z = 2.77; p FWE = 0.039). Thus, larger GM volumes in the precuneus were related to higher schizotypal traits and poorer social functioning in HS individuals.
Relationship between 1H-MRS measures and GMV
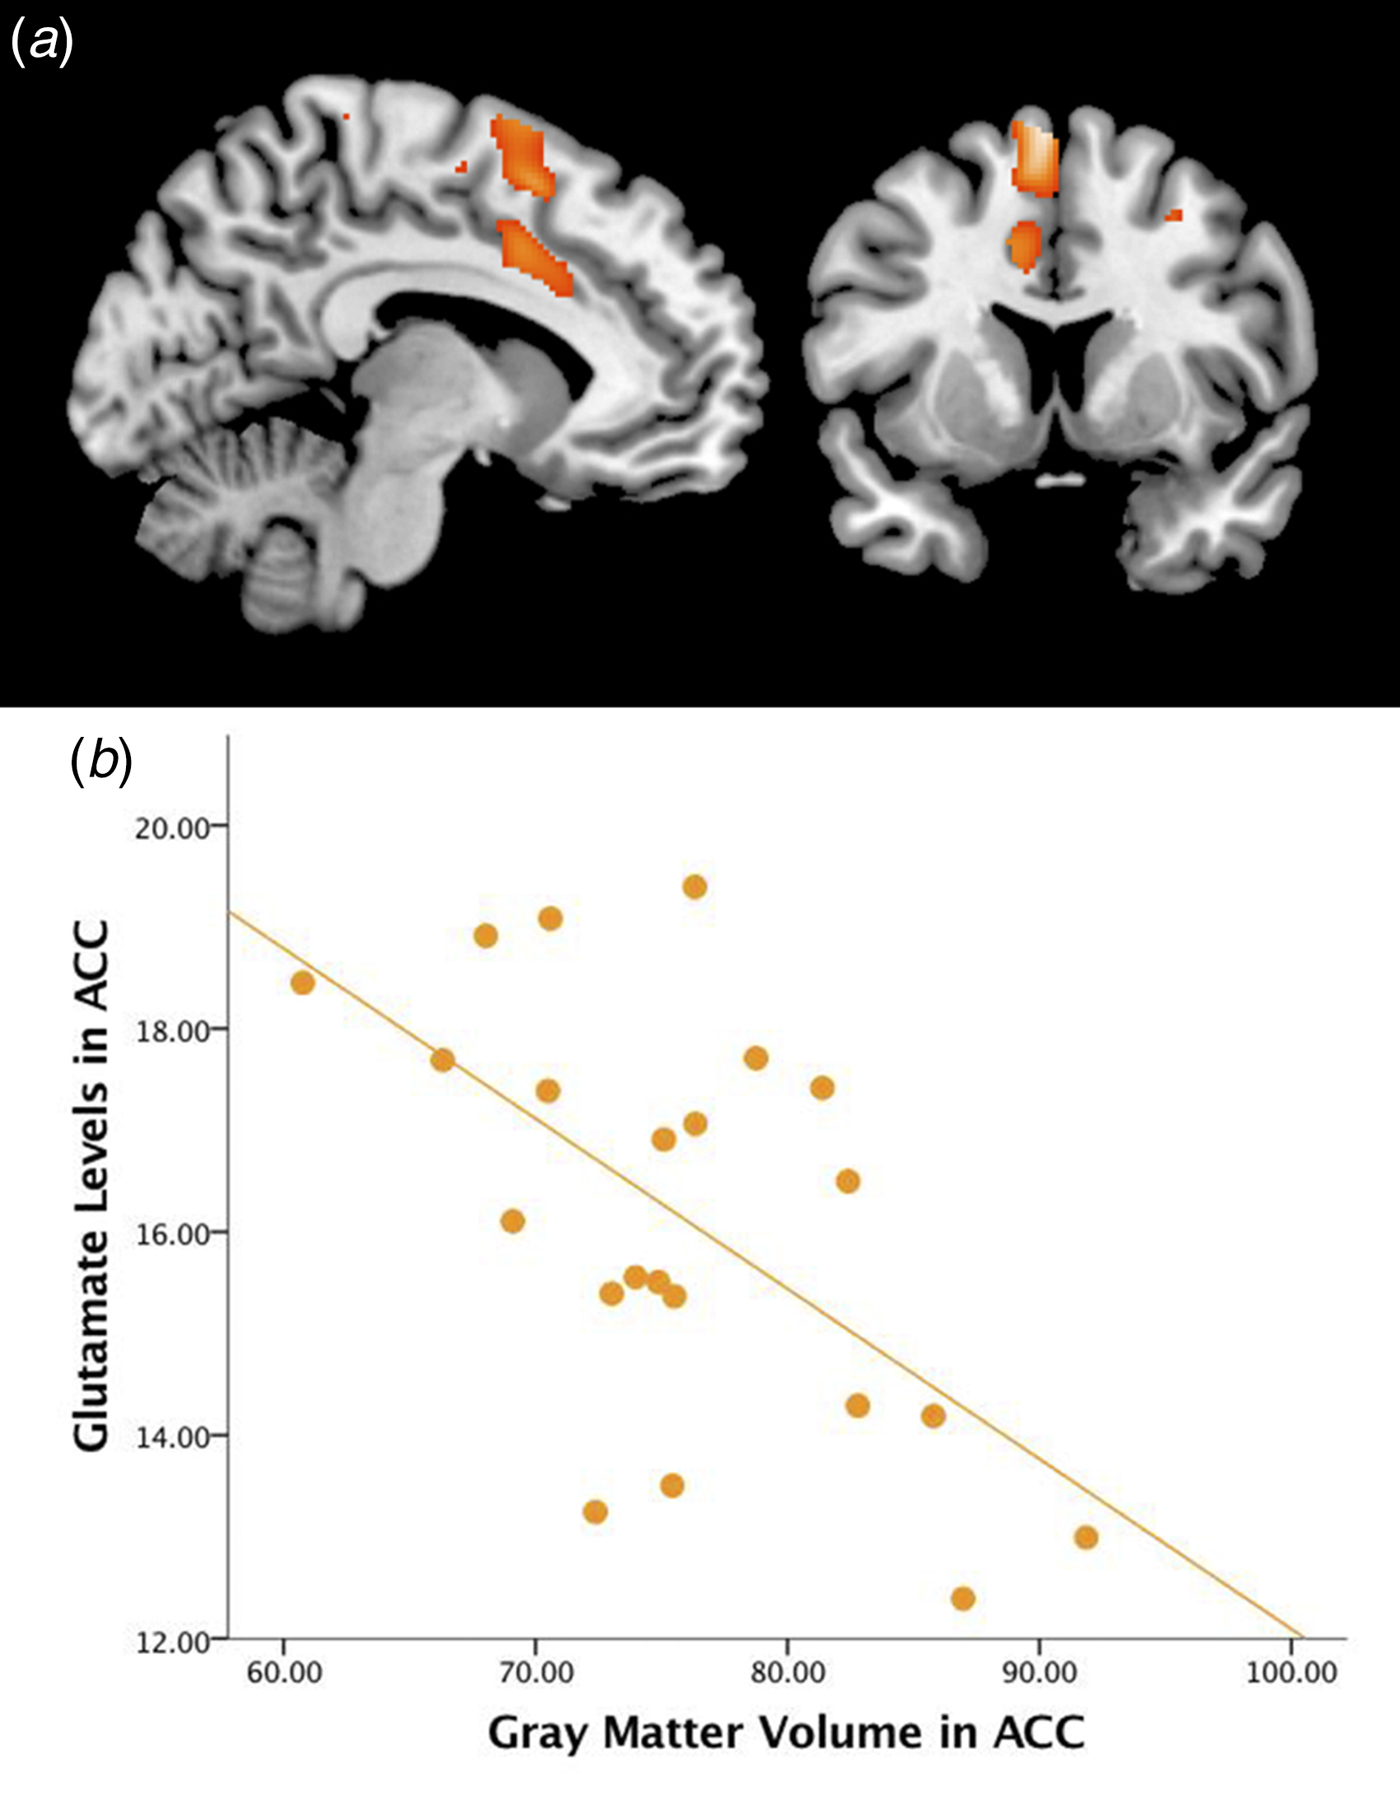
Figure 3 shows the relationship between glutamate levels and GM volume. In HS subjects, ROI analysis showed that ACC glutamate levels were negatively associated with local GM volume in the ACC. In the ACC, the higher the ACC glutamate, the smaller the volume of GM (peak coordinate at x, y, z = −9, 9, 40; T = 3.28; Z = 3.07; p FWE = 0.026) (Fig. 3). In terms of positive associations, no regions survived correction for multiple comparisons in HS. There were no significant correlations in LS subjects in either directionality. Groups did not differ in age or illicit drug/alcohol use, and the results of the ACC glutamate–GM volume association did not change when age or illicit drug/alcohol use were added to the model. No effects survived voxel-wise FWE correction at the whole-brain level.
(a) Section overlay of the negative correlation between glutamate levels and gray matter volume in the anterior cingulate cortex (ACC) in high schizotypy subjects. Effects were considered significant at voxel-wise p < 0.05 FWE correction; statistical parametric maps are shown at p < 0.005 uncorrected for display purposes. (b) Plot depicting the negative correlation between glutamate levels and gray matter volume in the ACC.

A secondary analysis examining associations with levels of Glx showed a trend toward a negative association with GM volume in the ACC in HS individuals (peak coordinate at x, y, z = −10, 8, 39; T = 2.96; Z = 2.79 p FWE = 0.051).
Discussion
The main aim of this study was to investigate whether glutamate levels are associated with gray matter volume in healthy individuals with HS, similar to the patterns observed in people at UHR of psychosis. Although glutamate concentrations did not significantly differ between individuals with HS and LS, as we have recently reported in an overlapping dataset (Modinos et al. Reference Modinos, McLaughlin, Egerton, McMullen, Kumari, Barker, Keysers and Williams2017), glutamate levels in HS subjects were negatively associated with GM volume in the ACC. This association was absent in the LS group. The findings are not attributable to effects of antipsychotics as all subjects were medication-naïve, and groups were matched for demographics, cognition, and substance use; the only significant differences between groups referred to the presence of subclinical psychotic-like experiences. This is consistent with evidence that levels of glutamate are negatively correlated with local GM volume in antipsychotic-naïve patients with first-episode psychosis (Kraguljac et al. Reference Kraguljac, White, Reid and Lahti2013; Plitman et al. Reference Plitman, Patel, Chung, Pipitone, Chavez, Reyes-Madrigal, Gomez-Cruz, Leon-Ortiz, Chakravarty, de la Fuente-Sandoval and Graff-Guerrero2016). Our study extends those previous findings in caudate and hippocampus by showing the same relationship in the ACC. Nevertheless, glutamate levels may also impact on more widespread structural changes, as reported in subjects at UHR of psychosis (Stone et al. Reference Stone, Day, Tsagaraki, Valli, McLean, Lythgoe, O'Gorman, Barker and McGuire2009) and patients with first-episode psychosis (Theberge et al. Reference Theberge, Williamson, Aoyama, Drost, Manchanda, Malla, Northcott, Menon, Neufeld, Rajakumar, Pavlosky, Densmore, Schaefer and Williamson2007). Regardless of potentially disease-stage-specific findings, our study suggests that ACC glutamate concentrations are related to volumetric changes in schizotypal individuals. Noteworthy, we recently reported that ACC glutamate concentrations were negatively correlated with neural response to emotion in brain regions robustly involved in the pathophysiology of psychosis (striatum and marginally in medial prefrontal cortex and amygdala) in schizotypy (Modinos et al. Reference Modinos, McLaughlin, Egerton, McMullen, Kumari, Barker, Keysers and Williams2017). Our results suggest that ACC glutamate levels are related to increased local GM volume as well as to increased corticolimbic response to emotion in HS. Such relationships in HS provide some support to preclinical models postulating that altered prefrontal–temporal–-striatal interactions in relation to psychotic-like behaviors are associated with changes in cortical glutamatergic function (Berretta et al. Reference Berretta, Munno and Benes2001; Lodge & Grace, Reference Lodge and Grace2011). As the normal function of this circuit depends on a proper excitation–inhibition balance, and given that the properties of this circuit appear to change during adolescence in preclinical models (Gomes et al. Reference Gomes, Rincon-Cortes and Grace2016), our data provide some additional support for a ‘staged’ approach to the understanding of the pathophysiology of schizophrenia-like symptoms and behaviors (Deutsch et al. Reference Deutsch, Rosse, Schwartz and Mastropaolo2001). Collectively, these findings are in line with a psychosis continuum view by suggesting that interactions between brain structure and neurochemistry are involved in the expression of psychotic-like experiences at non-clinical and clinical degrees. These findings may also serve as evidence of potentially protective mechanisms, as this study involved high-functioning individuals with HS and considering that, while the association between ACC glutamate and GM volume was negative in HS, the group effect showed increased volume in this region compared with LS subjects. These results are opposite to the prediction from studies in clinical groups that HS would be associated with higher glutamate and reduced volume in that region. Further research examining the relative contributions of excitation and inhibition to GM volume in different groups (schizophrenia, UHR, HS) and combining measurement of GABA and glutamate levels, may provide substantial insights into the neurobiology of risk and resilience for psychiatric disorders (Pantelis & Bartholomeusz, Reference Pantelis and Bartholomeusz2014).
The present study replicated our previous finding of larger regional GM volumes in the posterior cortical midline (Modinos et al. Reference Modinos, Mechelli, Ormel, Groenewold, Aleman and McGuire2010) in a separate cohort of HS individuals. We again report that people with HS had increased volume of the precuneus relative to comparison subjects with low levels of schizotypy, an area involved in self-awareness and self-evaluation and which is a core component of the default-mode network (Cavanna & Trimble, Reference Cavanna and Trimble2006; Utevsky et al. Reference Utevsky, Smith and Huettel2014). Furthermore, larger precuneus volumes were significantly related to both higher levels of schizotypy as well as to lower social functioning in the HS sample, providing a link between these neuroanatomical findings and psychosis-related behaviors. A similar finding was reported by another study showing a positive association between precuneus volume and schizotypy scores (Nenadic et al. Reference Nenadic, Lorenz, Langbein, Dietzek, Smesny, Schonfeld, Fananas, Sauer and Gaser2015). In contrast, GM decreases as opposed to increases in this region were found by other groups in people at UHR of psychosis (Borgwardt et al. Reference Borgwardt, Riecher-Rossler, Dazzan, Chitnis, Aston, Drewe, Gschwandtner, Haller, Pfluger, Rechsteiner, D'Souza, Stieglitz, Radu and McGuire2007b) and patients with a first episode of psychosis (Theberge et al. Reference Theberge, Williamson, Aoyama, Drost, Manchanda, Malla, Northcott, Menon, Neufeld, Rajakumar, Pavlosky, Densmore, Schaefer and Williamson2007). Although these findings, taken together, may suggest that volumetric changes in the precuneus are present along the psychosis continuum, the discrepancies in directionality indicate that structural characteristics of this region may vary based on the degree of psychosis risk (larger volumes in healthy people with schizotypy, at low risk) and expression (smaller volumes in people at higher risk or clinically ill). The functional significance of larger precuneus volumes associated with schizotypal traits, in particular, remains to be determined. One possibility is that such larger volumes, while associated with some of the subclinical features of psychosis, may offer resilience to the development of a clinical diagnosis. While the mechanisms are unclear, one speculative interpretation is that this may relate to the variables such as creativity and spirituality, on which people with schizotypal traits score higher on average. Indeed, creativity has been associated with larger precuneus volume and thickness (Chen et al. Reference Chen, Xu, Yang, Li, Sun, Wang, Beaty, Zhang, Zuo and Qiu2015) and spirituality had also been associated with larger precuneus volume (Miller et al. Reference Miller, Bansal, Wickramaratne, Hao, Tenke, Weissman and Peterson2014). Higher levels of spirituality and greater precuneus volumes may confer resilience to developing depression (Miller et al. Reference Miller, Bansal, Wickramaratne, Hao, Tenke, Weissman and Peterson2014), and it is possible that larger volumes may also confer resilience to developing psychosis. A further explanation may be that these neuroanatomical changes reflect plastic adaptation to a genetic- or environment-related liability for psychiatric outcomes, and enable psychiatrically resilient high schizotypes to effectively compensate, in line with recent postulations about the effects of early life stress on brain (Teicher et al. Reference Teicher, Samson, Anderson and Ohashi2016). The possibility that such larger volumes may offer resilience to the development of clinical psychosis, and the relationship with stress, deserves further investigation.
Further group effects in our study involved GM volume increases in anterior cingulate gyrus and decreases in superior temporal cortex. Volumetric decreases in superior temporal cortex areas have been extensively associated with schizophrenia (Honea et al. Reference Honea, Crow, Passingham and Mackay2005; Radua et al. Reference Radua, Borgwardt, Crescini, Mataix-Cols, Meyer-Lindenberg, McGuire and Fusar-Poli2012), individuals at UHR of psychosis (Borgwardt et al. Reference Borgwardt, McGuire, Fusar-Poli, Radue and Riecher-Rossler2008; Fusar-Poli et al. Reference Fusar-Poli, Borgwardt, Crescini, Deste, Kempton, Lawrie, Mc Guire and Sacchetti2011), and HS (Ettinger et al. Reference Ettinger, Williams, Meisenzahl, Moller, Kumari and Koutsouleris2012). In the anterior cingulate gyrus, however, our study highlights an additional discrepancy as previous studies had mainly reported volumetric decreases. Increases in GM volume have been suggested to occur in the initial stages of apoptosis (Adler et al. Reference Adler, Levine, DelBello and Strakowski2005), a process in which glutamatergic dysfunction is thought to be involved, so one possibility is that volumetric changes across the psychosis spectrum are dynamic, and that volumetric reductions occur at a later stage when a glutamatergic alteration is identifiable. However, no studies have examined the relationship between such structural findings and metabolite measures in relation to subclinical psychotic-like experiences, and our study suggests a direct link between them in the ACC.
There are some limitations to the present study. Firstly, subjects were recruited from a university sample, had relatively high IQs, and groups showed no differences in self-reported substance use; therefore, our results may not generalize to all individuals with schizotypy. Larger studies in general population samples would help define the normal variation in schizotypy. Secondly, several theories exist about the schizotypy construct and a range of assessment instruments have been developed; the present investigation used the O-LIFE questionnaire, which follows a personality-based model of schizotypy, and therefore should be interpreted to report on neurobiological correlates of schizotypal traits as understood from a dimensional rather than a clinical perspective. Thirdly, schizotypy is regarded as a multidimensional construct (Mason & Claridge, Reference Mason and Claridge2006; Nelson et al. Reference Nelson, Seal, Pantelis and Phillips2013). While the HS group was formed based on high UE scores, thus reflecting high positive schizotypy, groups also differed in the CD and IA subscales; this might have contributed to the present results and future studies should seek to explicitly explore the other schizotypy dimensions. Furthermore, this cross-sectional study does not allow evaluation of whether the observed GM changes are driven by HS subjects who may later develop a mental health disorder (Cannon et al. Reference Cannon, Chung, He, Sun, Jacobson, van Erp, McEwen, Addington, Bearden, Cadenhead, Cornblatt, Mathalon, McGlashan, Perkins, Jeffries, Seidman, Tsuang, Walker, Woods and Heinssen2015). With regards to MRS methodology, 1H-MRS measurements of glutamate and glutamine reflect the combined intra- and extra-neuronal metabolite concentration, and using our approach of PRESS with a TE of 30 ms at 3 Tesla, the partially overlapping signals from glutamate and glutamine cannot be entirely resolved, with contamination of the Glu signal by Gln estimated as <10% (Snyder & Wilman, Reference Snyder and Wilman2010). Of note, groups did not differ significantly in either glutamine or Glx. This aligns with recent results showing that chronicity of psychotic symptoms is associated with decreased levels of Glx in a study comparing chronic schizophrenia patients, patients with recent-onset psychotic disorder, and UHR individuals (Liemburg et al. Reference Liemburg, Sibeijn-Kuiper, Bais, Pijnenborg, Knegtering, van der Velde, Opmeer, de Vos, Dlabac-De Lange, Wunderink and Aleman2016) and suggests that detectable 1H-MRS differences in non-clinical groups may be very subtle. We cannot rule out the possibility that the lack of significant differences in the standalone 1H-MRS measures are related to limited power in this non-clinical sample and this will need to be replicated by independent studies of larger samples. Finally, we employed a self-report of use of drugs of abuse but future studies should consider adding a drug screening test prior to scanning.
The present study suggests that gray matter volume changes in cortical midline areas are associated with glutamate levels in subjects with HS, with such findings not being dependent on disease chronicity or the confounding influence of antipsychotic medication. Given that our sample consisted of high-functioning schizotypes, these results may also indicate potential neurobiological mechanisms of resilience. Future longitudinal studies testing this model comprehensively, including serial structural imaging scans in the same individuals in combination with GABAergic, glutamatergic and dopaminergic neurotransmission, will be fundamental to understanding the mechanisms underlying the development of schizophrenia, and may provide a scientific basis for the development of novel interventions including facilitation of NMDA receptor-mediated neurotransmission to prevent or delay progression to psychosis in vulnerable individuals.
Acknowledgements
This work was supported by a Brain and Behavior Research Foundation NARSAD Young Investigator Grant to GM (#21200, Lieber Investigator) and partly by a Medical Research Council grant to AE (MR/L003988/1). G.M. is funded by a Sir Henry Dale Fellowship jointly funded by the Wellcome Trust and the Royal Society (#202397/Z/16/Z). The authors wish to thank the National Institute for Health Research (NIHR) Biomedical Research Centre at South London and Maudsley NHS Foundation Trust and KCL for their on-going support of our neuroimaging research, and gratefully acknowledge the MRI radiographers for their expert assistance in this work. The authors also thank Meghan O'Sullivan for her help with subject recruitment and scanning, and the study participants.
Conflict of interest
GJB received honoraria for teaching from General Electric Healthcare, and acted as a consultant for IXICO, at the time of this study. The other authors declare no competing financial interests.