Introduction
Continuous technological progress in the area of wireless communications and radar applications is putting higher and higher requirements on the performances of microwave power amplifiers, such as efficiency and output power level close to transistor's peak power as well as linearity for wideband signals with non-constant envelope waveforms. There is a variety of commonly used methods to improve the mentioned parameters independently or simultaneously. The efficiency and output power can be directly optimized during amplifier design mostly with the following concepts: switching mode amplifiers (class E), class F amplifiers, and Doherty's amplifiers [Reference Grebennikov, Sokal and Franco1–Reference Cripps3]. While the correction of amplifier linearity requires additional external circuits or/and special treatment of the input signal, e.g. analog feedforward, digital predistortion [Reference Katz, Wood and Chokola4], dynamic biasing [Reference Pelaz, Collantes, Otegi, Anakabe and Collins5], envelope tracking [Reference Kim, Kim, Kim, Son, Cho, Kim and Park6], or Chireix's outphasing method [Reference Chireix7]. Nowadays, harmonic tuned (HT) amplifiers are becoming more and more popular [Reference Ma, Liu, Pan and Tang8–Reference Li, Helaoui and Du11]. Proper harmonic terminations may lead to significant improvements in output power, efficiency, gain, or linearity [Reference Colantonio, Giannini and Limiti12–Reference Colantonio, Giannini, Limiti, Nanni, Camarchia, Teppati and Pirola14]. The first part of this paper presents the use of HT method in GaN HEMT amplifier design. To demonstrate the capability of that method, a CGH40010 Wolfspeed transistor [15] was chosen. The second part of our paper concerns the accuracy analysis of amplifier design based on available models of the transistor and the passive components.
Amplifier initial design
A large-signal model of CGH40010F GaN HEMT provided by the manufacturer [15] has been applied to design an amplifier using Advanced Design System (ADS) simulator. As shown in Fig. 1 the circuit schematic used for initial design includes two terminals. The input one enables the RF power level to be adjusted. The terminal loads were supplemented by additional components that allowed setting various impedances at harmonic frequencies independently. The amplifier circuit contained also a DC block and DC feed components, so that proper biasing conditions could be set.
A circuit schematic to perform initial harmonic-tuned simulation.

In order not to make the design too complicated, only the second and third harmonics were considered. Higher order impedances were zeroed. In the first step, the source and the load impedances at fundamental frequency were only tuned to obtain a good trade-off between high output power and high efficiency. Then the impedances at the second and the third harmonics were modified. Finally, all the impedances were optimized to achieve the goal of maximum output power (about 17 W in simulation). Due to practical reasons, real parts of the impedances at harmonic frequencies were set to zero.
Amplifier design
The impedances obtained in the previous step were used to synthesize the input and output microstrip networks that exhibit the required values at the transistor ports. The amplifier was fabricated on the RT/Duroid 6010 laminate of 1.27 mm-thick and dielectric constant ε r = 10.2.
To properly terminate the harmonics, quarter wavelength open stubs were used. The stubs act as a short at appropriate frequencies. The stubs were shifted away from the transistor, so that required impedance was reached. An additional part of the circuit ensured proper loading at the fundamental frequency and allowed DC feeding. Some lossy elements were also inserted into the input matching network (IMN) to provide unconditional stability of the amplifier (The Rollett's stability factor k is higher than 1 in the entire frequency range).
Good termination of the harmonic frequencies realized with the aid of the stubs ensures that any change of the impedance at the circuit's ports (at these frequencies) will not affect the impedances loading the transistor at the dominant frequency. It is especially important, e.g. when the amplifier is tuned in a test setup where broadband power meter is used as a load and then the amplifier is placed, e.g. into a transmitter with narrowband circulator or power combiner at the output. In such a situation, impedances seen by the transistor at harmonic frequencies are, in general, different from those seen with the broadband-matched load. Thus, the operation conditions of the transistor might be different if harmonics were not appropriately terminated by the stubs.
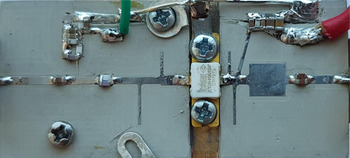
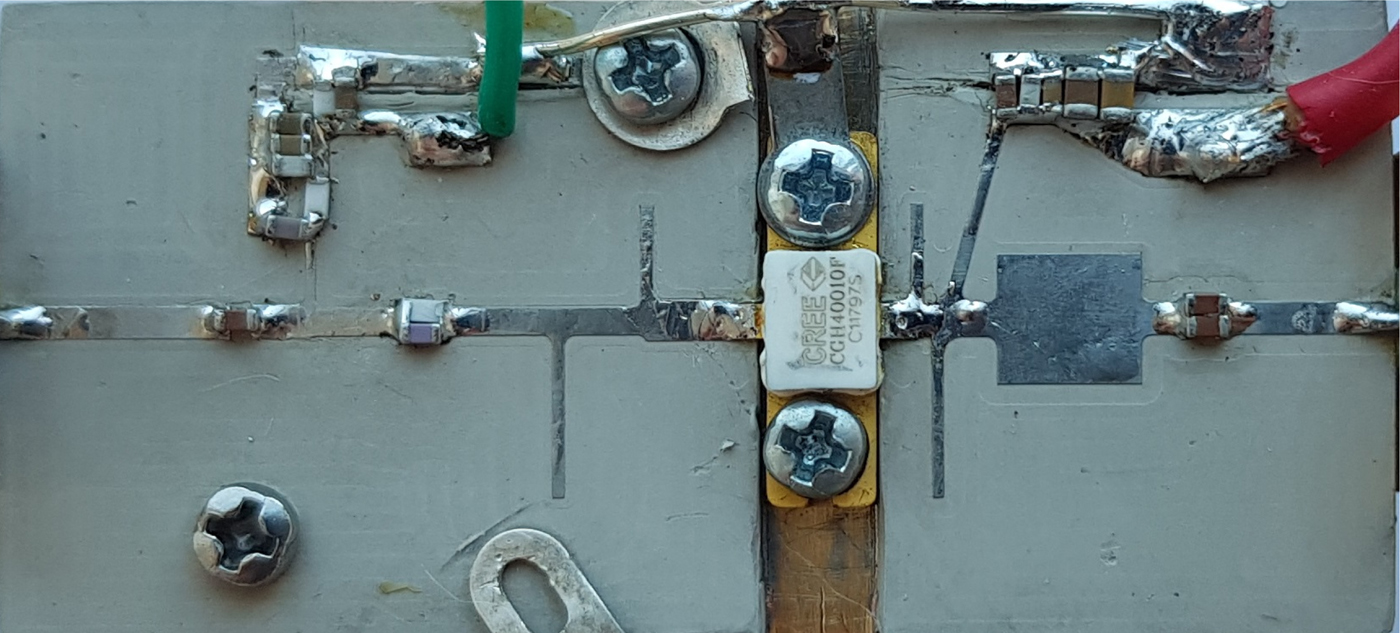
The amplifier was prototyped with LPKF S103 milling machine. A photography of the fabricated amplifier is shown in Fig. 2.
Photography of the fabricated amplifier.
Measurements
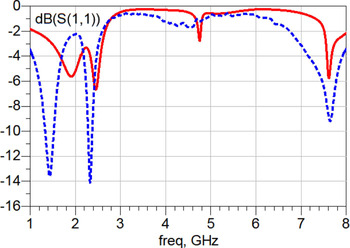
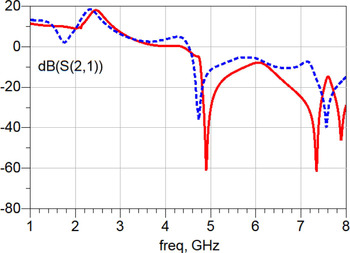
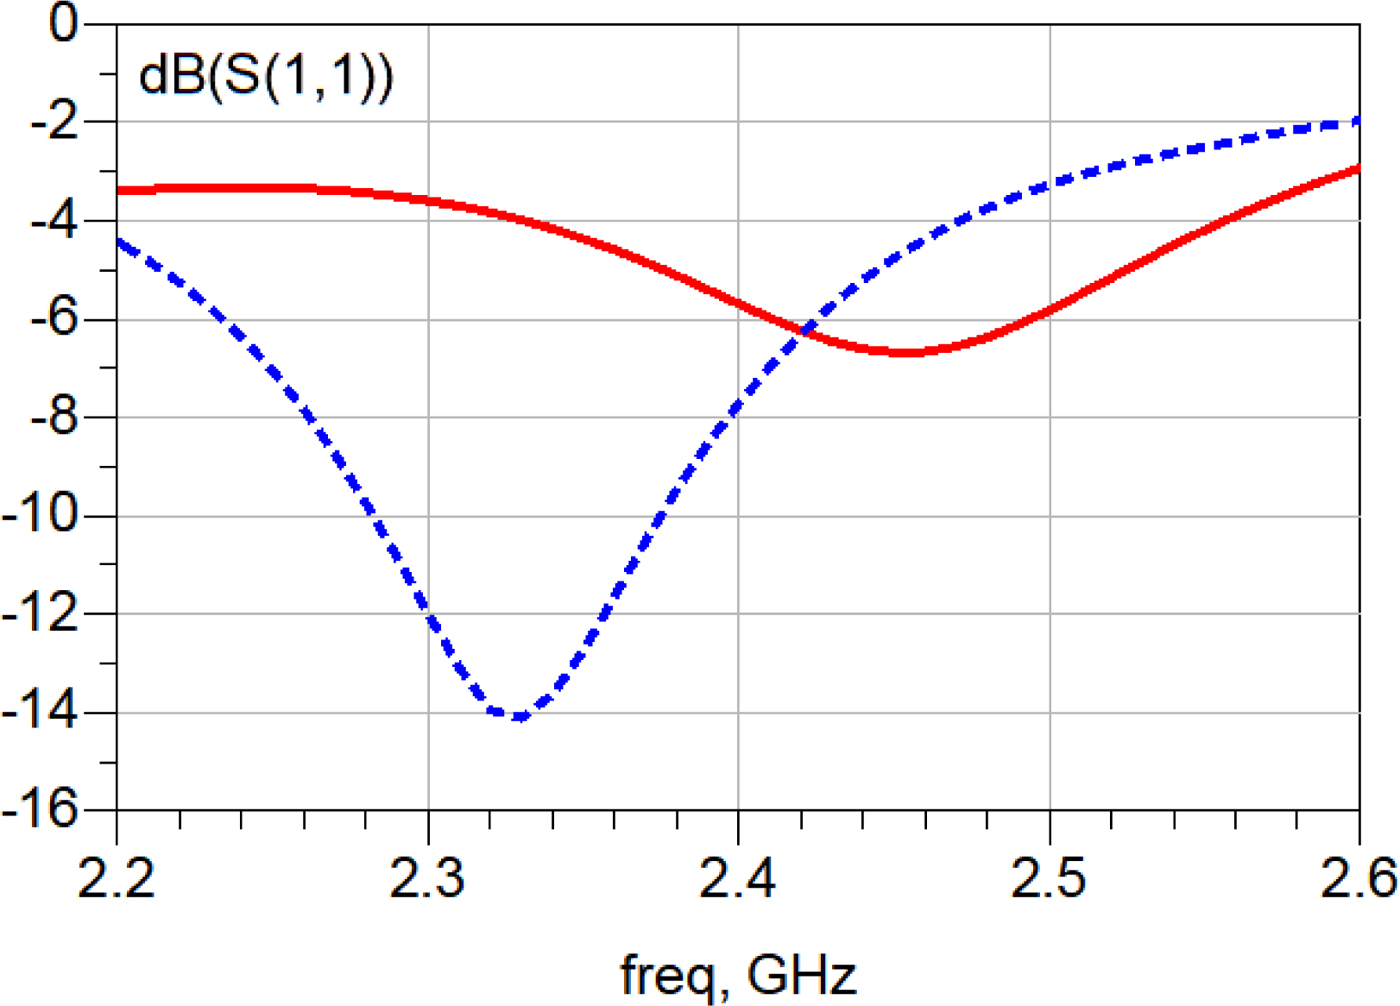
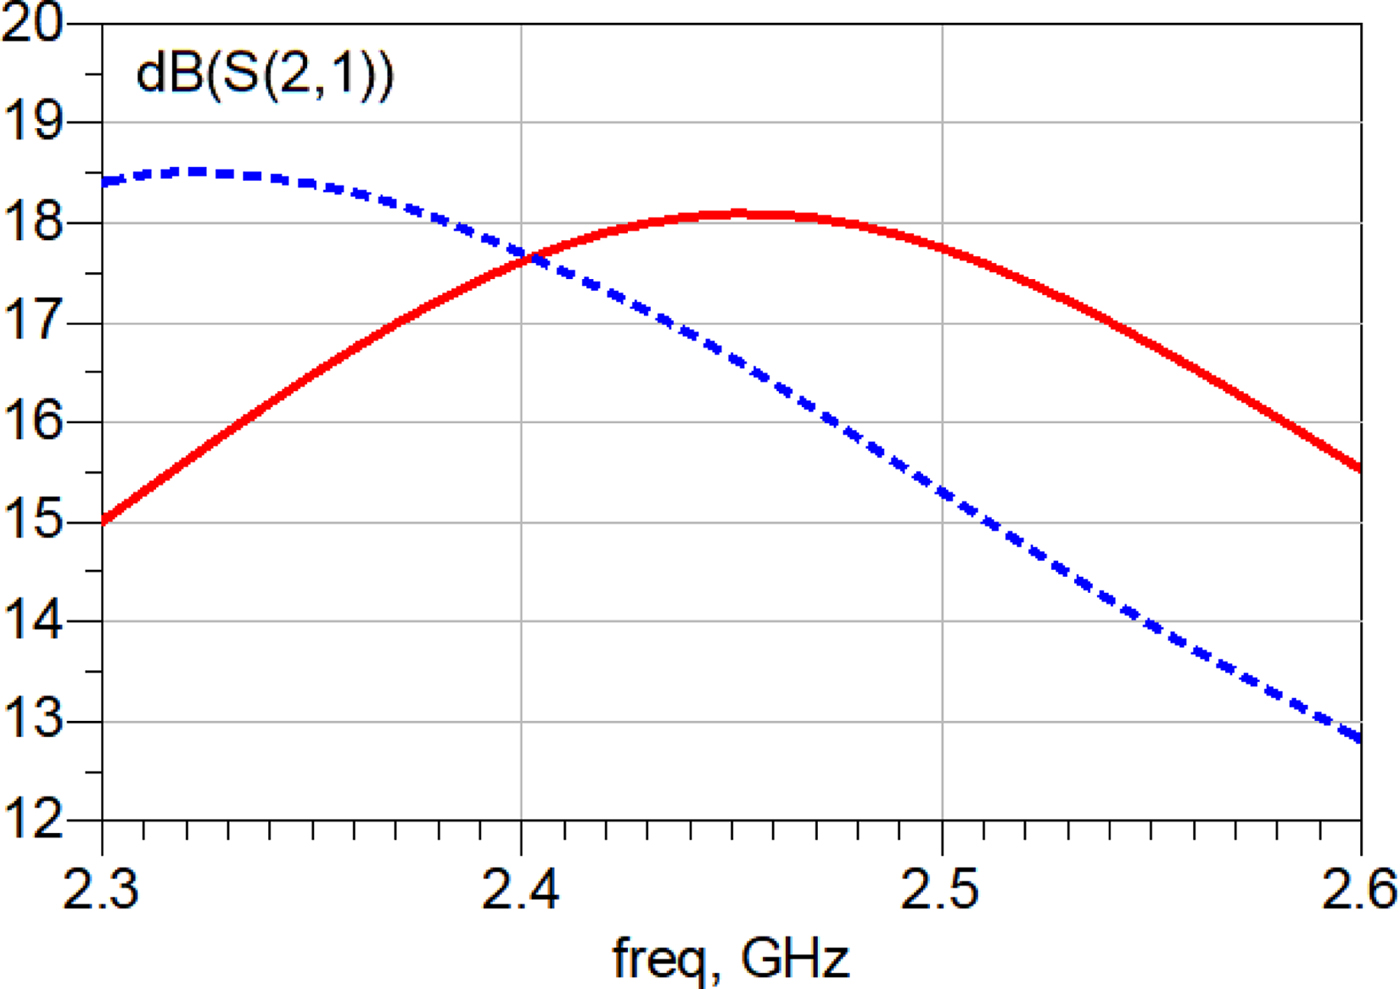
The small-signal measurements of input return loss and gain of the amplifier were performed with Agilent N5230 vector network analyzer from 1 to 8 GHz frequency range. The simulated and measured small-signal parameters such as return loss and gain as a function of frequency are presented in Figs 3 and 4, respectively. It is observable that the fabricated amplifier band is shifted toward lower frequencies.
Measured (dotted line) and simulated (solid line) input return loss of the amplifier (U DS = 28 V, I DQ = 420 mA).

Measured (dotted line) and simulated (solid line) gain of the amplifier (U DS = 28 V, I DQ = 420 mA).

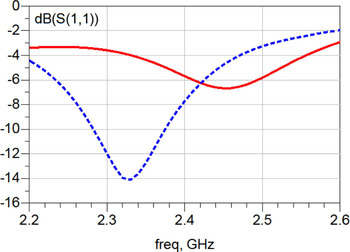
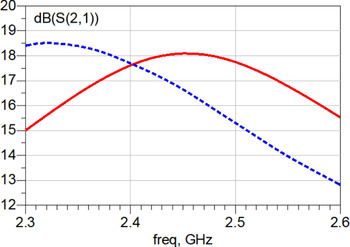
Zoom of the input return loss and gain plots close to the fundamental frequency are presented in Figs 5 and 6, respectively.
Measured (dotted line) and simulated (solid line) input return loss of the amplifier (U DS = 28 V, I DQ = 420 mA).
Measured (dotted line) and simulated (solid line) gain of the amplifier (U DS = 28 V, I DQ = 420 mA).
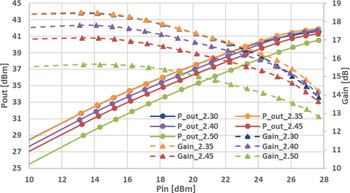
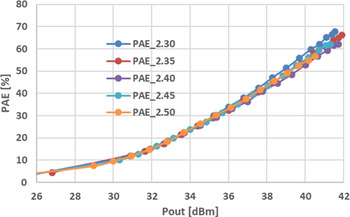
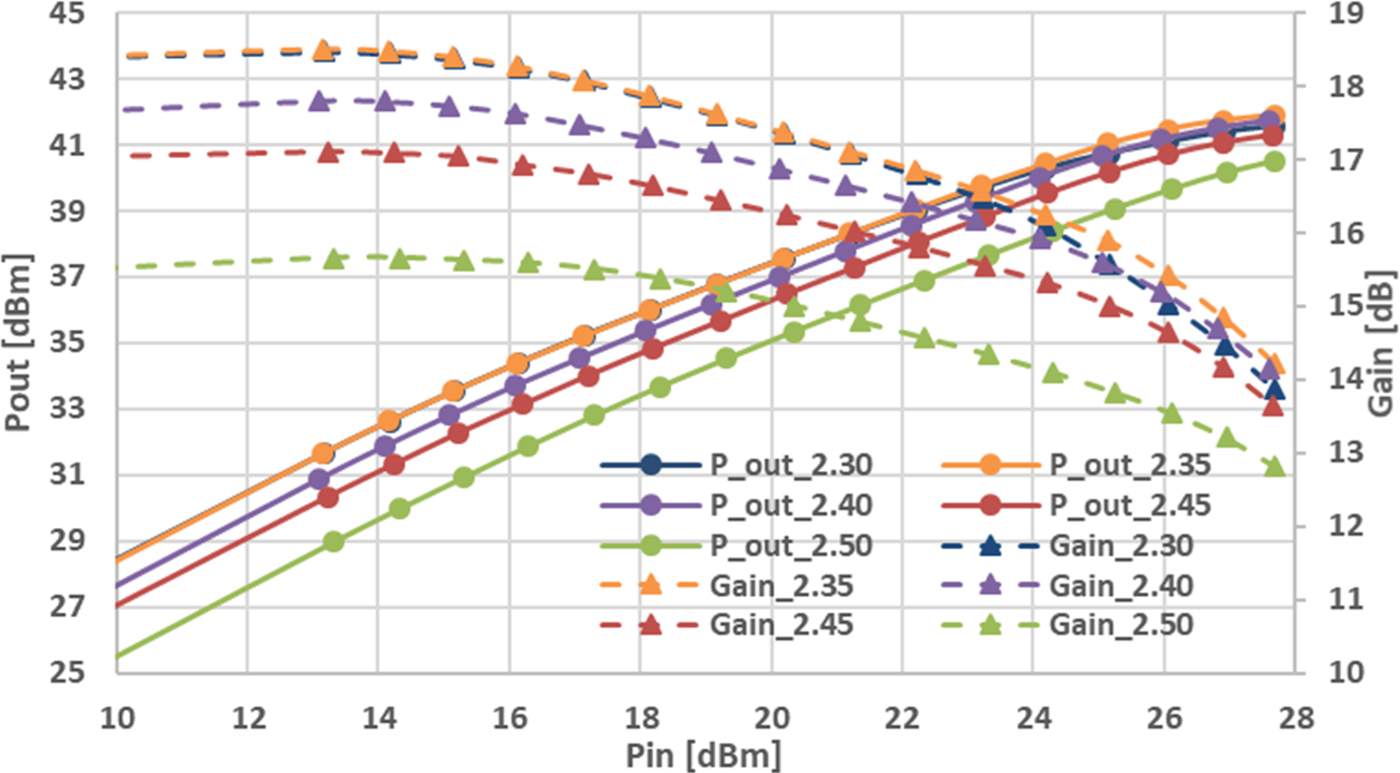
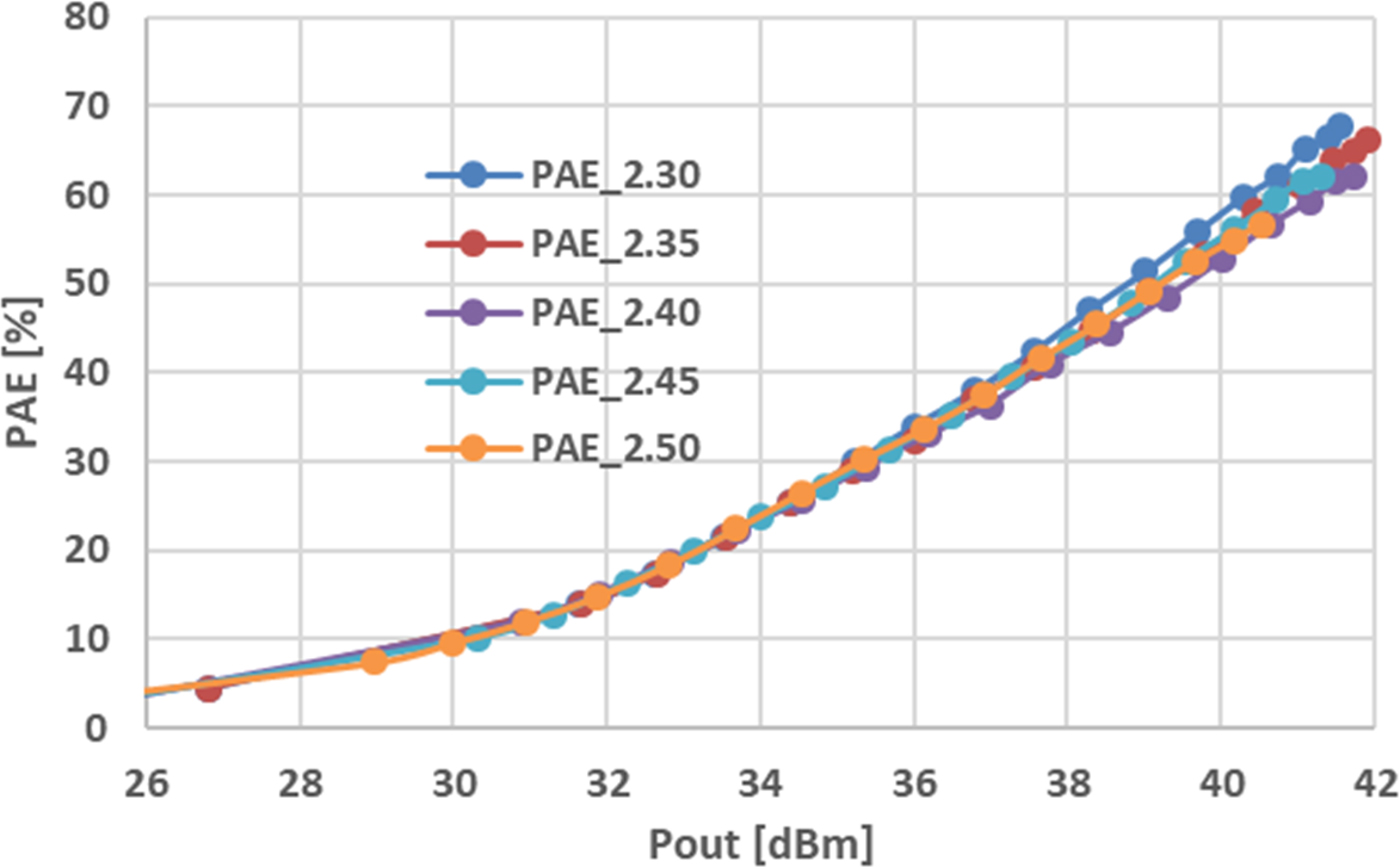
Measured gain, output power, and power added efficiency (PAE) of the amplifier are shown in Figs 7 and 8. The highest output power of 15.5 W was measured at 2.35 GHz and the highest PAE of 67.9% was achieved at 2.30 GHz. That confirms that the amplifier band is shifted toward lower frequencies. Simulated amplifier achieved 15.7 W output power and 78% PAE at 2.45 GHz.
Measured gain and output power P out of the amplifier as a function of the input power P in from 2.3 to 2.5 GHz frequency range at U DS = 28Vand I DQ = 420 mA.
Measured PAE of the amplifier versus the output power (U DS = 28 V, I DQ = 420 mA).
Accuracy analysis of amplifier design
To find out the source of the observed differences, the IMN, transistor itself, and output matching network (OMN) were measured separately. To measure the matching networks in the transistor's plane, a semi-rigid cable and port extension function of the VNA were used. Due to the limits of the external biasing circuits inside VNA, the transistor was only measured for I DQ = 200 mA. Three types of configuration for measurements and transistor model were considered, as depicted in Fig. 9.
Schematics of the structures used for model-measurement comparison.

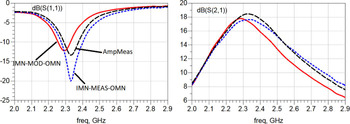
Figure 10 shows the input return loss and gain versus frequency of the following devices:
(a) measured amplifier (AmpMeas, Fig. 9(a)),
(b) amplifier simulated as a chain connection of measured two ports: IMN, transistor, OMN (IMN-MEAS-OMN, Fig. 9(b)),
(c) simulated amplifier consisted of measured IMN, transistor model, and measured OMN (IMN-MOD-OMN, Fig. 9(c)).
The input return loss and gain of the structures depicted in Fig. 9. (a) AmpMeas – black dashed line, (b) IMN-MEAS-OMN – dotted line, (c) IMN-MOD-OMN – solid line, (U DS = 28 V, I DQ = 200 mA).
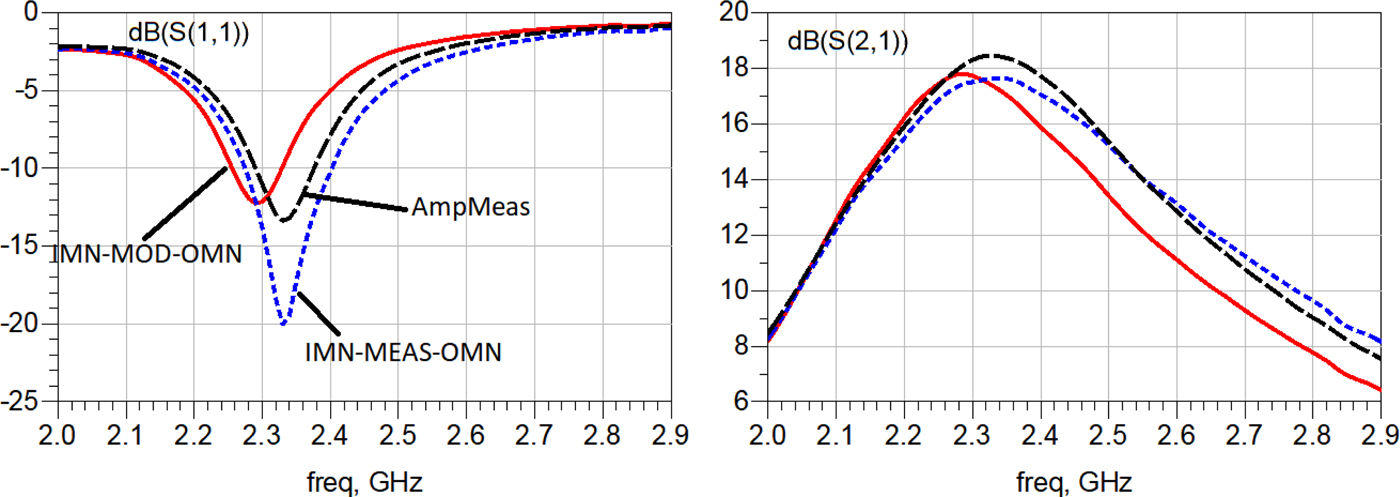
It is observable that the direct measurements of the amplifier (AmpMeas) and a connection of three elements measured separately (IMN-MEAS-OMN) are consistent with each other to the extent of possible measurement inadequacies. In the case where the transistor measurements are replaced with the transistor model (IMN-MOD-OMN), the small-signal characteristics are shifted toward lower frequencies.
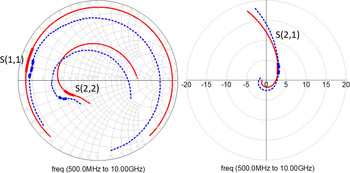
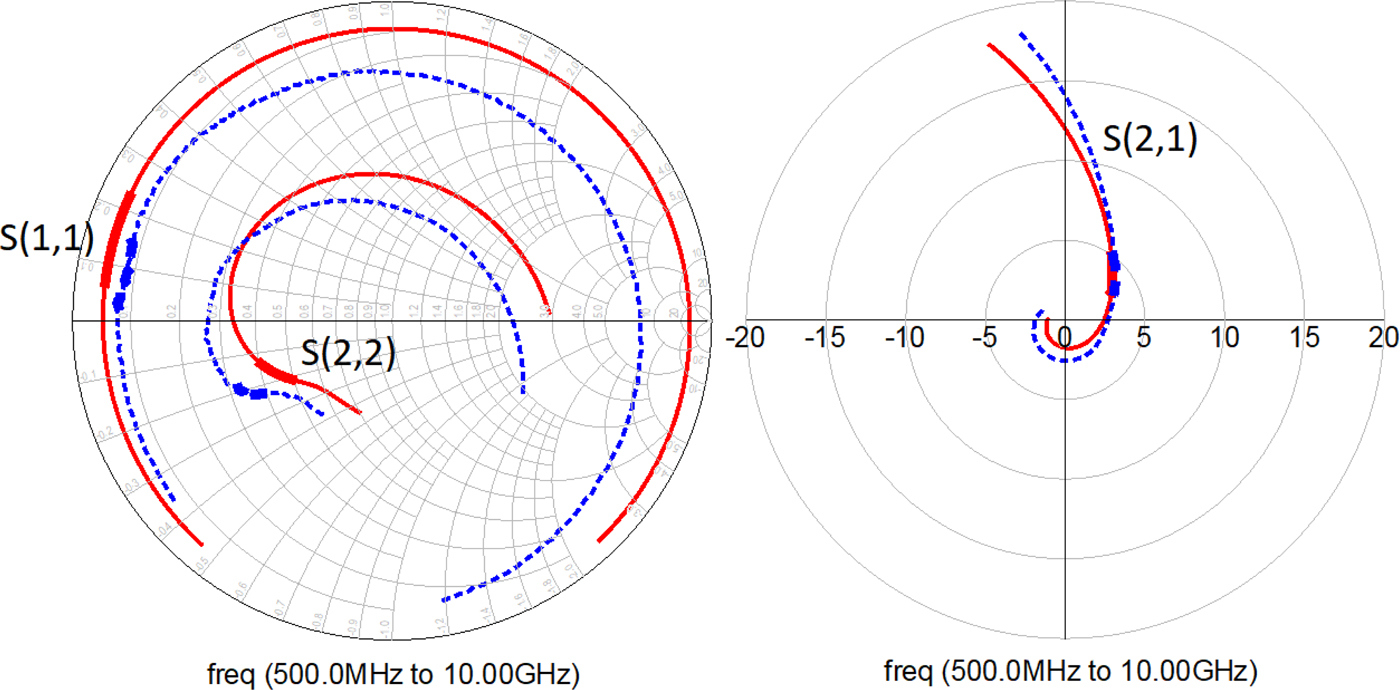
The S-parameters of the measured transistor and its model provided by the manufacturer are compared in Fig. 11. The gain graphs overlap at the frequencies close to f 0 = 2.45 GHz, but the input and output reflection coefficients do not. The measurements were performed using a TRL calibration of VNA.
The S-parameters of the measured transistor (dotted line) and of its model (solid line) (U DS = 28 V, I DQ = 200 mA), bolded lines denote 2–3 GHz frequency range.
For further investigation, a few more transistors were measured to check repeatability. Five of them were from the same batch of the product and one was from another. The gains of measured transistors connected with the measured IMN and OMN (IMN-MEAS-OMN) are compared in Fig. 12. A good agreement is observable between the transistors from the same batch.
The gain versus frequency of the measured amplifier (red) and chain connection of the measured IMN-MEAS-OMN with different transistors (U DS = 28 V, I DQ = 100 mA).
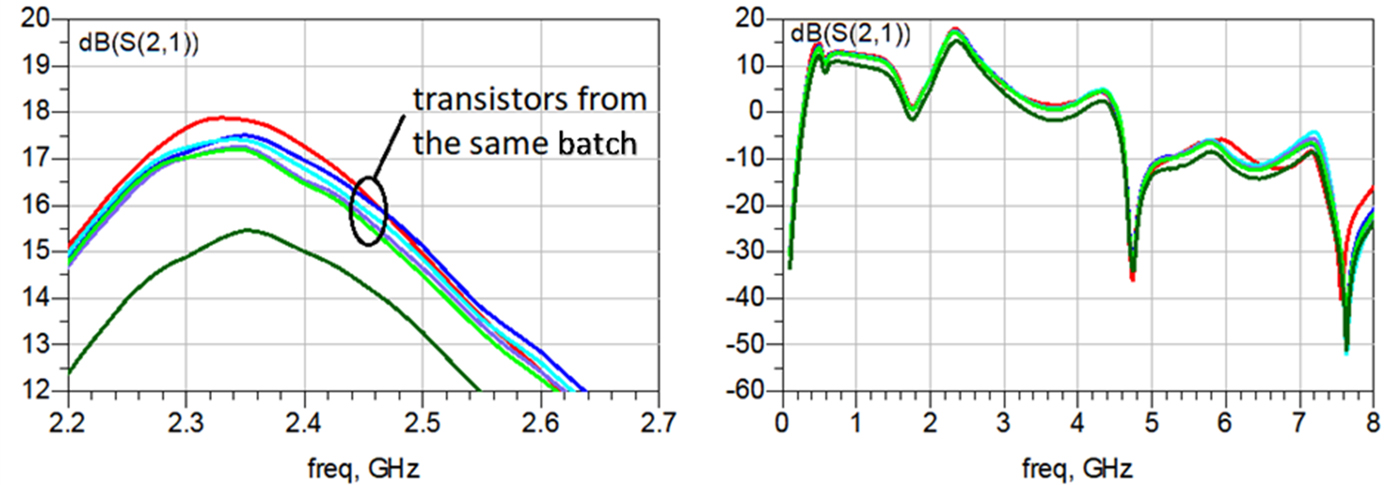
DC gate-to-source voltages (U GS) of the measured transistors for the same drain current I D are given in Table 1. Transistor denoted as no. 2 comes from another batch and it exhibits a significantly different gate-to-source voltage. Moreover, differences among the transistors from the same batch are also visible (up to 0.18 V). For this reason, the use of such transistors may be troublesome in higher volume production.
Gate-to-source voltage U GS of measured transistors for drain current I D = 100 mA and drain-to-source voltage U DS = 28 V

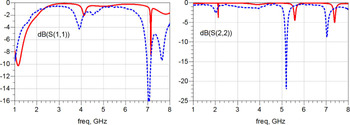
Measured and simulated return loss of the IMN and OMN with an open circuit at the transistor plane is shown in Fig. 13. A significant shift toward lower frequencies is visible. Moreover, the higher the frequency, the bigger is the shift. An analysis has shown that to fit the simulations to the measurements, it is required to extend the lines near both the gate and drain pads by about 0.5 mm and to increase the relative permittivity of the substrate. The value of the permittivity used in the initial design was ε r = 10.2. Hence it is worth noting that ADS models of some microstrip circuits may not be accurate enough especially for high dielectric constant substrates. This fact was confirmed by a simple experiment. Namely, a microstrip T-junction with quarter-wave short stub on RT/Duroid 6010 (ε r = 10.2, h = 1.27 mm) substrate was simulated by means of ADS using both circuit models (MTEE, MLSC) and EM simulation (Microwave Momentum). The ADS simulation results have been shown that a return loss characteristic was shifted c.a. 100 MHz toward lower frequencies in the case of circuit modeling compared to the EM analysis at 2.5 GHz reference frequency.
Measured (dotted line) and simulated (solid line) return loss of the IMN (S 11) and of the OMN (S 22) with an open circuit at transistor plane.
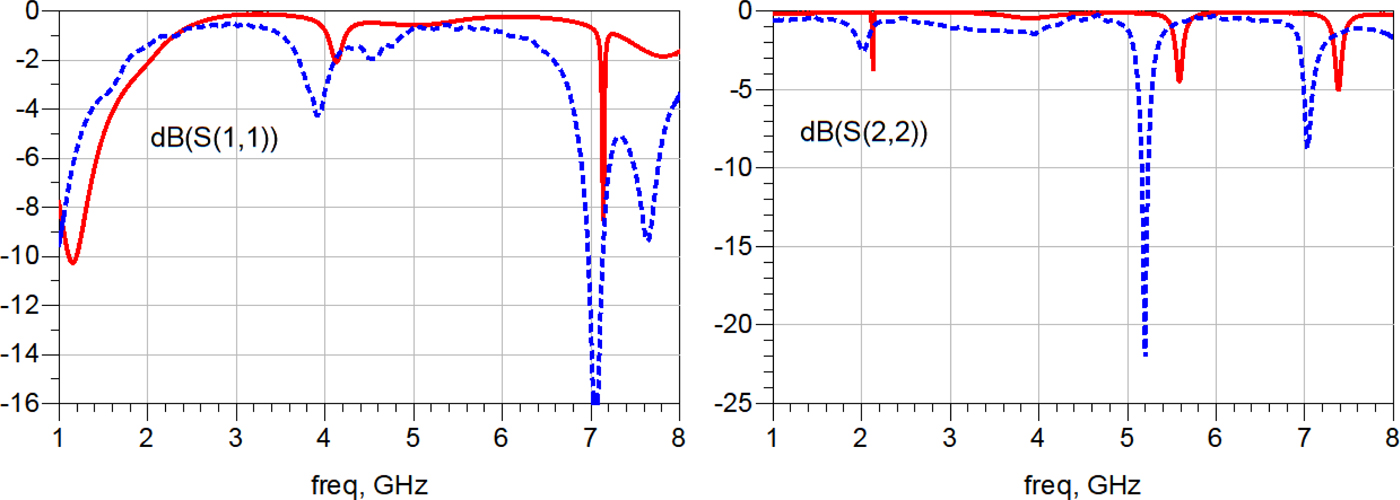
In conclusion, the inaccuracy of the amplifier design results from the errors of both the transistor model and the models of microstrip circuits. The actual contribution of the identified error sources is difficult to evaluate based on only one prototype. It seems that the errors of microstrip circuit models are comparable to the errors due to the inaccuracy of the transistor model.
Re-tuning of the amplifier
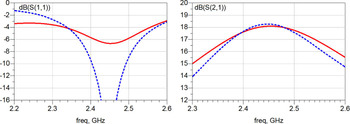
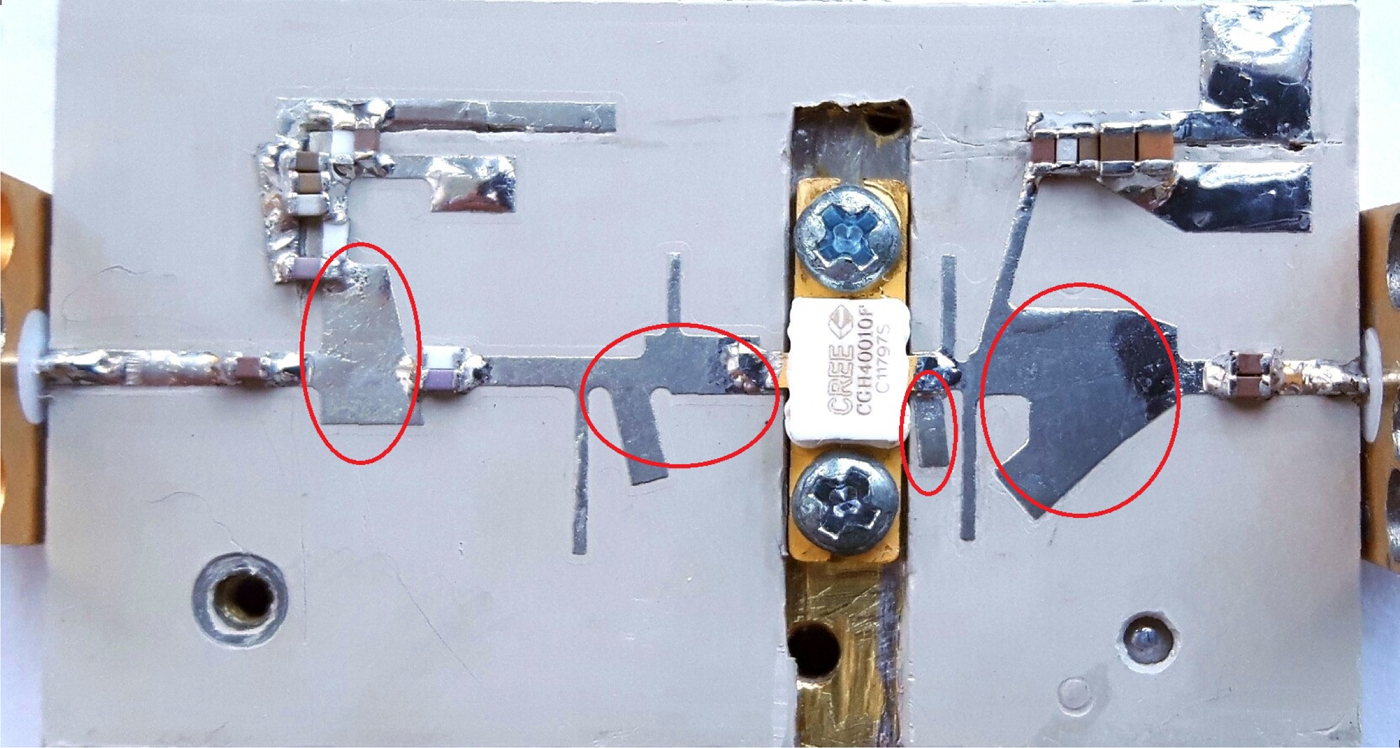
The amplifier was re-tuned to match the frequency requirements. A view of the re-tuned amplifier is shown in Fig. 14. Return loss and gain frequency characteristics of the measured re-tuned amplifier and the simulated one are compared in Fig. 15. In the IMN, the microstrip nearest to the transistor was widened. Moreover, one stub was added between two original stubs and the line in the DC supply circuit was also widened. In OMN, a stub was added next to the transistor and the wide line next to the DC block capacitors was reshaped. Source and load impedances measured at the transistor plane before and after re-tuning are given in Table 2.
A photography of the tuned amplifier.
The return loss and gain versus frequency of the measured re-tuned amplifier (dotted line) and simulated (solid line) (U DS = 28 V, I DQ = 420 mA).

Source and load impedances measured at the transistor plane before and after re-tuning

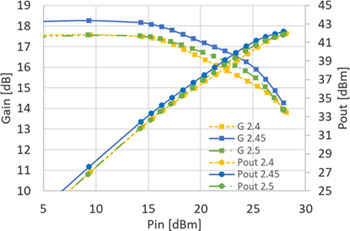
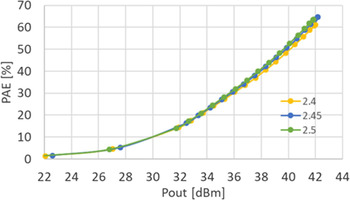
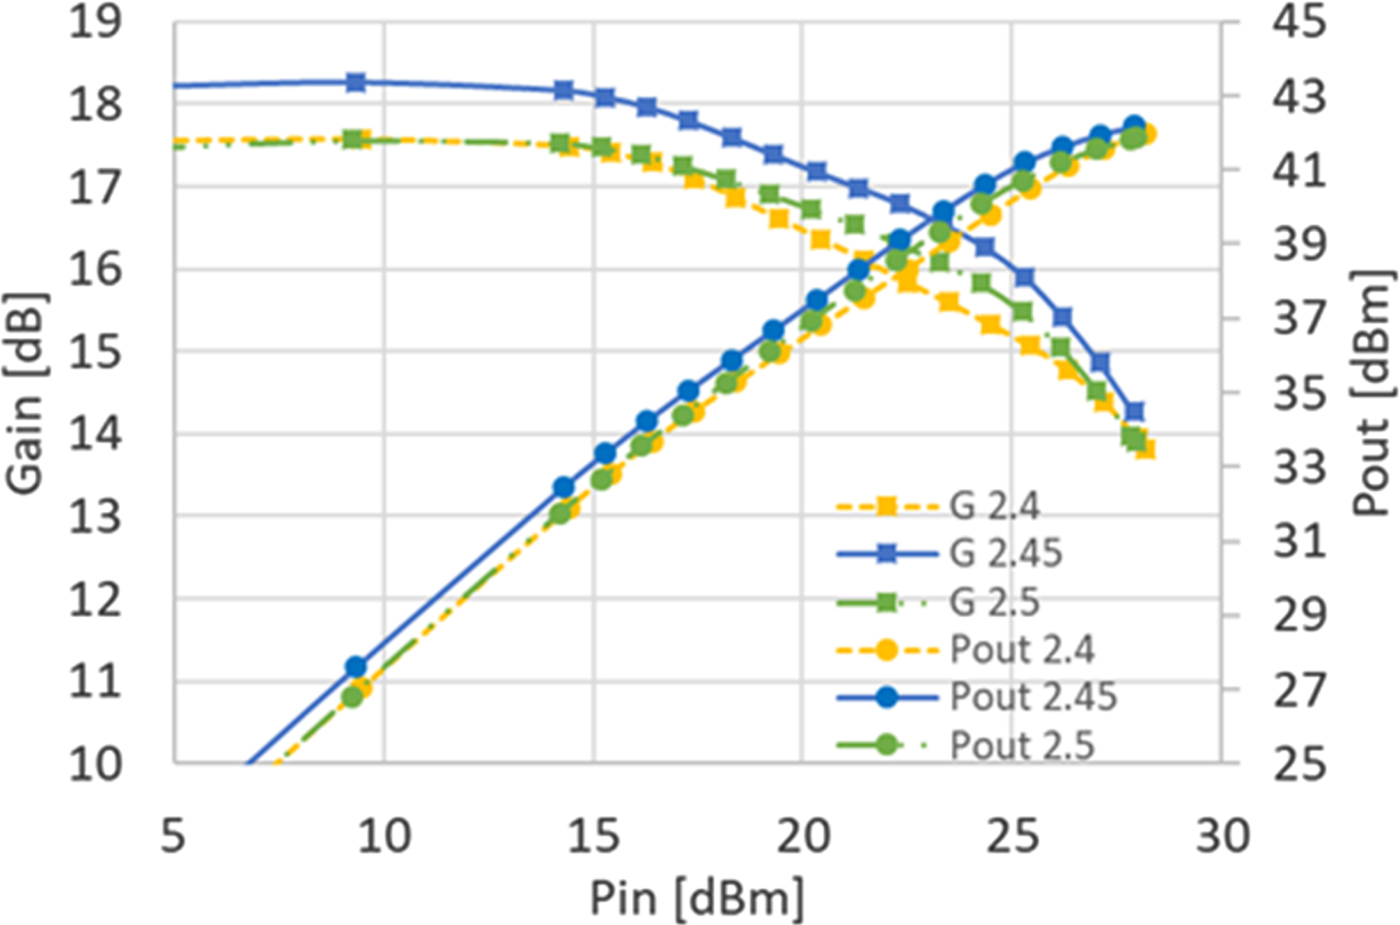
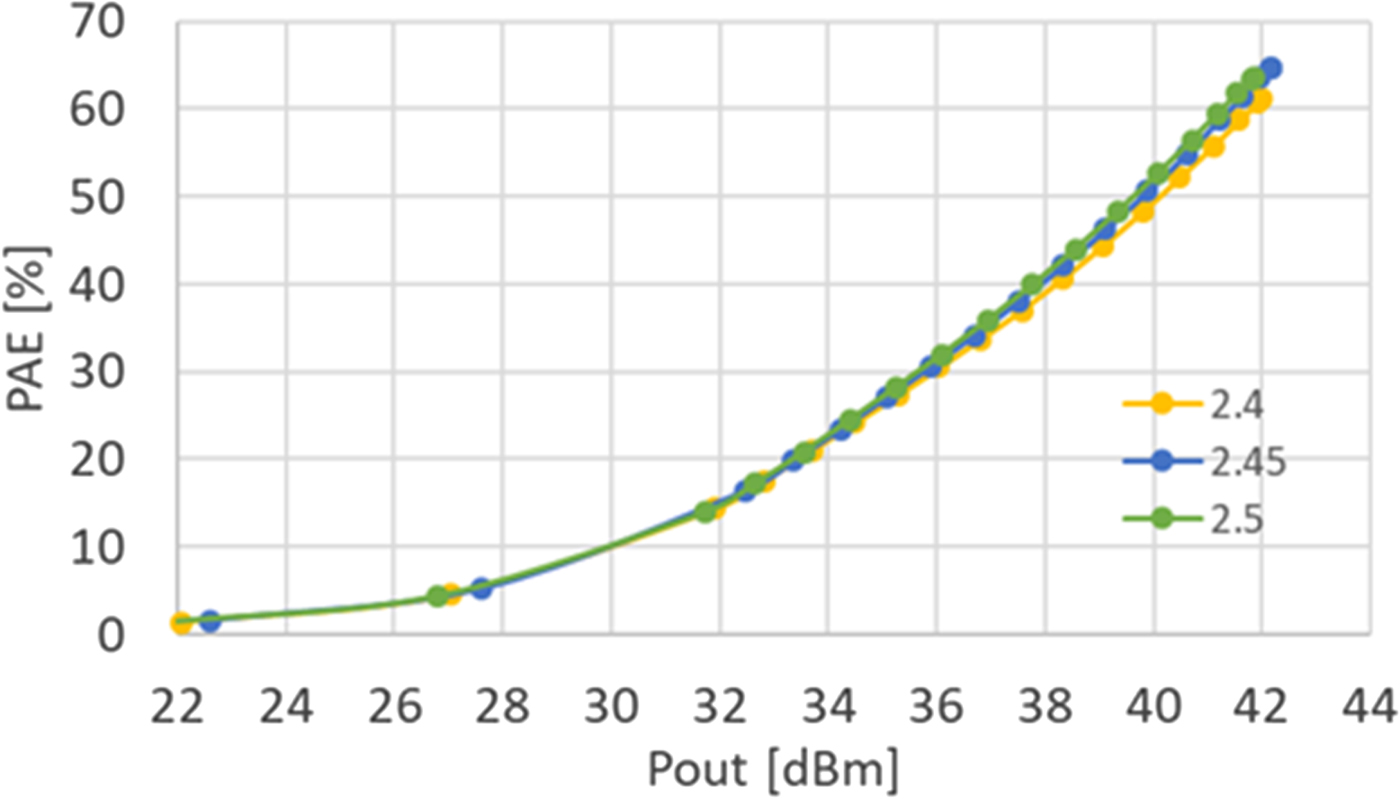
The power characteristics of the amplifier were measured with Agilent E9300B power sensor and Agilent E4418B power meter. Measured output power and gain as a function of input power from 2.4 to 2.5 GHz frequency range are plotted in Fig. 16. The highest output power level of 16.5 W (42.2 dBm) was obtained at 2.45 GHz. That is 32% more than the maximum output power specified by the manufacturer (12.5 W [15]). The power measured at 2.4 and 2.5 GHz was 15.8 and 15.3 W, respectively. The PAE as a function of the output power level at the frequency of 2.4, 2.45, and 2.5 GHz is shown in Fig. 17. The PAE reached a level of 64.7% at 2.45 GHz and 61.2 and 63.5% at 2.4 and 2.5 GHz, respectively. Despite the high gain compression, its value is still high and is bigger than 14 dB.
Measured gain and output power as a function of the input power of the re-tuned amplifier (U DS = 28 V, I DQ = 420 mA).
Measured PAE as a function of the output power of the re-tuned amplifier (U DS = 28 V, I DQ = 420 mA).
Conclusions
The designed amplifier provides more than 15 W of output power and 61% PAE over a 2.4–2.5 GHz frequency range. The amplifier achieves output power more than 30% higher than the value specified by the manufacturer. To achieve such results, a harmonic tuning method is applied. Despite a visible effect of the high output power saturation, the gain is still high and was higher than 14 dB. An accurate non-linear model of the transistor is obviously a crucial element in the effective application of this method. But it is worth noting that the impact of microstrip circuit models implemented in the simulator is also important. Obtained results show that despite high sensitivity to the inaccuracy of transistor and microstrip models, the method is an effective tool in the design process. It allows improving amplifier parameters such as output power, efficiency, gain, or linearity. A model provided by the manufacturer, which was used in the design, is sufficiently accurate to estimate the output power and efficiency and to find the initial design to achieve those requirements. Nevertheless, small-signal measurements are still very useful, as they help in designing a proper matching network, especially at the input of the amplifier. One must also be careful with the substrate chosen to the design. To reduce the inaccuracy, it is better to use the substrate of lower permittivity.
Author ORCIDs
Marcin Góralczyk, 0000-0001-7313-442X; Wojciech Wojtasiak, 0000-0002-6422-7154
 Marcin Góralczyk received the M.Sc. degree in Telecommunication from the Warsaw University of Technology, Warsaw, Poland in 2014. He is a Ph.D. Student at WUT in the Institute of Radioelectronics and Multimedia Technology. His main research interests are microwave multi-stage Doherty power amplifiers and harmonic-tuned power amplifiers.
 Wojciech Wojtasiak received the M.Sc., Ph.D., and D.Sc. degrees in Electronic Engineering from the Warsaw University of Technology, Warsaw, Poland, in 1984, 1998, 2015, respectively. He is currently a Professor at WUT and the head of Microwave and Radiolocation Engineering Division. Since 1990 his research activity concentrates on the design of high-frequency-stability microwave high-power solid-state sources and transmitters. Now, he has been also engaged in research on GaN HEMT technology and thermal analysis in the time domain of high-power microwave FETs. Since 1998 he has been a member of IEEE.