Colostrum, the first mammary secretion after parturition, is an important source of immunity and nutrition for the new born calf (Weaver et al. Reference Weaver, Tyler, VanMetre, Hostetler and Barrington2000; Beam et al. Reference Beam, Lombard, Kopral, Garber, Winter, Hicks and Schlater2009). In order to ensure enough mass of IgG fed to the calf, the recommendation is to feed 3 to 4 l of colostrum with an IgG concentration of >50 g/l within 4–6 h after parturition (McGuirk & Collins, Reference McGuirk and Collins2004; Beam et al. Reference Beam, Lombard, Kopral, Garber, Winter, Hicks and Schlater2009). The concentration of IgG in colostrum varies a lot (Morrill et al. Reference Morrill, Conrad, Lago, Campbell, Quigley and Tyler2012; Quigley et al. Reference Quigley, Lago, Chapman, Erickson and Polo2013), and often the concentration of IgG is too low to fulfil the calf's needs. Studies found that 30–50% of the colostrum contained less than the recommended 50 g/l IgG (Gulliksen et al. Reference Gulliksen, Lie, Solverod and Osteras2008; Morrill et al. Reference Morrill, Conrad, Lago, Campbell, Quigley and Tyler2012; Bartier et al. Reference Bartier, Windeyer and Doepel2015). It is therefore pivotal for the farmer to know the concentration of IgG in colostrum right after milking to ensure that the colostrum is suitable for feeding the new born calf. Attempts to use colour and viscosity of colostrum as indicators of quality have not proven satisfactory as they do not correlate to IgG concentration (Maunsell et al. Reference Maunsell, Morin, Constable, Hurley and McCoy1999; Gross et al. Reference Gross, Kessler and Bruckmaier2014).
The most recognised methods for measurement of the concentration of Ig uses an immunoreaction; either radial immunodiffusion (RID) (Bielmann et al. Reference Bielmann, Gillan, Perkins, Skidmore, Godden and Leslie2010; Quigley et al. Reference Quigley, Lago, Chapman, Erickson and Polo2013), or enzyme-linked immunosorbent assay (ELISA) (Gross et al. Reference Gross, Kessler and Bruckmaier2014; Verweij et al. Reference Verweij, Koets and Eisenberg2014). Both of these methods are, however, laboratory methods and not suited for practical quality control at the farm. At present, indirect methods are the only choice for on-site measurement at the farm.
For many years specific gravity (SG) measured with a colostrometer has been used as an inexpensive and practical method for estimating Ig concentration (Morin et al. Reference Morin, Constable, Maunsell and McCoy2001; Bartier et al. Reference Bartier, Windeyer and Doepel2015). Morin et al. (Reference Morin, Constable, Maunsell and McCoy2001) found that SG was more strongly correlated to protein concentration than to IgG concentration. Moreover the temperature of the colostrum affects the result (Mechor et al. Reference Mechor, Gröhn, McDowell and van Saun1992) and the colostrometer is rather fragile. Consequently, there is an increasing interest in finding alternative fast methods for estimating IgG concentration in colostrum. Brix has recently been studied due to the ease of measuring and low temperature dependence (Bielmann et al. Reference Bielmann, Gillan, Perkins, Skidmore, Godden and Leslie2010), and the correlation to IgG has been found acceptable (Bielmann et al. Reference Bielmann, Gillan, Perkins, Skidmore, Godden and Leslie2010; Quigley et al. Reference Quigley, Lago, Chapman, Erickson and Polo2013; Bartier et al. Reference Bartier, Windeyer and Doepel2015).
Both SG and Brix are, however, not directly predicting IgG concentration but rely on the covariance with total protein concentration (TP); meaning that the estimation is based on an indirect correlation rather than a direct correlation between IgG and SG or IgG and Brix. Thus, the ratio between IgG and TP (IgG/TP) has to be constant in order to secure a stable prediction. It is therefore necessary to take the covariation between IgG and TP and other major constituents in colostrum into consideration when developing fast methods for prediction of IgG.
In the dairy industry near infrared (NIR) or Fourier transform infrared (FT-IR) methods are commonly used to predict e.g. dry matter, fat and protein concentration of raw milk and dairy products. A FT-IR instrument has been used for measuring fat, protein, lactose and dry matter in colostrum in other studies (Morrill et al. Reference Morrill, Conrad, Lago, Campbell, Quigley and Tyler2012), however the ordinary milk calibration for prediction normally does not cover the range of TP found in colostrum samples (FOSS, 2012). NIR has been reported as a possible fast method for measuring the IgG concentration of colostrum (Rivero et al. Reference Rivero, Valderrama, Haines and Alomar2012). Due to signal intensities FT-IR often gives better predictions of chemical composition than NIR, and it is therefore possible that the FT-IR spectra can be used for prediction of the IgG concentration in colostrum. Also for calibration of NIR and FT-IR it is important to take the covariance structures among the constituents into account (Eskildsen et al. Reference Eskildsen, Rasmussen, Engelsen, Larsen, Poulsen and Skov2014), meaning that a FT-IR calibration of IgG could very well be working due to the indirect correlation between protein and IgG concentration.
The purpose of this work was to study the covariance structure concerning origin and composition of cow's colostrum and to take the covariance structure into account in a comparison of SG, Brix and FT-IR as fast methods for prediction of IgG in colostrum.
Materials and methods
Twenty-one dairy farms with 100–1250 dairy cows per farm participated in the study in September through November 2013 delivering between 1 and 23 samples from each farm. The included dairy farms were positioned <2 h drive from the University laboratory (AU-Foulum, Denmark), and representing both conventional and organic farming practice and most of them had either Danish Holstein or Danish Jersey breed (Table 1). The objective of the sample collection was to ensure a broad variation pattern in IgG, protein and fat concentration in the colostrum samples. Across breed and parity all combinations occurred 4–26 times (Table 1). Colostrum was harvested as the farmer would normally do it, and at latest 24 h after calving. The time from calving to milking was noted for each sample; 92% of the samples were collected at latest 13 h after calving. From each harvesting 500 ml colostrum was sampled and stored at 3–6 °C at the farm until collection 0–4 d later. After collection the colostrum samples were transported under chilled condition (2–5 °C) to the University laboratory. Following arrival the colostrum samples were placed in 500 ml plastic bottles warmed to 20 °C and mixed carefully using a magnetic stirrer before analysing SG by colostrometer. The same sample was split into smaller volumes and used for measurement the same day of Brix by refractometer, dry matter by drying and composition and spectra by FT-IR, as well as for storage at −20 °C for later analysis of IgG concentration and reference analysis of fat and protein.
Colostrum samples collected across breed, farming practice, and parity

Colostrometer analysis
Approximately 250 ml of colostrum was transferred into the colostrometer measuring cylinder. The colostrometer (Kruuse, Langeskov, Denmark) was lowered into the cylinder and when the instrument floated freely, SG was determined by the same person reading the color-coded scale above the submerged portion of the instrument. The scale of the instrument (1023 to 1077) was divided into three zones, and according to the instructions from the manufacturer SG less than 1035 should be considered poor quality (red zone), SG from 1035 to 1045 as intermediate quality (light green zone) and SG above 1045 as good quality (dark green zone). Samples with readings above the scale (1077) were considered good quality for diagnostic tests; however, they had to be excluded from some parts of the data analysis due to no reading.
Refractometer analysis
Brix was measured by three different refractometers; an optical instrument (Atago 2311 Master-Alpha, Food Diagnostics, Grenaa, Denmark) with a upper limit of 33 °Bx and two digital instruments, digital instrument A (Atago PAL-S, Food Diagnostics, Grenaa, Denmark), and digital instrument B (Misco, DD3 Digital Dairy Refractometer, Misco.com). The optical instrument was read by the same person to the nearest 0·5. For all plots and tables the digital instrument A was used.
Infrared and compositional analysis
Full FT-IR spectra were recorded on all samples using MilkoScan FT2 (Foss Analytical A/S, Hillerød, Denmark); samples were measured in triplicate. Spectra were obtained from fresh colostrum and TP, fat, DM, and lactose were determined using the using the build-in milk application giving results in % (w/w). For each FT-IR measurement, a FT-IR water spectrum was automatically subtracted and the difference spectrum obtained. For further analysis, the average difference spectrum of each sample (across the three replicates) was calculated and used.
The ordinary milk calibration in MilkoScan FT2 cannot be expected to cover colostrum samples and especially TP and DM in colostrum is much higher than supported by the calibration, as the fat calibration covers from 0·01 to 13·5% fat, the protein calibration from 1·62 to 7·06% protein and the dry matter from 4·44 to 22·30% protein (FOSS, 2012). Therefore Kjeldahl analysis for TP, drying for DM, and Röse-Gottlieb analysis for fat were used to support the results given by the MilkoScan and correlations between these and the MilkoScan results were made.
Dry matter reference analysis was performed on fresh samples by freeze-drying; 2 g colostrum was transferred to a 15 ml pre-weighed PP-plastic tube (Sarstedt AG & Co., Nümbrecht, Germany), where a hole was drilled in the lid in order to led the vapour escape. The tubes were weighed and placed in a freeze-dryer (Scanvac CoolSafe™, Scanlaf A/S, Lyngby, Denmark) for 20 h. The samples were weighed immediately hereafter and the dry matter concentration was calculated. Before the experiment the method was compared to the heating oven drying method (IDF 21B:1987), and it was found to give similar results in an easier way (not shown). The dry matter results correlated with the MilkoScan results with slope 1·04, offset −0·5 and a correlation coefficient (r 2) of 0·98, which is slightly lower than the r 2 reported by the manufacturer (FOSS, 2012).
Fat and TP were measured on 10 representative samples from the lot by Röse Gottlieb and Kjeldahl analysis (conversion factor 6·38) at a commercial laboratory (Eurofins Steins, Vejen, Denmark). For fat a single sample was deviating with a difference of 2% fat between MilkoScan and Röse Gottlieb, however excluding this sample, the correlation of the MilkoScan results and the Röse Gottlieb results had a slope of 1·00, offset −0·1 and an r 2 of 0·996. For protein the correlation with the 10 samples had a slope of 1·00, offset 0·00 and an r 2 of 1. It was concluded that the results calculated by the milk calibration regarding DM, fat and TP could be used for colostrum samples.
Immunochemical analysis
Colostral IgG concentration was determined with ELISA (Bovine IgG ELISA Quantitation Set; Cat. No. E10-118; Bethyl Laboratories Inc; Montgomery, TX) according to the manufacturer's instructions with a few modifications. Colostrum samples were diluted with a factor of 3·33 × 105 with 0·01 M PBS pH 7·2 and for the last two dilution steps protein low bind tubes (Protein LoBind Tube 0·5 ml, Eppendorf, Hamburg, Germany) were used. Standards were performed in duplicates and samples in triplicates. The blue colour development was followed at 650 nm in the dark by a microtiter plate spectrophotometer (Synergy 2, Bio-Tek, Potton, United Kingdom). The concentration of IgG was calculated by interpolating from a standard curve generated from fitting the kinetic read to a Michaelis-Menten equation. Endpoint reading was performed at 450 nm after adding stop-solution. Samples were rerun if the kinetic and the endpoint results were differing more than 25%. The kinetic results were used and expressed as IgG concentration in g/l. The ratio IgG/TP was calculated as: (IgG × 100)/(TP × SG), where SG was used to convert from volume and weight to same unit.
In order to compare ELISA to RID, 30 samples were also analysed by a commercial RID kit (Bovine IgG test kit, Triple J Farms, Bellingham, WA). The ELISA results were used to decide a dilution factor for the individual samples to ensure that the result was in the range of the standard curves; low content samples were diluted 3 times and high content samples 6 times with 0·01 m PBS pH 7·2. Two people read the diameter of the resulting rings. No reading differed more than 0·1 mm, and using standard solutions and standard scale, the concentration of IgG was calculated from the diameters. Both samples and standards were run in duplicates. ELISA gave slightly lower results than RID (RID = 0·89 × ELISA + 23) similar to what Gelsinger et al. (Reference Gelsinger, Smith, Jones and Heinrichs2015) found, however the pearson correlation coefficient (r = 0·75) found in our study was higher than that (r = 0·36) found by Gelsinger et al. (2015). The reasons for differences between the two methods could be due to different standard mixtures.
Data analysis
Tukey's honest significance difference (HSD) test was used for multiple comparisons of treatment means at a significance level of P < 0·05.
The multivariate pattern between the nutritional content (IgG, fat, TP, DM, IgG/TP) and the information of parity and time from calving to milking was explored using principle component analysis (PCA).
For multivariate calibration of the IgG concentration from the FT-IR spectra Partial Least Squares regressions (PLS) were applied. The FT-IR spectra were treated as described in Eskildsen et al. (Reference Eskildsen, Rasmussen, Engelsen, Larsen, Poulsen and Skov2014). For all models the spectra were mean centered. The models were cross-validated using the venetian blind method with seven data splits. Model parameters (coefficient of determination, r 2, and root mean squared error of cross-validation, RMSECV) are reported and were used to choose the number of PLS components (PC). One sample with generally very low concentrations was excluded as the spectrum was very different from the rest of the samples.
SIMCA P ver. 13 (Umetrics, Umeaa, Sweden) was used for PCA and PLS modelling, except for interval PLS, where PLS_toolbox ver. 7·9 (Eigenvector Research Inc., Wenatchee, WA) in Matlab R2014a (MathWorks, Natick, MA) was used. The multilinear relationship between TP and fat to Brix and SG was studied by a multiple linear regression analysis with a t test at a 5% significance level using the statistical software R (Version 3.1·1, R Development Core Team 2014, Vienna, Austria).
Results and discussion
Composition of colostrum in the experiment
The concentration of IgG showed great variation in the samples from 3 to 154 g of IgG/l colostrum with an average value of 60·2 ± 24·6 g/l and a median of 56·5 g/l. The average was lower than results from North American studies; 63·7 g/l found by Bartier et al. (Reference Bartier, Windeyer and Doepel2015) in a Canadian study of 460 colostrum samples and 68·8 g/l found by Morrill et al. (Reference Morrill, Conrad, Lago, Campbell, Quigley and Tyler2012) a survey of 827 colostrum samples in US. Whereas it was higher than in other European studies; Gulliksen et al. (Reference Gulliksen, Lie, Solverod and Osteras2008) found a median of 45·0 g/l in a survey including 1·250 colostrum samples in Norway and Verweij et al. (Reference Verweij, Koets and Eisenberg2014) found an average of 41·5 g/l in 189 colostrum samples from Dutch cows. Also the nutritional composition in the present study showed great variation; fat varied from 0·62 to 14·0%, TP from 5·6 to 23·8%, DM from 13·9 to 36·2%, and lactose from 2·5 to 4·5%. A few of the samples were very low in protein and IgG, however all samples were harvested as colostrum in the timeframe of 24 h after parturition. This underpins the need for testing colostrum before feeding the calf. The proportion of IgG/TP varied from 6 to 61%, and in order to have good correlations between fast on-site methods and IgG then the covariance structure of IgG and TP should be fairly constant as the fast methods measures TP. Significant variation in IgG/TP therefore suggests that the correlations between IgG and the fast methods cannot be perfect. These are great variations compared to milk; however the variations and levels found in this study are not extraordinary as other researchers have found similar variation and levels in nutritional composition (Morrill et al. Reference Morrill, Conrad, Lago, Campbell, Quigley and Tyler2012). The averages of nutrients and IgG were calculated according to breed, parity, and farming practice (Table 2), however as the data were not perfectly balanced an ANOVA analysis was not performed.
Nutrient and IgG averages by breed, parity, and farming practice
Means (sem)
TP, total protein concentration
a,bMeans within a row within the same parameter with different superscript letters differ (P < 0·05) by Tukey HSD test
† Measured by enzyme-linked immunosorbent assay (ELISA)
‡ From MilkoScan predictions
§ IgG/TP was calculated by (IgG · 100)/(TP · specific gravity)
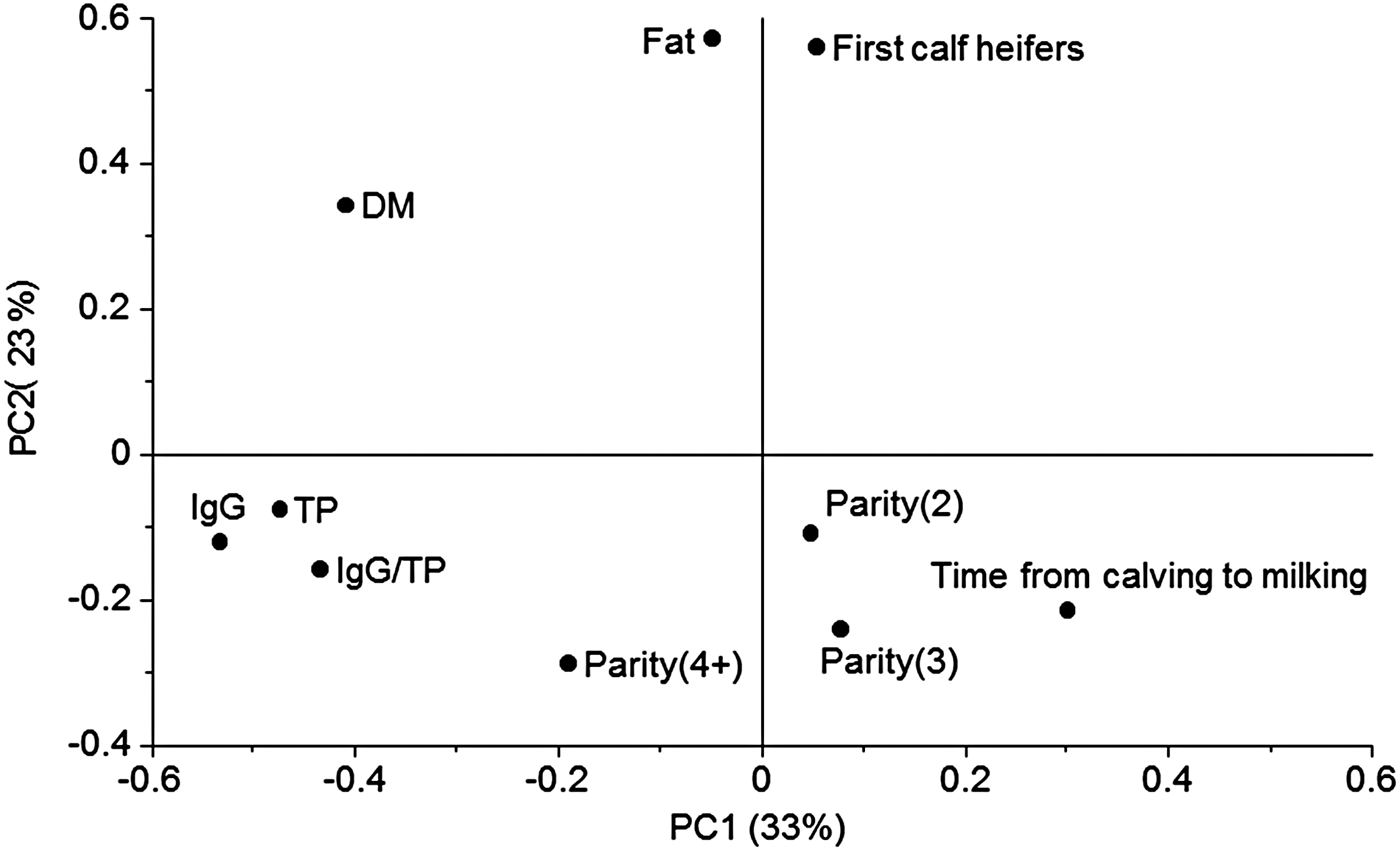
In order to investigate the multivariate pattern of covariance structures between the significant variables a PCA was performed (Fig. 1). Here 56% of the variation in data was explained by the two first principle components (PC). The main variation along PC1 was closely related to TP and IgG placed to the left in the plot (Fig. 1). Opposite to TP and IgG, on the right side of the plot ‘Time from calving to milking’ was placed, meaning that this was negatively correlated to IgG and TP. An investigation of the relation between the IgG concentration and time from calving to milking was further analysed showing the IgG decreased at increasing time from calving to milking (r 2 = 0·15, not shown). Only 51% of the colostrum milked later than 5 h after calving contained more than 50 g IgG/l, whereas 82% of the colostrum samples milked at latest 5 h after calving contained more than the recommended 50 g IgG/l. There is a general agreement in literature that the IgG concentration decreases with time postpartum (Moore et al. Reference Moore, Tyler, Chigerwe, Dawes and Middleton2005; Morin et al. Reference Morin, Nelson, Reid, Nagy, Dahl and Constable2010), and our results emphasise how important it is to obtain colostrum as soon as possible after parturition.
Loading plot from principal component analysis (PCA) including nutritional data and information of parity and time from calving to milking. Principle component 1 (PC1) explained 33% of the variation and PC2 23%. TP, total protein; DM, dry matter; IgG, immunoglobulin G. IgG was measured by enzyme-linked immunosorbent assay (ELISA), fat and protein was predicted from Fourier transform infrared spectroscopy (FT-IR), and IgG/P was calculated by (IgG · 100)/(TP · specific gravity).
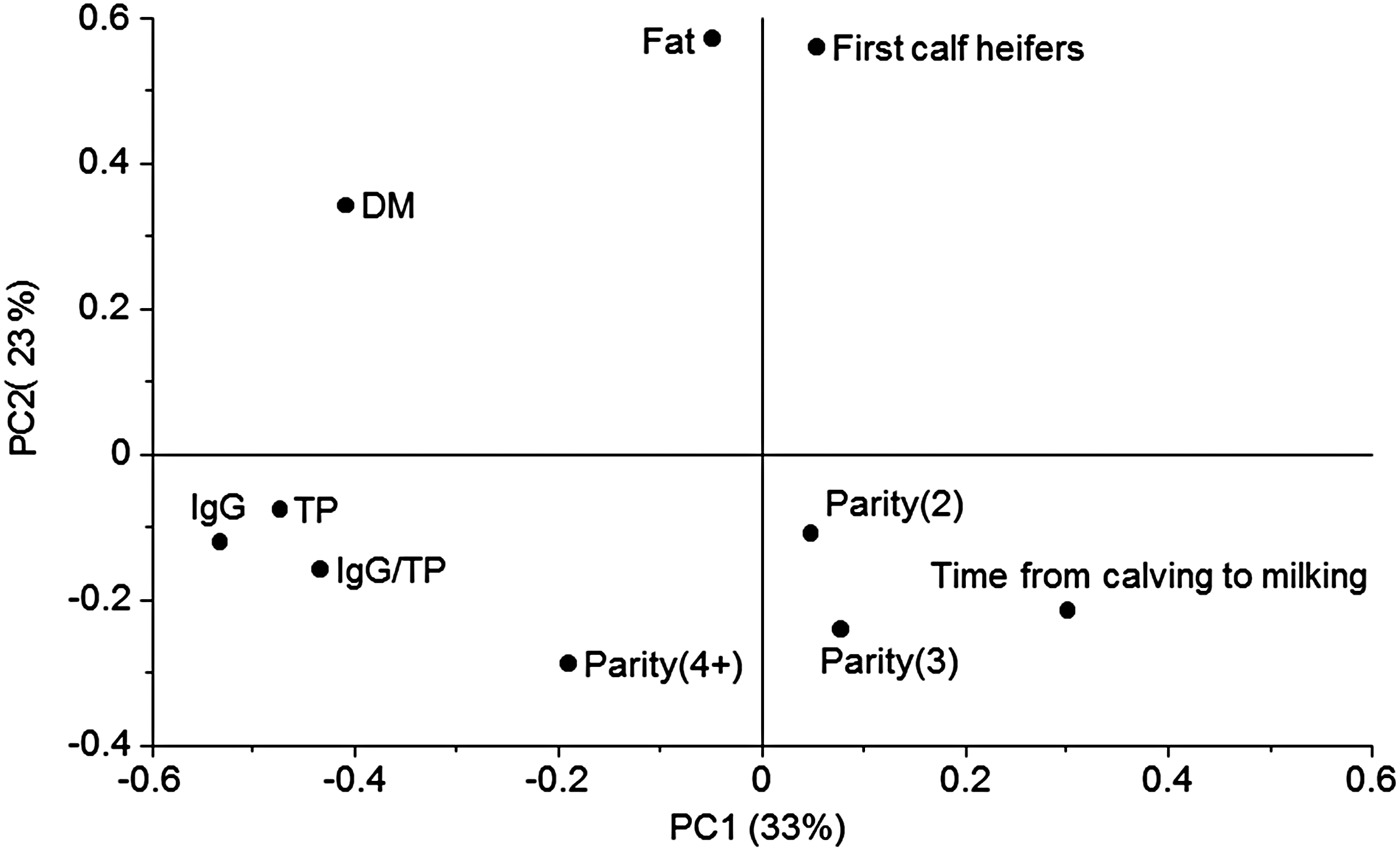
Principle component two (PC2) was dominated by the fat concentration (Fig. 1). In a PCA the components are calculated to be orthogonal to each other meaning that the fat concentration (on PC2; Fig. 1) varied independently of TP (on PC1; Fig. 1). First calf heifers were closely positioned to the fat concentration in the plot indicating that the two variables were correlated, at least with an r 2 at a level of 56%, which is the variation explained by the first two PC's. This observation was consistent with the observations in Table 2, were first calf heifers delivered colostrum with a generally higher fat concentration than the other parities. Parity 4+ was positioned slightly to the left in the loadings plot in the direction of high protein and IgG concentration which is also consistent with the information in Table 2. Some of the variables varied according to breed (Table 2), however, the Jersey colostrum used in our study generally arose from a higher parity than the Holstein colostrum (Table 1). In that sense it is not surprising that colostrum from the Jersey breed showed the same variation pattern as higher parity cows with slightly higher IgG/TP than the other breeds and significant lower fat concentration. Recently, also Morrill et al. (Reference Morrill, Conrad, Lago, Campbell, Quigley and Tyler2012) reported no significant differences between Holstein and Jersey breeds concerning nutrient composition and IgG concentration. Dry matter concentration was positioned in the upper left quadrant and therefore related to both high protein and high fat concentration. This makes sense as the lactose concentration of the colostrum samples was approximately constant, and variations in DM were therefore mostly due to variations in fat and protein.
Fast on-site measurements of colostrum quality
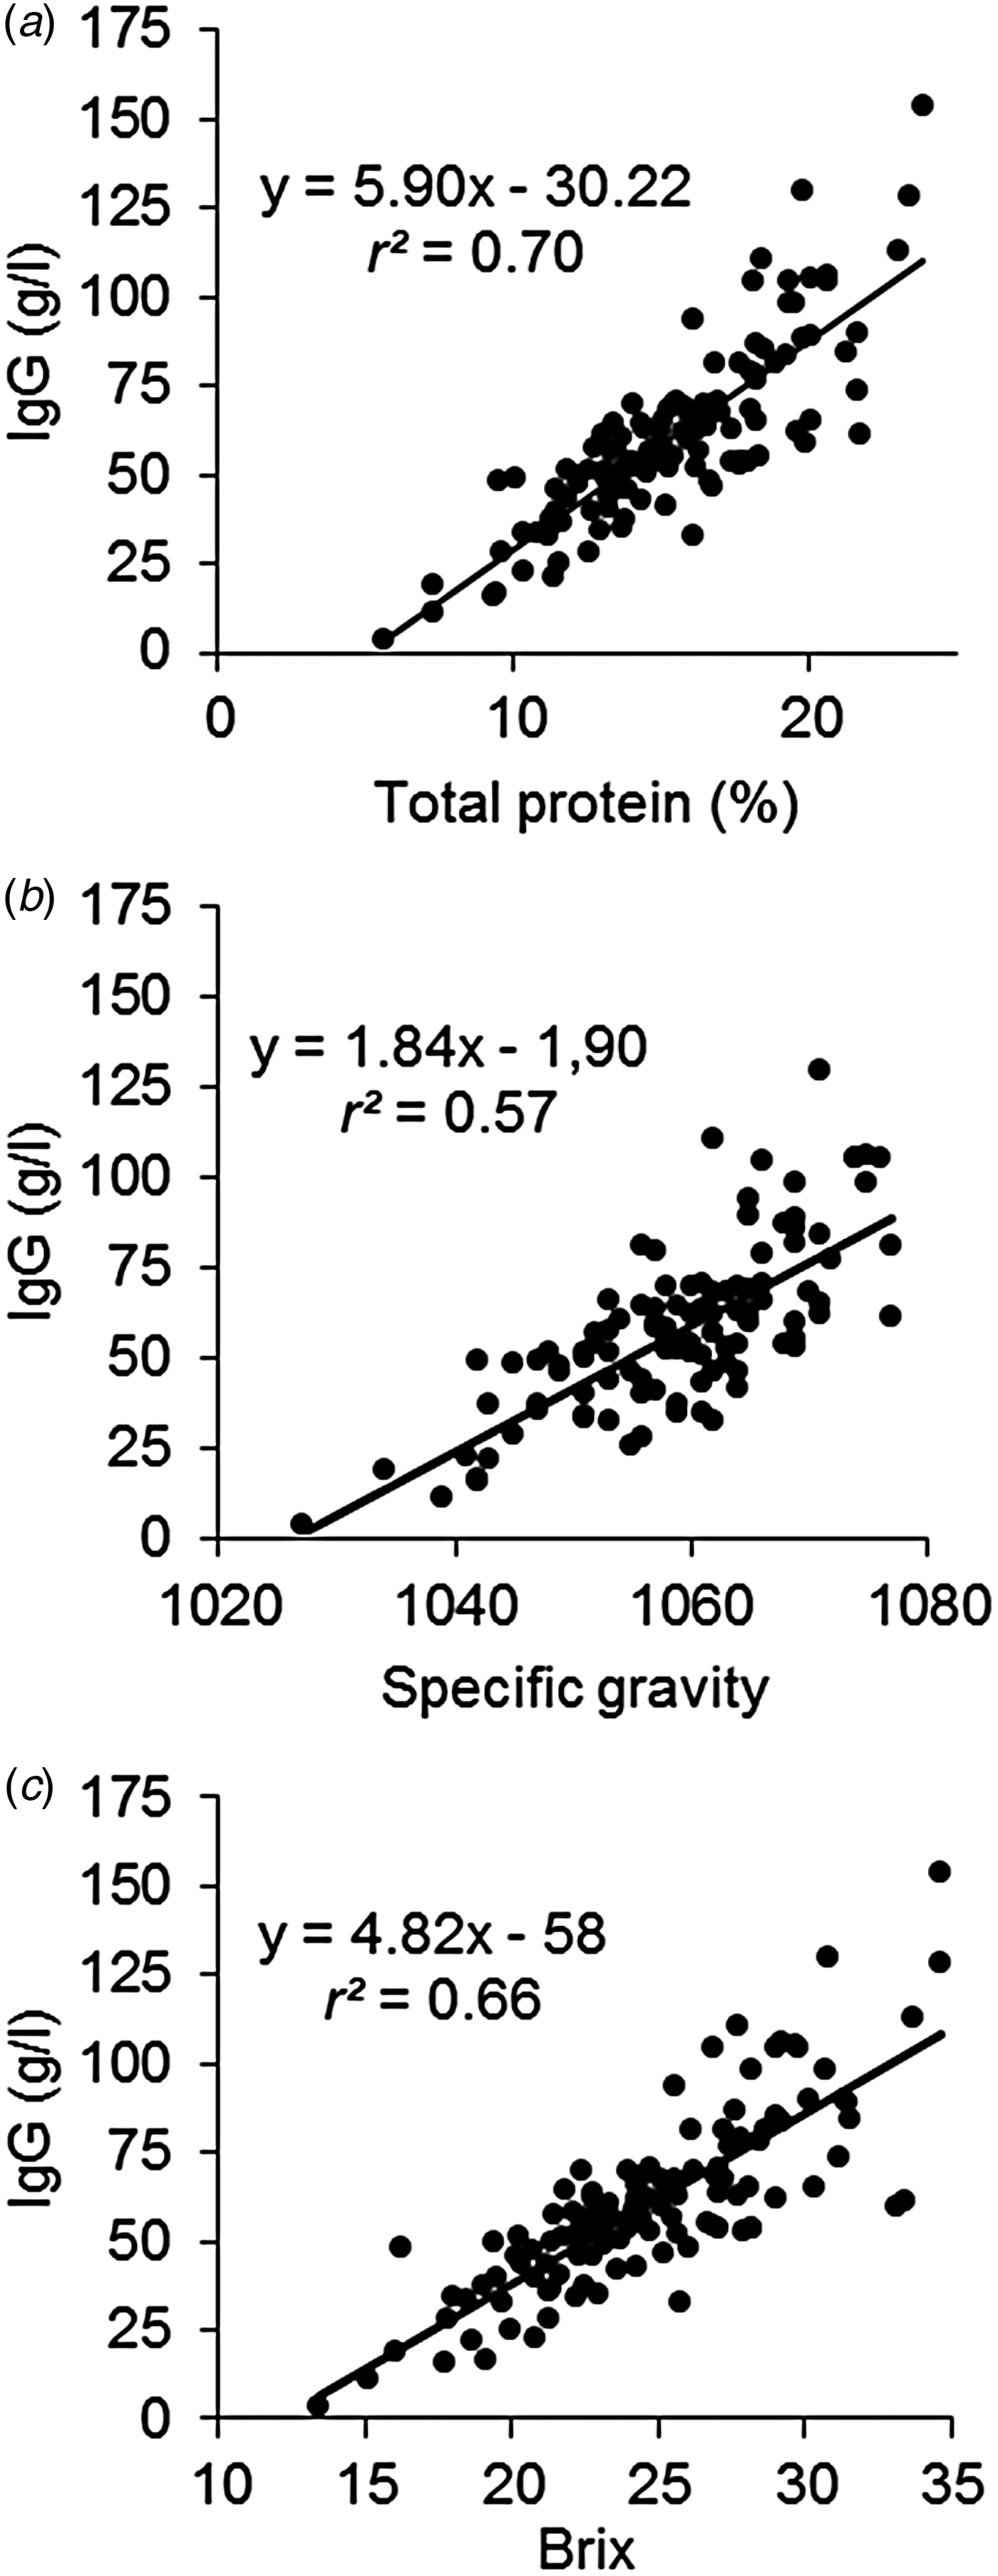
The IgG in colostrum constitutes to a great portion of the TP, ranging from 6 to 61% IgG/TP in our study with an average of 36%, and the IgG concentration was correlated to TP (Fig. 2a) with an r 2 of 0·70. The variation increased at increasing concentration, this could be due to increasing sampling uncertainty for IgG measurement as the viscosity was increased in some samples with high IgG concentration (not shown). Most of the fast measurements of IgG concentration used at the farm take advantage of this correlation and estimates IgG concentration from measures of TP. A fast method based on protein detection can therefore not be expected to be better than what the correlation between IgG and TP is. The correlation between Brix and IgG (r 2 = 0·66; Fig. 2c) was therefore also very close to the correlation between TP and IgG (r 2 = 0·70; Fig. 2a) and it was higher than the correlation between SG and the IgG concentration (r 2 = 0·57; Fig. 2b). The correlations found in our study are similar to what others have found for Brix (r 2 = 0·73; Bielmann et al. Reference Bielmann, Gillan, Perkins, Skidmore, Godden and Leslie2010; r 2 = 0·43; Bartier et al. Reference Bartier, Windeyer and Doepel2015) and for SG (r 2 = 0·60; Bartier et al. Reference Bartier, Windeyer and Doepel2015).
Relation between total protein and immunoglobulin G (IgG) concentration (a), between specific gravity and immunoglobulin G (IgG) concentration (b), and between Brix and IgG (c). IgG was measured by enzyme-linked immunosorbent assay (ELISA) and total protein was predicted from Fourier transform infrared spectroscopy (FT-IR).
In this study we tested three different refractometers and the results from them were highly correlated with r 2 of 0·99 (data not shown), and similar results were found by Bielmann et al. (Reference Bielmann, Gillan, Perkins, Skidmore, Godden and Leslie2010). The optical instrument had the disadvantage of a maximum value at Brix 33. However, for the purpose of detecting low quality colostrum with IgG < 50 g/l, all samples above Brix 33 was also above the limit and would be classified correctly (Fig. 2c).
Prediction of IgG concentration by FT-IR spectroscopy
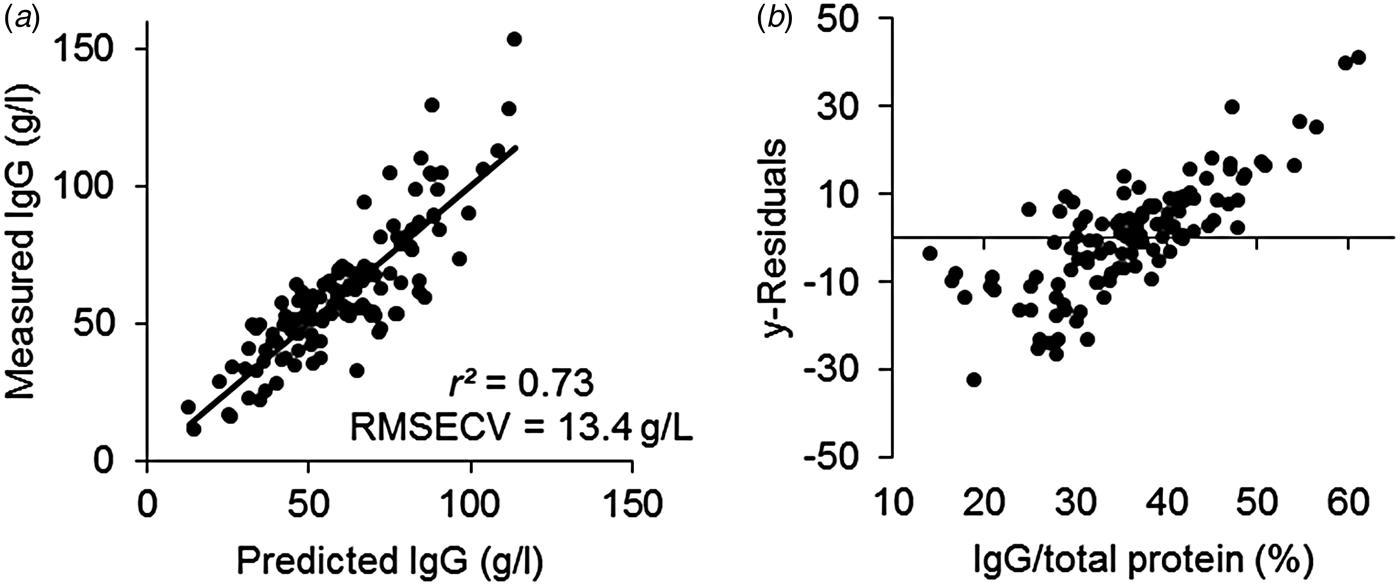
FT-IR spectroscopy is widely used for prediction of chemical constituents of milk. For colostrum, the technique has only been used for measurement of e.g. fat and protein and in the literature no attempts to predict the IgG concentration from the spectra has been reported. One study has been published using NIR for prediction of IgG concentration (Rivero et al. Reference Rivero, Valderrama, Haines and Alomar2012) with good results. IR spectroscopy utilises the mid-infrared region of the electromagnetic spectrum, where the fundamental vibrations of functional groups of organic molecules are seen, whereas the near infrared region includes overtones and combination tones of the fundamental vibrations and the signals are therefore weaker in NIR than in IR spectroscopy. It was therefore expected to have a good prediction of the IgG concentration from IR spectroscopy. From the FT-IR spectra we predicted the IgG concentration of the samples (Fig. 3a), however, the prediction of IgG was only slightly better (r 2 = 0·73) than the correlation between protein concentration and IgG (r 2 = 0·70; Fig. 2a), meaning that it was very likely that the model was not actually predicting IgG, but protein instead and that the correlation between FT-IR and IgG was indirect. The y-residuals, the part of IgG not explained by the PLS model, was positively correlated (r 2 = 0·62) to the IgG/TP ratio (Fig. 3b), meaning that at low values of the ratio the FT-IR model generally overestimated the IgG concentration and at high values of the ratio, the model generally underestimated the IgG concentration. Hence, the model only worked well at an average IgG/TP ratio.
Results from a partial least squares (PLS) regression model predicting immunoglobulin G (IgG) from Fourier transform infrared (FT-IR) spectra using 3 PLS components and explaining 73% of the variation in IgG with a root mean squared error of cross validation (RMSECV) of 13·4 g/l. (a) Predicted vs. measured IgG concentration. (b) Residual y variance in the PLS model based on FT-IR spectra vs. IgG/total protein. IgG was measured by enzyme-linked immunosorbent assay (ELISA), protein was predicted from Fourier transform infrared spectroscopy (FT-IR), and IgG/total protein was calculated by (IgG × 100)/(total protein × specific gravity)
We found the prediction uncertainty (RMSECV = 13 g/l) to be higher than what was found by Rivero et al. (Reference Rivero, Valderrama, Haines and Alomar2012) (RMSECV = 9 g/l), even though the FT-IR model theoretically should be better than the NIR model. In the NIR study by Rivero et al. (Reference Rivero, Valderrama, Haines and Alomar2012) the comparison with TP was not made, and it is not clear whether the prediction of IgG from NIR was based on a causal or indirect correlation. Furthermore, in the present study more natural variation in the source of colostrum was included, compared to the study of Rivero et al. (Reference Rivero, Valderrama, Haines and Alomar2012), who collected samples from only two farms. It is also likely that the model of Rivero et al. (Reference Rivero, Valderrama, Haines and Alomar2012) was overfitted using both spectral pretreatment and 9 PLS components resulting in a too optimistic RMSECV. Higher prediction uncertainty is often the price of building robust models where the model covers the biological variation expected in future samples. Considering that we might have included more biological variation in our FT-IR model than in the NIR model of Rivero et al. (Reference Rivero, Valderrama, Haines and Alomar2012), the RMSECV of our FT-IR model is acceptable and probably more realistic even though it is higher than the one found by Rivero et al. (Reference Rivero, Valderrama, Haines and Alomar2012). The robustness of calibrations, the ability to predict future samples, must be considered no matter if the measurement method and calculations are simple like for SG and Brix or more complex like FT-IR.
Influence of fat and protein on prediction of IgG by fast methods
Total protein and fat showed great variation in the samples, and as shown TP was correlated to IgG (Fig. 2a), whereas the fat concentration varied independent of the IgG concentration (r 2 = 0·00 of fat vs. IgG; Fig. 1), and for IgG prediction fat can therefore be considered as noise and should preferably not influence the prediction considerably. The influence of the two factors on the fast measurements where further investigated using MLR (Table 3). Specific gravity, Brix and prediction by FT-IR were mostly influenced by TP; however fat also significantly influenced SG negatively and Brix positively and the prediction of IgG by FT-IR was not depended of fat (Table 3). The IgG concentration was non-significant for SG and Brix, however significant for the FT-IR prediction with a low positive coefficient. When the adjusted r 2 from the MLR models was compared to the r 2 of the univariate correlations, it was seen that mostly the SG benefitted from including fat in the model, indicating that SG is more vulnerable to variations in fat than Brix is. We found that the correlation between Brix and TP was higher (r 2 = 0·96; Table 3) than between SG and TP. Our results clearly indicate that Brix gives a good estimate of the protein concentration in colostrum. We therefore argue that the precision in prediction of the IgG concentration is more related to variations in the ratio between the IgG and TP in the individual colostrum samples than to the precision of the individual instruments, as the correlations between TP and the instruments (Table 3) were much higher than the correlations to IgG from TP (Fig. 2a) and from the instruments (Fig. 2b, c). IgG represents approximately one third of the TP in colostrum; however Table 3 showed that the FT-IR prediction was more depended on protein than IgG. This indicates that the signals originating from IgG cannot be distinguished from the signals from the other proteins in the complex mixture of constituents in colostrum and that the model is based on an indirect and not a casual correlation between IgG and the spectra with protein as the underlying factor.
Multiple linear regression (MLR) of the influence of constituents in colostrum for the individual fast methods
Standard errors are presented in brackets and * represents the significance from t test (*P < 0·05, **P < 0·01, ***P < 0·001), NS, non-significant, IgG was measured by enzyme-linked immunosorbent assay (ELISA), protein and fat was from MilkoScan predictions, FT-IR, Fourier transform infrared spectroscopy
Diagnostic test characteristics
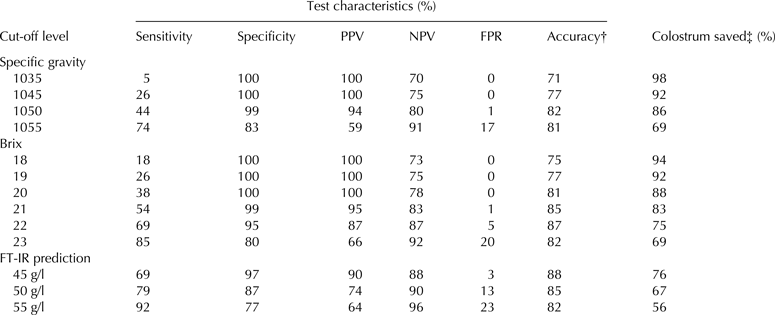
The optimal test for IgG concentration would allow that only high quality colostrum is fed to calves and allow that only low quality colostrum is discarded. To ensure this, it is important to use appropriate cut-off levels of the fast method that corresponds as well as possible to the real IgG values >50 g/l. Diagnostic test characteristics were established for SG, Brix and FT-IR with different cut-off levels for each method (Table 4). For SG the two cut-off levels suggested by the manufacturer were tested as well as higher levels. For Brix, Bielmann et al. (Reference Bielmann, Gillan, Perkins, Skidmore, Godden and Leslie2010) suggested Brix 22 as an appropriate cut-off level, Quigley et al. (Reference Quigley, Lago, Chapman, Erickson and Polo2013) suggested using Brix 21 for cut-off level, and in a recent study Morrill et al. (Reference Morrill, Robertson, Spring, Robinson and Tyler2015) suggested using Brix 18 as cut-off level for Jersey colostrum. In another recent study, Bartier et al. (Reference Bartier, Windeyer and Doepel2015) suggested an even higher cut-off at Brix 23. For the FT-IR predictions 45, 50, and 55 g/l were used for cut-off levels in Table 4.
Diagnostic test characteristics for use of fast methods to predict that colostrum contains at least 50 g/l of IgG as measured by ELISA
Positive value is detection of <50 g of IgG/L colostrum
ELISA, enzyme-linked immunosorbent assay; PPV, positive predictive value; NPV, negative predictive value; FPR, false positive rate; FT-IR, Fourier transform infrared spectroscopy
† Percentage of samples correctly classified as high or low
‡ Number of samples declared high (≥50 g of IgG/L). Analysis by ELISA indicated overall 69% of the samples should be saved
The sensitivity of a test is the probability for detection of colostrum samples of low quality, maximising this number therefore increases the possibility of detecting and discarding low quality colostrum. On the other hand, as the sensitivity increases the risk of discarding good quality colostrum, the false positive rate (FPR), also increases. The results from the SG diagnostic test showed that for both cut-off values suggested by the manufacturer (1035 and 1045) the sensitivity and accuracy was low (Table 4). This means that by using SG at both of the suggested cut-off levels a lot of poor quality colostrum will be saved and no good colostrum will be discarded. If the colostrometer is used, we therefore recommend using a cut-off level at 1050, where the accuracy is optimal.
When Brix is used for testing colostrum, the diagnostic test showed increasing values for sensitivity at increasing cut-off levels, whereas the accuracy reached maximum at Brix 22 (Table 4). Our data could not sustain to use a lower cut-off level for Jersey than Holstein breed, as many of the Jersey cows that had IgG < 50 g/l colostrum showed higher Brix than 19, and using a general cut-off level 18 or 19 resulted in low sensitivity and accuracy (Table 4). The accuracy was highest at cut-off level Brix 22 compared to Brix 21 (87% vs. 85%); however the risk of discarding good quality colostrum was also higher at cut-off level Brix 22 (FPR 5% vs. 1%). Bartier et al. (Reference Bartier, Windeyer and Doepel2015) suggested using cut-off level Brix 23, as this gave the best result regarding the sum of sensitivity and specificity. However, with our data a change from cut-off at Brix 22 to Brix 23 would increase the risk of discarding good colostrum to 20% (FPR, Table 4). A sample testing lower than Brix 22 has a 87% chance of being of truly inadequate quality (PPV in Table 4), whereas a sample testing higher than Brix 22 has an 87% chance of being of truly adequate quality (NPV in Table 4), given the prevalence of poor and adequate IgG content in colostrum gathered in this study. We therefore suggest using Brix 21 in shortage of good colostrum from other cows, and Brix 22 in case of having excess of good colostrum.
The result from using FT-IR for prediction of IgG concentration in colostrum is only slightly better than using Brix. As FT-IR is a more complex and expensive method than Brix, Brix is therefore a more feasible method for quality control of IgG concentration in colostrum giving comparable results.
Conclusions
Of the tested methods Brix is the best alternative to predict IgG concentration in bovine colostrum concerning price, practicality and precision and we suggest using a cut-off level at Brix 22. Specific gravity, Brix, and FT-IR all rely for the prediction of IgG on the indirect correlation to total protein. The composition of colostrum including the ratio of IgG per total protein varied a lot meaning that the prediction is far from perfect and cannot be improved as the methods used are all based on the indirect correlation between IgG and total protein. The high variation in composition makes it complicated to develop optimal measures of IgG in colostrum both in the laboratory and on-site at the farm. There is still a need to find a method with a more direct prediction of IgG concentration in colostrum that can be used on-site at the farm.
The authors thank the participating farmers for sample collection. The study was financially supported by Danish Cattle Levy Foundation.