INTRODUCTION
Solid cattle manure is a valuable source of nitrogen (N) for plants, but may cause agro-environmental problems if its utilization is inefficient due to poor management. Nitrogen can be lost from the manure either as ammonia (NH3) and nitrous oxide (N2O) in the air, or as nitrate (NO3−) in the surface and groundwater. The NH3 and greenhouse gases such as N2O, methane (CH4) and carbon dioxide (CO2) emissions from livestock farming systems are a concern due to their possible/potential adverse environmental effects (Groot Koerkamp et al. Reference Groot Koerkamp, Metz, Uenk, Phillips, Holden, Sneath, Short, White, Hartung, Seedorf, Schröder, Linkert, Pedersen, Takai, Johnsen and Wathes1998; Jeppsson Reference Jeppsson1999; Amon et al. Reference Amon, Amon, Boxberger and Alt2001; Oenema et al. Reference Oenema, Wrage, Velthof, Van Groenigen, Dolfing and Kuikman2005). High NH3 emissions can cause acidification and eutrophication of oligotrophic ecosystems, and enhanced deposition of NHx together with sulphate particles, which may alter the net irradiance among the various atmospheric layers (Sutton & Fowler Reference Sutton and Fowler2002). Furthermore, it can react with other complex compounds to form particulate matter that may cause haze and reduce natural visibility. Nitrous oxide and CH4 emissions contribute to global warming by destroying the stratospheric ozone layer (Crutzen Reference Crutzen and Delwiche1981). Emission of all these gases may occur in each component of the solid cattle manure management chain, i.e. animal housing, manure storage and manure application, but the highest losses are likely associated with the storage phase (Hutchings et al. Reference Hutchings, Sommer, Andersen and Asman2001).
After excretion in barns, solid cattle manure is either applied directly to the field, or stockpiled and/or composted in the open air for a certain period of time prior to field application. When uncovered, the stored manure is subjected to ambient environmental conditions (i.e. rainfall, temperature, wind and radiation), which influence gaseous emissions and leaching of N from the heaps (Kirchmann Reference Kirchmann1985). These losses may not only contribute to environmental pollution, but also reduce the N fertilizer value of manure. Turning of the manure heap during composting exposes the fresh inner material to microbial colonization, which increases the manure decomposition rate and hence the temperature inside the heap. Additionally, the inner voids of the heap are exposed to the air, which will boost gaseous emissions (Amon et al. Reference Amon, Amon, Boxberger and Alt2001; Parkinson et al. Reference Parkinson, Gibbs, Burchett and Misselbrook2004; Sagoo et al. Reference Sagoo, Williams, Chambers and Boyles2005). Some farmers stockpile solid cattle manure in a roofed building with the aim of protecting it against precipitation and therefore reducing leaching losses in particular (Mosquera et al. Reference Mosquera, Hol and Monteny2006); however, this is not a common practice. All these storage methods result in substantial gaseous emissions and leaching of up to 0·50 of the initial N content from the heaps (Eghball et al. Reference Eghball, Power, Gilley and Doran1997; Petersen et al. Reference Petersen, Lind and Sommer1998; Shah et al. Reference Shah, Groot, Oenema and Lantinga2012a).
Several practices have been proposed to reduce the solid cattle manure storage N losses. These include compaction and/or covering of manure heaps, use of chemical as well as biochemical additives, and application of additional straw (Sommer & Møller Reference Sommer and Møller2000; Chadwick Reference Chadwick2005; Yamulki Reference Yamulki2006; Ndegwa et al. Reference Ndegwa, Hristov, Arogo and Sheffield2008). It has been shown that NH3 emissions from solid cattle manure can be reduced by up to 80% through covering the heap with a tarpaulin sheet compared to an uncovered control (Sagoo et al. Reference Sagoo, Williams, Chambers, Boyles, Matthews and Chadwick2007). Chadwick (Reference Chadwick2005) reported that compaction and subsequent covering of a manure heap can reduce NH3 and N2O emissions by c. 90 and 30%, respectively. Application of chemical and biochemical additives has the potential to reduce NH3 emissions substantially, perhaps by as much as 100% (Ndegwa et al. Reference Ndegwa, Hristov, Arogo and Sheffield2008). Application of additional straw to solid manure has been shown to reduce N2O emission by 57% compared to a heap without additional straw (Yamulki Reference Yamulki2006). However, straw addition might increase dry matter (DM) and NH3 losses by promoting aerobic conditions inside the heap (Kirchmann Reference Kirchmann1985). Despite all these efforts, there are still large uncertainties in the emission estimates from the basket of storage methods whilst the routes of N loss are not yet well quantified.
Storage conditions not only affect the level of N losses but also determine the characteristics of the end product, which can be decisive for subsequent N release for crop uptake after manure application (Kirchmann Reference Kirchmann1985; Shah et al. Reference Shah, Groot, Oenema and Lantinga2012a; Rashid et al. Reference Rashid, De Goede, Brussaard and Lantinga2013). Anaerobic storage results in the production of low molecular compounds, i.e. volatile fatty acids, alcohols and phenols, and higher contents of ammonium-N (NH4+-N; Kirchmann Reference Kirchmann1985; Thomsen & Olesen Reference Thomsen and Olesen2000). Composting transforms a part of the easily degradable N leading to the formation of stable N compounds with a relatively low C/N ratio. Consequently, microbial decomposition and mineralization activities after application of composted manure to soil will be lower as compared to anaerobically stored manure (Thomsen & Olesen Reference Thomsen and Olesen2000; Shah et al. Reference Shah, Groot, Oenema and Lantinga2012a). For instance, Shah et al. (Reference Shah, Groot, Oenema and Lantinga2012a) found a 35% higher plant N utilization from the latter manure type during the year of application.
The objectives of the current study were therefore to quantify the effects of contrasting storage methods of solid cattle manure on (i) total C and N balances during storage, and (ii) apparent N recovery (ANR) from both field applied N (ANRF) and collected N from the barn (ANRB), after application to maize cropped land.
MATERIALS AND METHODS
Storage treatments
Fresh solid cattle manure was collected from a naturally ventilated sloping-floor litter-barn with young beef cattle, where chopped cereal straw was used as bedding material at a daily rate of 5 kg per livestock unit. Immediately thereafter, portions of 10 t manure were put on a clean concrete floor to make conical heaps with a height of c. 1·5 m and a base diameter of c. 5 m. There were four manure storage methods: (i) stockpiled heap in the open air; (ii) roofed heap: stockpiled heap under a plastic roof; (iii) covered heap: stockpiled heap covered with an impermeable plastic sheet; and (iv) turned heap with monthly turnings. All the treatments were arranged in a randomized complete block design with three replicates. The manure heaps were built in bunkers bounded on three sides by one course of concrete blocks (c. 0·5 m high) and a ridge of sand forming the fourth side (c. 0·3 m high), facilitating the collection of leachates and access for a tractor with front end-loader for turning the heaps. For each of the covered heaps, an impermeable plastic sheet (0·15 mm thick polyethylene film) was used, which was lined at its bottom and at the top. The edges of the plastic sheet were covered with sand-filled plastic sacks in order to block the inflow of air into the heap. For each roofed heap, an artificial roof was built by mounting a thick impermeable plastic sheet (0·15 mm thick polyethylene film) on four curved iron posts each, with a height of 4 m in the middle. The manure was stored for 160 days starting from the first week of December 2009 until the second week of May 2010. On the last day of the storage phase, all the heaps were weighed.
Manure sampling and analyses
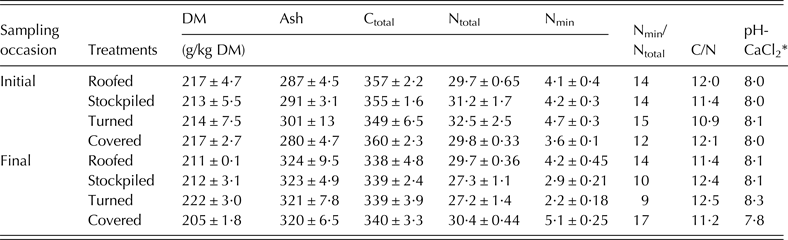
At the start and end of the storage period, three composite samples (c. 2 kg fresh wt.) were collected from each heap. Each composite sample consisted of 20–30 sub-samples taken by hand from different locations in a heap. The samples were stored at −18 °C until analysis in order to prevent N transformations. Before analysis, the samples were thawed at room temperature (20 °C) and subsequently chopped with a cutting machine in order to cut straw particles into small pieces (⩽2 cm) (Sommer & Dahl Reference Sommer and Dahl1999). From this material, representative sub-samples of c. 100 g were analysed for total N, NH4+-N, nitrate-N (NO3−-N), pH, DM and raw ash (Table 1). Total N was measured after Kjeldahl digestion (MAFF1986), while NH4-N and NO3-N were measured in a 1:10 manure/0·01 M CaCl2 extract by means of segmented-flow analysis (Houba et al. Reference Houba, Van Der Lee, Novozamsky and Walinga1989). The pH was measured in the same extract using a pH meter (inoLab pH meter level 1, WTW GmbH & Co. KG, Germany). Dry matter was determined after drying the samples at 105 °C for 24 h (Anonymous 1998). Subsequently, raw ash content was determined gravimetrically through ignition of the dried samples at 525 °C for 6 h (Anonymous 1998) with organic matter (OM) being equal to the ignition losses. Total C was assumed to be 0·50 of the OM (Pettygrove et al. Reference Pettygrove, Heinrich and Eagle2009). Total DM, C and N losses during the storage period were measured through the mass balance method by comparing their contents just before and at the end of the storage phase.
Chemical composition of solid cattle manure (means and s.e.; n = 3) at the start and end of the storage period

* s.e. < 0·1.
Measurement of gaseous concentrations and calculation of their fluxes
Fluxes of NH3, N2O, CO2 and CH4 from the surface of manure heaps were quantified using a static flux chamber connected to a photo-acoustic gas monitor (INNOVA 1412A, Luma Sense Technologies, Ballerup, Denmark; Predotova et al. Reference Predotova, Schlecht and Buerkert2010) by two Teflon tubes (internal diameter = 3 mm) each of 1·5 m long. The tubes were made of polyvinyl chloride (PVC), which is known to have low NH3 adsorption capacity (Shah et al. Reference Shah, Grabow and Westerman2006). The gas monitor had a built-in pump for recirculation of gases in the flux chamber. The flux chamber had a sharp bottom edge and an internal diameter of 0·3 m. The total internal volume of the chamber was 2·12 × 10−2 m3. The measurements were done on daily to bi-weekly intervals. At each measurement event, the flux chamber was gently pressed down 4 cm deep into the surface of the manure heap. Thereafter, time patterns of NH3, N2O, CO2 and CH4 concentrations were recorded for 10 min. Measurements were made from three random places of the roofed, stockpiled and turned heaps on 20 different days during the storage period. These measurements were not possible from the covered heaps. The photo-acoustic gas monitor was calibrated by its manufacturer company (ENMO, Vosselaar, Belgium) and had built-in compensation for cross-interferences of CO2 and water vapour with NH3, N2O and CH4. The calibration was done in April 2009 and May 2010, and the monitor was found to perform well on both occasions. However, during validation sessions for the above measuring set-up, Predotova et al. (Reference Predotova, Schlecht and Buerkert2010) found the average errors for NH3, N2O, CO2 and CH4 of −13, −12, 5 and −2%, respectively, resulting in possible slight underestimation of N losses.
Instantaneous emission rates of NH3, N2O, CO2 or CH4 were calculated from the fitted (initial) linear slope of gas concentration (mg/m3) v. time (min). Small negative emission rates that occasionally occurred, especially at the end of the storage period, were set to zero. The gaseous emission rates (R) for the manure heap in units of mg/m2/h were calculated as:
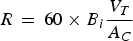 $$R\, = \,60 \times B_i \displaystyle{{V_T} \over {A_C}} $$
where 60 is the conversion factor for up-scaling mg/min to mg/h, B i is the fitted (initial) linear slope of the data between NH3, N2O, CO2 or CH4 concentrations and time (mg/m3/min), V T is the total volume of the air inside the monitoring system during measurement (1·82 × 10−2 m3) and A C is the surface area of the solid manure heap covered by the flux chamber (7·07 × 10−2 m2). The V T was calculated by subtracting the reduced volume of the flux chamber (after inserting into the solid manure heap) (3·18 × 10−3 m3) from the total internal volume of the chamber (2·12 × 10−2 m3) and subsequently adding the internal volume of the PVC tubes (1·41 × 10−5 m3) and the air volume inside the gas monitor (1·4 × 10−4 m3).
Emission totals for NH3-N, N2O-N, CO2-C and CH4-C were calculated by averaging the emission rates between two consecutive sampling dates and multiplying by the time elapsed between these two points (e.g. Chadwick Reference Chadwick2005; Moral et al. Reference Moral, Bustamante, Chadwick, Camp and Misselbrook2012). The emissions were up-scaled from mg/m2 to kg/heap by multiplying it by the surface area of the heaps, which was measured periodically during the storage period. Subsequently, the emission values were summed for the whole storage period.
Finally, the N losses unaccounted for (UNL) as a proportion of the established total N losses (TNL in kg/heap) were calculated by:
 $$\eqalign{ &{\rm UNL\; (\% \; of\; total\; losses)}\, \cr & = \,100 \times {\rm \;} \displaystyle{{({\rm TNL\;} -{\rm \; NH}_3 \hbox{-} {\rm N}\,-\,{\rm N}_2 {\rm O}{\hbox{-}} {\rm N}- {\rm N}\,{\rm leached})} \over {{\rm TNL}}} }$$
The C losses unaccounted for (UCL) as a proportion of the established total C losses (TCL in kg/heap) were calculated by:
 $$ \eqalign{& {\rm UCL\; (\% \; of\; total\; losses)}\cr &= \,100 \times {\rm \;} \displaystyle{{({\rm TCL}\,-\,{\rm CO}_2 \hbox{-} {\rm C}-\,{\rm CH}_4 \hbox{-} {\rm C} - {\rm C\; leached})} \over {{\rm TCL}}} } $$
Collection of leachates
The concrete floor of each bunker sloped towards one wall, to facilitate the collection of effluent in the adjacent concrete collection tanks. The tanks, each measuring 5 × 1 × 1·5 m, were constructed under the soil surface and covered with concrete blocks to avoid the direct addition of rain water. From each individual tank, leachates were collected four times throughout the whole storage period and the total volume was measured. To this end, leachates were stirred mechanically and representative samples of c. 1 litre per tank were taken. Thereafter, the samples were analysed for total N, NO3−-N, NH4+-N, C, DM and ash content according to the procedures as described previously.
Temperature and precipitation measurements
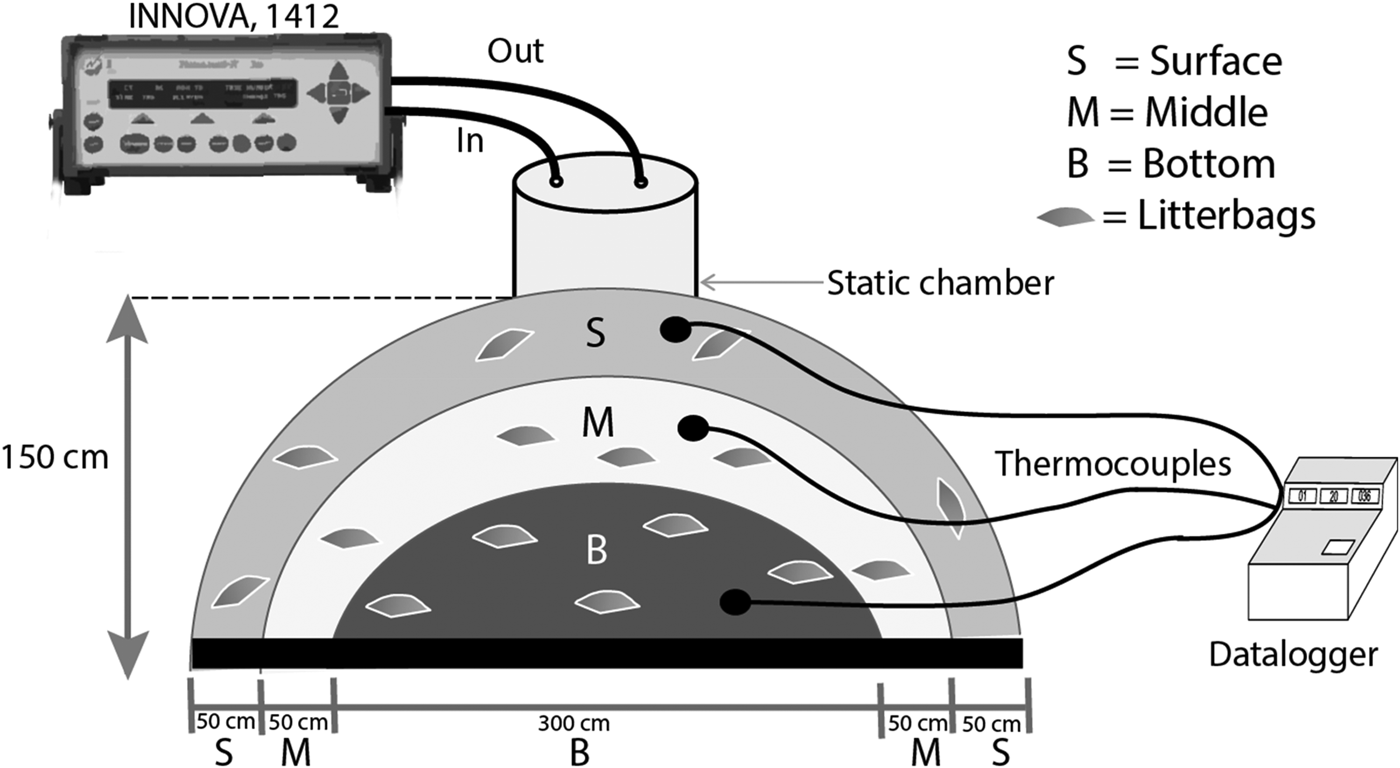
Throughout the storage period, heap temperatures were automatically recorded at 1 h intervals at depths of 0·5 m (surface), 1·0 m (middle) and 1·5 m (bottom) using thermocouples connected to a data logger (Data taker DT 200, Data electronics Ltd, Australia; Fig. 1). The thermocouples were inserted permanently in the stockpiled, roofed and covered heaps, whereas in case of the turned heap they were removed just before a turning event and re-inserted thereafter in the respective layers. Three thermocouples were left outside in the open air in order to measure the ambient temperature at 0·5 m high. Precipitation was measured during the whole experimental period with a rain gauge in the experimental area.
Schematic diagram of the cross-section of a manure heap.
Mass balance through litterbag technique
The purpose of using the litterbag technique was to establish mass balances at small scale in order to minimize the possibility of manure sampling errors. In addition, it allowed the effect of heap layers on constructed mass balances to be seen. To this end, for each heap a total of 15 litterbags, each measuring 10 × 10 cm and made of nylon with 1 mm mesh, were filled with 100 g of fresh solid cattle manure. After filling, they were closed firmly with long nylon strings and placed randomly at three depths (surface, middle and bottom) of each heap, i.e. 5 litterbags per layer (Fig. 1). One end of the string was marked with a non-decomposable tag and kept outside the heap in order to distinguish among the layers. In the turned heaps, all the litterbags were removed just before turning and placed back thereafter in the respective layers. At the end of the storage period, litterbags from all heaps were collected carefully and the leftover materials were weighed and analysed for total N, NH4+-N, NO3−-N, DM, total C and raw ash according to the procedures described above. Thereafter, total DM, C and N losses were calculated through the mass balance method.
Crop nitrogen recovery
After the storage phase, all the stored manure, together with fresh manure taken directly from the barn (29·7 g total N/kg DM, 3·7 g mineral N/kg DM and C/N ratio 12), were incorporated into the top layer of a sandy farm field (total N 1·1 g/kg, total C 26 g/kg, mineral N 0·8 g/kg and pH-KCl 5·23) at an application rate of 170 kg N/ha. Treatments comprised: (i) control (unfertilized), (ii) fresh manure, (iii) stockpiled manure, (iv) roofed manure, (v) covered manure and (vi) turned manure. All the treatments were arranged in a randomized complete block design with four replicates. The plot size was 15 × 4·5 m. One week after manure incorporation (on 19 May 2010), maize seeds (cultivar: Lapriora) were sown at a depth of 6 cm and a density of 11 plants/m2. In each plot, there were six rows of plants with a row spacing of 75 cm. The experimental area was weeded manually throughout the growing period. Maize was harvested at the beginning of grain filling (BBCH growth stage 71, Lancashire et al. Reference Lancashire, Bleiholder, Van Den Boom, Langelüddecke, Stauss, Weber and Witzenberger1991) to estimate above-ground DM yield and N uptake. Around this phenological development stage, i.e. before leaf senescence starts, total N content of field-grown maize plants reaches its peak value (G. A. Shah et al., personal communication). For this purpose, ten plants chosen randomly from the inner rows were cut to the ground level and the actual number of plants per plot was counted. Thereafter, fresh maize biomass was measured in the field and subsequently chopped with a cutting machine in order to take representative fresh samples of c. 500 g. Subsequently, the samples were oven-dried at 70 °C for 48 h, ground to pass 1 mm sieve and analysed for total N content through Kjeldahl digestion (MAFF 1986). Maize ANR in the field (ANRF) was calculated as
 $${\rm ANR}_{\rm F} (\% )\, = \,\displaystyle{{({\rm N}_{\rm m} \times {\rm DM}_{\rm m} ) - ({\rm N}_0 \times {\rm DM}_0 )} \over {{\rm TN}_{\rm a}}} \times 100$$
where Nm is the maize N content (kg N/kg DM) in the manured plots, DMm is the maize DM yield (kg/ha) in the manured plots, N 0 is the maize N content (kg N/kg DM) in the unfertilized plots, DM 0 is the maize DM yield (kg/ha) in the unfertilized plots and TNa is the total N applied with manure (kg/ha).
Thereafter, apparent maize N recovery of the N collected from the barn (ANRB) was calculated as
 $${\rm ANR}_{\rm B} ({\rm \%} )\, = \,\displaystyle{{({\rm TN}_{{\rm barn}} - {\rm \; TNloss}_{{\rm storage}} ) \times {\rm \; ANR}_{\rm F}} \over {{\rm TN}_{{\rm barn}}}} $$
where TNbarn is the total amount of manure N taken from the barn (kg), TNlossstorage is the total N lost during storage (kg) and ANRF is the apparent maize N recovery in the field (%).
Statistical analysis
The measurements for emissions of NH3, N2O, CH4 and CO2, N leaching and mass balances (DM, C and N) through litterbags were restricted to only one replication because of practical constraints. Emissions of NH3, N2O, CO2 and CH4 determined at three random places in each manure heap were averaged per heap and per measurement event. Results from the litterbags at each layer and treatment were also averaged. The mean values of all these variables were used to make relative comparisons among the treatments.
Total DM, C and N losses from the heaps during storage, and maize crop N recovery after manure application in the arable field were statistically analysed using analysis of variance (ANOVA) in Genstat (13th Edition, VSN International, Hemel Hempstead, UK). When the overall main effects were significant (P < 0·05), differences among treatments were further compared using a Duncan's multiple range test for all variables.
RESULTS
Total dry matter, carbon and nitrogen losses
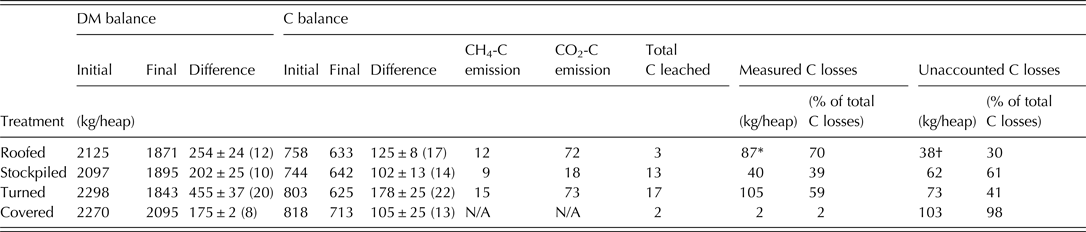
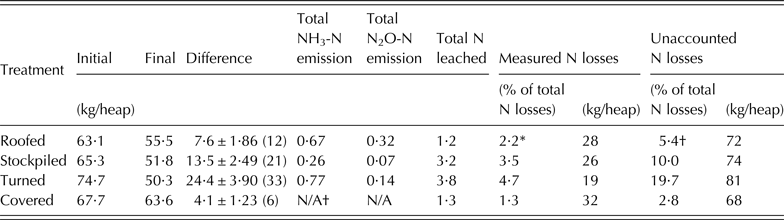
Mass balances revealed that the highest total DM, C and N losses occurred in the turned heap and were lowest in the covered heap (Tables 2 and 3; P < 0·05). On average, 10% of the initial DM from the stockpiled, 12% from the roofed, 8% from the covered and 20% from the turned heaps were lost. The respective values for total C losses were 14, 17, 13 and 22% (Table 2). About 21% of the initial Ntotal was lost from the stockpiled heap, v. 12% from the roofed, 6% from the covered and 33% from the turned heaps (Table 3). Total DM, C and N losses (% of initial) from the litterbags (Table 4) were in line with their respective values derived from the mass balance at the heap level (Table 4v. Tables 2 and 3). Overall, both DM and C losses were apparently higher from the surface layer of the roofed heap in comparison with the other two layers. However, there seemed no difference among the three layers of the stockpiled, turned and covered heaps (Table 4). Nitrogen losses (% of initial) were apparently higher from the surface layer of the stockpiled heap, whereas these were lower from the bottom layer of the roofed heap as compared to the two other layers. In case of the turned and covered heaps there appeared to be no difference (Table 4).
Summary of dry matter (DM) and carbon (C) balances for solid cattle manure stored under different conditions (n = 3)
Values in the parenthesis are the percentages of the initial amount.
N/A, not applicable.
* Measured C losses (kg/heap) = (CO2-C + CH4-C + Total C leached).
† Unaccounted C losses (kg/heap) = (Initial total C − Final total C) − measured C losses.
Summary of nitrogen (N) balance for solid cattle manure stored under different conditions (n = 3)
Values in the parenthesis are percentages of the initial amount.
N/A, not applicable.
* Measured N losses (kg/heap) = (NH3-N + N2O-N + Total N leached).
† Unaccounted N losses (kg/heap) = (Initial total N − Final total N) − measured N losses.
Dry matter (DM), carbon (C) and nitrogen (N) balances of litterbags placed in the surface, middle and bottom layers of the solid cattle manure heaps (n = 5)
Gaseous emissions and unaccounted losses
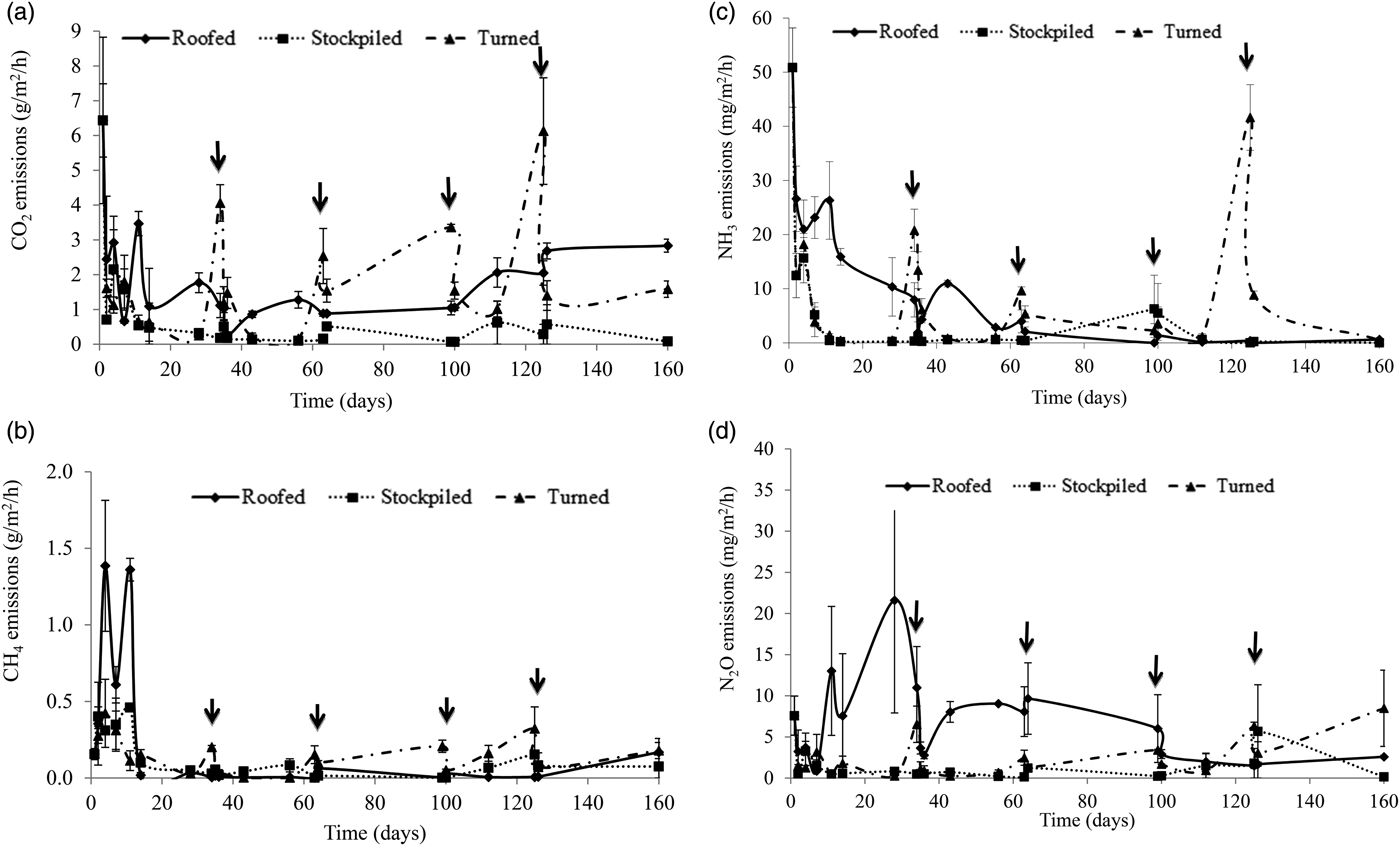
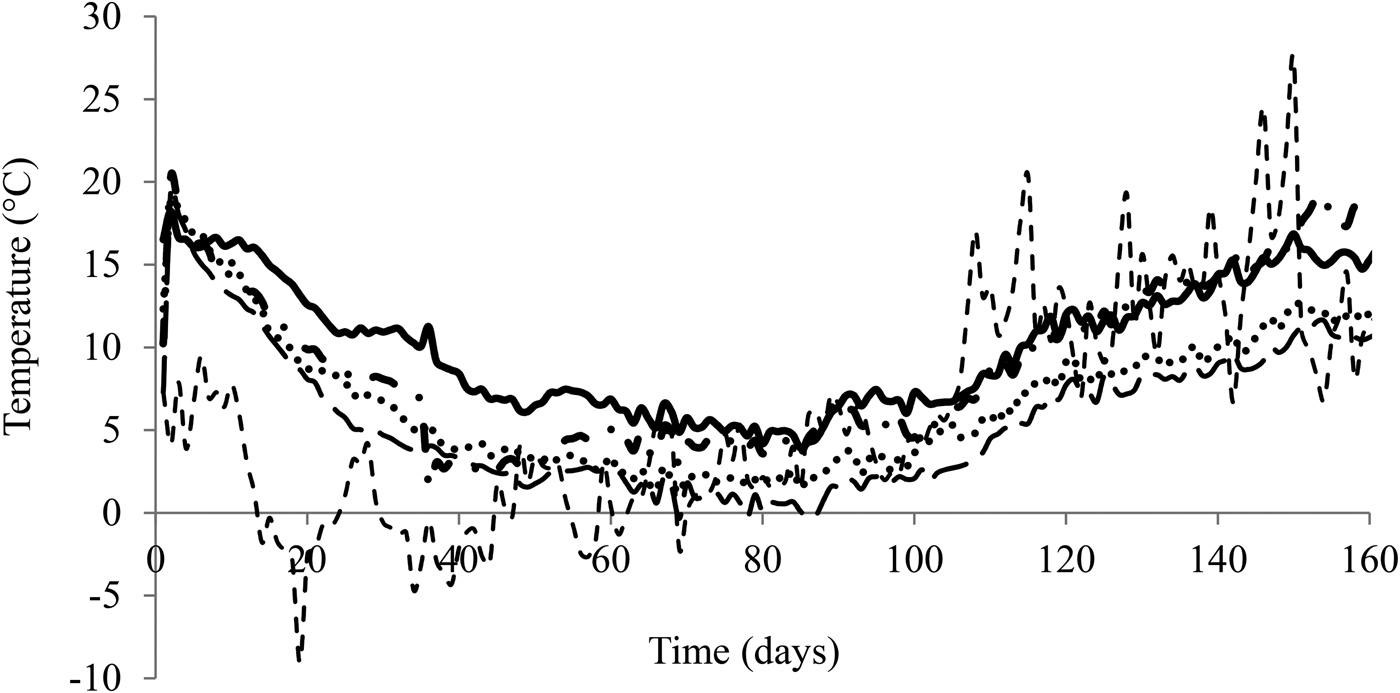
Emissions of NH3, CO2 and CH4 peaked a few days after heap establishment and declined gradually thereafter (Figs 2(a)–(c)). These patterns were closely correlated with the temperature decrease during the winter period (Fig. 3). The CO2 emissions were relatively lower from the stockpiled heap than from the roofed and turned heaps. In the turned treatment, CO2 losses were increased after each turning event, especially at day 127 (Fig. 2(a)). During the first 2 weeks of the storage period, CH4 emissions from the roofed heap were about three times higher than from the turned and stockpiled heaps (Fig. 2(b)). After this initial storage phase, there were only small differences among these three heap types. Over the whole storage period, total measured gaseous and liquid C losses were c. 39, 59 and 70% of the total C losses from the stockpiled, turned and roofed heaps, respectively (Table 2). The respective shares of total CO2-C and CH4-C emissions together in these measured losses were 68, 84 and 97%, whereas the remainder was lost through C leaching. Overall, c. 61% of the total C losses from the stockpiled, 41% from the turned and 30% from the roofed heaps were thus unaccounted for (Table 2).
Emissions of (a) CO2, (b) CH4, (c) NH3 and (d) N2O over time from the manure heap surface during the storage period. Error bars represent s.e. (±) of the mean and arrows show manure turning events for the composted heaps.
Average temperature at the depth of 1 m from surface of the manure heaps during the storage period.
Emissions of NH3 increased after each turning event in the turned heaps, especially at the last turning event (Fig. 2(c)). In the stockpiled heaps, NH3 emissions dropped to values close to zero within 10 days after heap establishment. Similarly, N2O emissions were only marginal after 1 week of heap establishment from the stockpiled treatment until day 100 (Fig. 2(d)). Consequently, the measured total N2O-N emissions from the stockpiled heap were two to four times lower compared to the turned and roofed heaps (Table 3). Nitrogen leaching from the stockpiled and turned heaps was about three times higher than from the covered or roofed heaps (Table 3). Of the total measured gaseous and liquid N losses together, the cumulative emissions of NH3-N and N2O-N were only 9% from the stockpiled, 19% from the turned and 45% from the roofed heaps. The respective N leaching losses constituted 91, 81 and 55%. From the covered heap, all measured N losses refer to leaching processes (32% of the total N losses) as gaseous emissions could not be measured. On average, 74% of the total storage N losses from all of the manure heaps subjected to various storage conditions could not be accounted for. These unaccounted losses were highest (81% of the total N losses) for the turned and lowest (68%) for the covered heaps, whereas the roofed and stockpiled heaps took an intermediate position with respective values of 72 and 74% (Table 3).
Temperature inside the heaps
Temperature inside the manure heaps increased initially to about 20 °C, decreased subsequently and then increased again after day 100 (Fig. 3). On average, temperature was higher in the roofed and turned heaps as compared to the stockpiled and covered heaps. For each storage treatment, there was only a slight difference among the heap layers; therefore, only the temperature pattern over time from the middle layer is presented in Fig. 3.
Crop nitrogen recovery
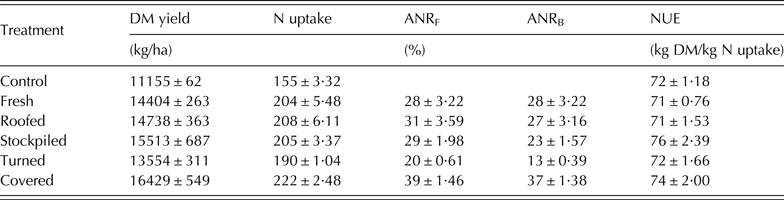
Maize DM yield, N uptake, ANRF and ANRB are presented in Table 5. Type of manure storage method had a great impact on all of these parameters. Values of ANRF were highest from covered manure and lowest in case of turned manure (39 v. 20% of the applied N; P < 0·05). Moreover, the ANRB value of covered heaps was found to be almost three times higher than turned manure (37 v. 13%; Table 5). For both of these ANR parameters, there was no difference among stockpiled, roofed and fresh manures (Table 5). Finally, the storage methods had no influence on crop N use efficiency (expressed as kg DM/kg N uptake), since treatment differences in DM yield were absent at a given level of N uptake (Table 5).
Average (n = 4) maize apparent N recovery from solid cattle manures expressed as fraction of total N applied to the field (ANRF) and as fraction of total N taken from the barn (ANRB)
DISCUSSION
Total dry matter and carbon losses during storage of solid cattle manure
Solid cattle manure is subjected to microbial transformations, chemical reactions and natural drainage during the storage period, which results in losses of moisture, DM and nutrients (Chadwick Reference Chadwick2005). In the current experiment, all the heaps had decreased noticeably in size at the end of the storage period and DM losses were larger from the turned heaps than from the other treatments. Most of this loss in DM is attributed to the emission of CO2 and CH4 because C constitutes a substantial part of the OM (Sommer & Dahl Reference Sommer and Dahl1999). The emission rates of both CO2 and CH4 were higher during the first 2 weeks after heap establishment, declined thereafter and increased again towards the end, coinciding with the patterns of heap temperature.
Total CH4-C emissions were of the order of 1–2% of the initial C content and fell in the range of 0·4–9·7% of the initial C during storage of solid beef cattle manure as established by Chadwick (Reference Chadwick2005). Total emissions of CO2-C were just over 2–10% of the initial C, with the smallest losses occurring from the stockpiled heaps. From all treatments, the measured C losses (CH4-C, CO2-C and leaching) were on average 54% of total C losses determined through the mass balance method. This relatively low proportion might be partly explained by errors in the estimates of total CH4-C and CO2-C emissions (i.e. unmeasured gaseous emission during turning operations) as their cumulative figures were calculated from a number of measurements at discrete points rather than continuous measurement (Chadwick Reference Chadwick2005; Moral et al. Reference Moral, Bustamante, Chadwick, Camp and Misselbrook2012). Moreover, there would be a partial diversion of gas fluxes from underneath the chamber to its outer sides through convection, since manure is a highly porous material. However, there might have been other unmeasured gaseous C losses involved such as non-CH4 volatile organic compounds (Misselbrook et al. Reference Misselbrook, Cape, Cardenas, Chadwick, Dragosits, Hobbs, Nemitz, Reis, Skiba and Sutton2011) and carbon monoxide (Hellebrand & Kalk Reference Hellebrand and Kalk2001). This underestimation of measurement is not a matter of concern since the objective of the present study was to compare treatment effect and not to quantify total gaseous fluxes.
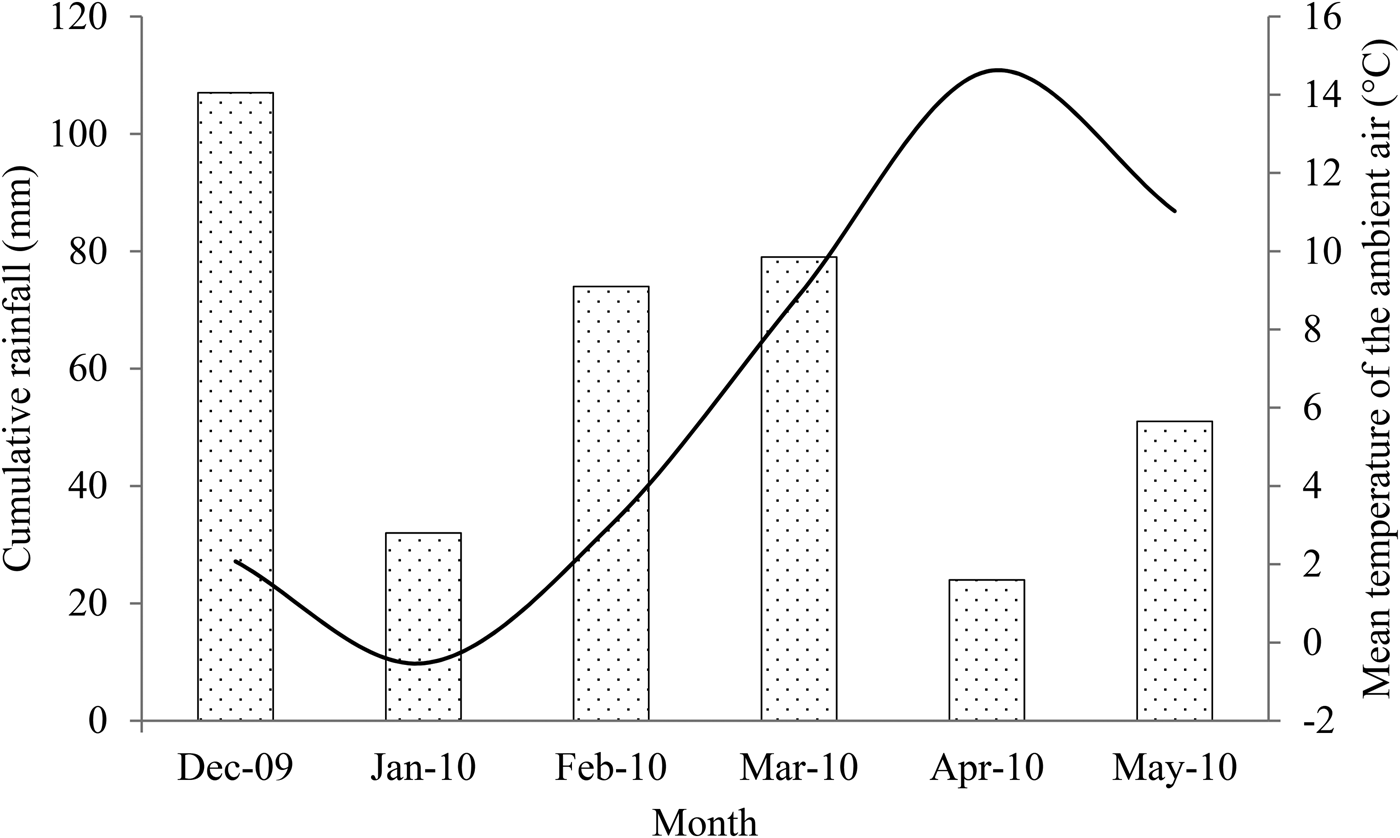
Total storage C losses in the current experiment were lower than observed in a number of other studies (Sommer & Dahl Reference Sommer and Dahl1999; Chadwick Reference Chadwick2005; Larney et al. Reference Larney, Buckley, Hao and McCaughey2006). This could be explained by the relatively cold winter with freezing temperatures as reflected in the measured ambient air temperatures. However, the losses established in the present study corroborate those by Moral et al. (Reference Moral, Bustamante, Chadwick, Camp and Misselbrook2012), who also found lower C losses due to heavy rainfall and low temperatures. In the present study the ambient temperature dropped below zero after 2 weeks of heap establishment followed by a freezing period of about 40 days. In spite of the severe winter, the storage method had a significant effect on DM and C losses with highest values in case of the turned heaps. In all probability, this was associated with a higher level of aerobic decomposition as a result from diffusion of air into the straw-based heaps through the turning operations (Parkinson et al. Reference Parkinson, Gibbs, Burchett and Misselbrook2004). The heat derived from these aerobic decomposition processes increases temperature inside manure heaps (Hansen et al. Reference Hansen, Henriksen and Sommer2006). On the contrary, covering the manure blocks air circulation in the heap and thus creates anaerobic conditions. Anaerobic degradation of OM restricts microbial activities and does not increase temperature which ultimately reduces the overall loss of C (Hansen et al. Reference Hansen, Henriksen and Sommer2006). However, there was little change in C/N ratio after storage since the initial C/N ratio of the material was quite low. The latter is ascribed to the feeding strategies of Droevendaal farm, where the manure was collected for the current experiments. On this farm, grass silage with high protein and low-fibre content due to relatively early grass cutting is offered to the heifers, thus resulting in manure with relatively low C/N ratio.
Nitrogen losses during storage of solid cattle manure
The total established losses of 21 and 33% of the initial N from the stockpiled and turned heaps in the current experiment are in line with Parkinson et al. (Reference Parkinson, Gibbs, Burchett and Misselbrook2004). Covered storage reduced these N losses by a factor of about five. Consequently, mineral N content in covered manure at the end of the storage period was greatly increased. This increase is important from an agronomical viewpoint especially in case of organic agricultural practices where the use of artificial fertilizer is prohibited. However, due to both the increased mineral N content and pH of covered manure, compensatory losses may occur through increased NH3 emissions after its land application, when left untreated (Amon et al. Reference Amon, Boxberger, Amon, Zaussinger, Pollinger, Voermans and Monteny1997, Reference Amon, Amon, Boxberger and Alt2001). Benefits of manure covering can be maximized through soil incorporation (Webb et al. Reference Webb, Sommer, Kupper, Groenestein, Hutchings, Eurich-Menden, Rodhe, Misselbrook and Amon2012), irrigation or using additives which adsorb ammonium, such as lava meal (Shah et al. Reference Shah, Shah, Groot, Oenema and Lantinga2012b).
The NH3-N emission rates measured were between 0·4 and 1·1% of the initial total N from all of the heaps, which fell in the range of 0·3–4·5% of initial N, as reported in the literature (Petersen et al. Reference Petersen, Lind and Sommer1998; Sommer & Dahl Reference Sommer and Dahl1999; Chadwick Reference Chadwick2005; Moral et al. Reference Moral, Bustamante, Chadwick, Camp and Misselbrook2012). The NH3 emission was higher from the roofed and turned heaps compared to the stockpiled heap in the open air. In the case of turned heaps, turning increased air exchange through the materials and stimulated aerobic decomposition processes which will stimulate the process of NH3 emission (Amon et al. Reference Amon, Amon, Boxberger and Alt2001; Parkinson et al. Reference Parkinson, Gibbs, Burchett and Misselbrook2004). Visual observations during the experimental work revealed that the surface of the roofed heaps remained open and porous, especially during the first month of storage, allowing NH3 to diffuse easily into the atmosphere. On the other hand, the heaps stockpiled in the open air were subjected to the exposure of weather (wetting and drying), which led to the formation of a surface crust and thereby creating a physical barrier to gaseous N emissions (Sagoo et al. Reference Sagoo, Williams, Chambers, Boyles, Matthews and Chadwick2007).
Covering manure heaps with an impermeable sheet inherently blocks air circulation and forms a physical barrier that prevents NH3 diffusion to the atmosphere (Kirchmann Reference Kirchmann1985; Hansen et al. Reference Hansen, Henriksen and Sommer2006). Further, the formation of nitrate and nitrite, and thereby also the occurrence of denitrification losses, is restricted under anaerobic conditions (Kirchmann Reference Kirchmann1985). However, leaching losses are unavoidable because of natural seepage since compaction displaces effluents including nutrients out of the heap (Chadwick Reference Chadwick2005).
Of the total storage N losses from all treatments, about 2–9% was lost as NH3-N, 1–4% as N2O-N and 16–32% through leaching. Between 68 and 81% of the total N losses were unaccounted for. These are in the range of 38–92% of the total N losses from solid cattle manure storage as observed by Sommer & Dahl (Reference Sommer and Dahl1999). The relatively low fraction of N losses accounted for in the current experiment might be partly explained by errors in the emission estimates (i.e. emissions during turning operations were not measured), since the cumulative figures were derived from a number of measurements at discrete points rather than continuous measurements (Chadwick Reference Chadwick2005; Moral et al. Reference Moral, Bustamante, Chadwick, Camp and Misselbrook2012). However, by far the greater part of these unaccounted N losses occurred in all probability in the form of the harmless dinitrogen gas, which is the end-product of denitrification (Petersen et al. Reference Petersen, Lind and Sommer1998; Harper et al. Reference Harper, Sharpe and Parkin2000; Chadwick Reference Chadwick2005). In heterotrophic denitrification, NO3− is reduced to N2 via NO2− in nitric oxide (NO) and N2O by denitrifying bacteria. In nitrifier denitrification, nitrifying bacteria reduce NO2− via N2O to N2 (Wrage et al. Reference Wrage, Velthof, Van Beusichem and Oenema2001; Oenema et al. Reference Oenema, Wrage, Velthof, Van Groenigen, Dolfing and Kuikman2005). These nitrifying and denitrifying bacteria are in general expected to be the principle producers of N2O gas. However, as total N2O-N emission during storage was only between 1 and 4% of the total N losses, it is assumed that the heterotrophic and nitrifier denitrification processes played only a minor role. For this reason, other processes such as methanotrophic denitrification, chemical denitrification and anaerobic ammonium oxidation (Anammox) were more likely to be dominant. In methanotrophic denitrification, nitrification–denitrification by methanotrophs which do not need oxygen has been acknowledged to produce N2 (Islas-Lima et al. Reference Islas-Lima, Thalasso and Gómez-Hernandez2004; Raghoebarsing et al. Reference Raghoebarsing, Pol, Van De Pas-Schoonen, Smolders, Ettwig, Rijpstra, Schouten, Sinninghe Damsté, Op Den Camp, Jetten and Strous2006; Modin et al. Reference Modin, Fukushi, Nakajima and Yamamoto2010). Pel et al. (Reference Pel, Oldenhuis, Brand, Vos, Gottschal and Zwart1997) reported substantial N2 losses (>93% of total N losses) during poultry manure composting due to methanotrophic denitrification. During chemical denitrification, spontaneous conversion of NH4+ and hydroxylamine (NH2OH) into N2 via hydrazine (N2H4) and diazene (N2H2) generally takes place at an alkaline pH (Nikolić & Hultman Reference Nikolić and Hultman2005). The anammox process occurs under anaerobic conditions by bacterial mediated combination of NH4+ and NO2− to form N2. Strous et al. (Reference Strous, Kuenen and Jetten1999) reported that the suitable pH range for this process was between 7·0 and 8·5 and the optimum was 8·0 with the highest N2 production rates. Since in all the treatments the pH was alkaline, this might have been the case in the present study.
In case of the turned and stockpiled heaps, N losses through leaching was much higher as compared to those by NH3-N and N2O-N emissions and could be attributed to the high rainfall amounts especially during the month of heap establishment (Fig. 4). Leaching losses were markedly reduced (>60%) by protection from rain in case of the roofed and covered heaps. Owing to relatively high rainfall during the first month after heap establishment, N leaching losses were more pronounced in this period than later. This was probably also affected by the depletion of the leachable N pool. During the first 3 months after heap establishment, N in the leachate was mainly in the form of NH4+-N and leachable organic N. Occurrence of NO3-N in the leachates only appeared in the month of April following a period of dry weather. The near absence of NO3-N is in line with previous observations from stockpiled and turned solid cattle manure heaps (Martins & Dewes Reference Martins and Dewes1992; Eghball et al. Reference Eghball, Power, Gilley and Doran1997; Petersen et al. Reference Petersen, Lind and Sommer1998).
Cumulative rainfall (bars) and mean ambient air temperature (line) during the storage period.
Crop nitrogen recovery
After field application, maize ANRF was lower from turned manure as compared to covered, stockpiled, roofed or fresh manure. The reasons for this appeared to be: (i) the relatively greater loss of readily degradable N compounds during turning events, resulting in lower mineral N contents; and (ii) conversion of a part of the remaining N into chemical forms that are more stable than those originally present before composting (Kirchmann Reference Kirchmann1985; Levi-Minzi et al. Reference Levi-Minzi, Riffaldi and Saviozzi1986: Kirchmann & Witter Reference Kirchmann and Witter1989; Thomsen Reference Thomsen2001). When losses during storage were included in the calculations to arrive at an ANR for the whole manure handling chain with the barn as starting point (ANRB), a considerably lower value was observed for turned than for stockpiled, roofed, fresh and covered manures (ANRB = 13 v. 23, 27, 28 and 37%, respectively). Note that the reported ANRF and ANRB values represent the amount of N which ended up in the aboveground maize biomass. In the ANR method, it is assumed that the investment of the total amount of N in the below-ground parts of crops does not change significantly from zero to high N fertilizer inputs. Generally, at increasing N fertilization rates, in agricultural soil that is not too poor, the root N yields will hardly increase. Since the soil in the current experiment was not poor, the amount of N ended up in maize roots from the unfertilized and fertilized plots are not expected to be significantly different. Taking this into consideration, it can be assumed that even with root harvesting the total N recovery (shoot + root) would not have been different than presented in Table 5 and thereby the ANRB.
Interestingly, despite an observed 6% loss of the initial total N during the covered storage, ANRF from the covered manure was higher than from fresh manure taken directly from the barn. This clearly indicates that a significant fraction of the initial organic N was mineralized. Consequently, total mineral N increased by 41% after covered storage with respect to fresh manure and thereby increased the N fertilizer value of this currently underutilized manure storage practice.
CONCLUSIONS
The present study revealed that C and N losses during storage of solid cattle manure can be reduced considerably by covering the heaps with an impermeable sheet. As an average over all storage treatments, only about one-fourth of the total established N losses through the mass balance method could be traced back as gaseous (NH3 and N2O) emissions and N leaching losses. The remainder was unaccounted for and constituted in all probability of harmless N2 gas. Of the measured N losses, the highest contribution could be attributed to leaching processes and these were about threefold higher from the turned and stockpiled heaps compared to covered storage. After field application, covered manure had substantially higher maize crop N recovery and DM yield, especially with regard to turned manure. All these findings lead us to conclude that covered storage is a promising means for helping to retain as much of the animal excreted N in the solid cattle manure management chain. Currently, there are no formal regulations for covering solid manure heaps, while they exist for liquid and slurry manures in countries such as The Netherlands and Denmark. The results of the present study warrant the need to reconsider this.
This work was financed by the Higher Education Commission of Pakistan. We are equally indebted to Wageningen University for providing technical assistance for this project. We thank Ghulam Abbas, Nicolas Pugeaux, Muhammad Imtiaz Rashid and Pierre Crouigneau for their help in the field work and Hennie Halm for providing assistance in the laboratory work. Special thanks are due to Johannes Scholberg for critically reading the manuscript and Evert-Jan Bakker for his help in statistical analysis.