Starch is a vital energy source for non-ruminants and plays a central role in their nutritional strategies. The rate of starch digestion is influenced by intrinsic characteristics of starch granules and their structure in different feedstuffs, alongside feed composition, feed processing and inclusion of exogenous enzymes(Reference Svihus, Uhlen and Harstad1–Reference Wiseman3), and it is a crucial factor in the interplay of digestive physiology and feed transit dynamics. For instance, diets with a high concentration of rapidly digestible starch promote quicker starch digestion and energy release, whereas slowly digestible and resistant starch fractions extend the time necessary for hydrolysis(Reference Zhang, Ao and Hamaker4). Consequently, the speed with which starch flows through the gastrointestinal tract (GIT) affects the glycaemic response, the utilisation of other dietary nutrients – especially protein(Reference Selle and Liu5) – and can even modulate feeding behaviours and influence growth performance in both pigs(Reference Silva, Bosch and Bolhuis6) and broilers(Reference Herwig, Abbott and Schwean-Lardner7).
The speed of feed passage through the GIT is often regarded as a primary difference between poultry and pigs, driven by distinct physiological and anatomical features of the tract that determine feed retention times, holding capacity and feeding patterns(Reference Moran and Bedford8,Reference Moran and Bedford9) . Feed passage in poultry is often reported to be faster than in pigs, particularly when assessed at total tract level(Reference Svihus and Itani10,Reference Wilfart, Montagne and Simmins11) . As discussed by Svihus(Reference Svihus, Bedford and Partridge12), fast passage rates in a relatively short tract will facilitate feed intake (FI), especially with pelleted diets, a trait generally considered advantageous by broiler selection programmes for rapid growth. However, data from studies conducted separately with each species indicate that passage rate through the upper GIT, that is the stomach area and small intestine (SI), may be not that different; a mean retention time (MRT) in the upper GIT ranging from 2 to 6 h has been observed in both broilers(Reference Svihus and Itani10,Reference Dorado-Montenegro, Habibi and Gerrits13,Reference Vergara, Ferrando and Jiménez14) and pigs(Reference Lannuzel, Veersma and van Erven15–Reference Dorado-Montenegro, Dijksman and Gerrits18), which is directly influenced by the size and type of markers(Reference Vergara, Ferrando and Jiménez14,Reference de Vries, Kwakkel and Pustjens19) , feed particle size(Reference Amerah, Ravindran and Lentle20) and type and level of dietary fibre(Reference Dorado-Montenegro, Habibi and Gerrits13,Reference Lannuzel, Veersma and van Erven15,Reference Dorado-Montenegro, Dijksman and Gerrits18) .
Despite these differences in feed retention capacity and feed flow, both broilers and pigs are remarkably efficient at digesting starch(Reference Svihus21,Reference Cervantes-Pahm, Liu and Stein22) . In our previous study(Reference Bassi, Hejdysz and Pruszyńska-Oszmałek23), we observed that broilers and growing pigs fed the same diet had similar starch digestibility coefficients in the jejunum and ileum, albeit tied to unique physiological features. In broilers, an effective gizzard grinding of the feed into particles <0·1 mm can lead to a faster digestion as feed enters the SI(Reference Svihus24), while the occurrence of antiperistalsis facilitates the reflux of digesta to increase contact time with digestive enzymes(Reference Sacranie, Iji and Choct25). Pigs exhibit a higher capacity to hydrate the digesta, indicated by lower ileal viscosity and a higher water content, facilitating dilution with pancreatic juices(Reference Lentle and Janssen26), alongside a higher lipase production and activity in the SI that may indirectly improve starch digestibility(Reference Liu, Lyu and Liu27). Furthermore, salivary α-amylase in pigs can contribute to an earlier starch hydrolysis in the digestive process(Reference Martens, Bruininx and Gerrits28). Such characteristics were also evident in our previous study(Reference Bassi, Hejdysz and Pruszyńska-Oszmałek23), indicating that the physiological adaptations of each species can result in a similar nutrient digestion efficiency.
Starch digestion has been extensively studied in broilers and pigs individually, both in vivo and in vitro. However, in vivo inter-species studies on the kinetics of starch digestion and feed flow under directly comparable conditions, with both species fed the same diet, remain scarce. The current study builds on our previous comparative work(Reference Bassi, Hejdysz and Pruszyńska-Oszmałek23), aiming at further elucidating species-specific aspects linked to digestion dynamics, as they directly impact nutrient utilisation and can aid in the development of targeted feed formulation and feeding strategies. Our objective was to investigate the kinetics of nutrient digestion and feed flow through the GIT of broilers and pigs by sampling digesta at different post-prandial times, with a focus on starch. We hypothesised that, due to a shorter tract and reportedly faster transit time, broilers would exhibit quicker flow of feed and starch compared with pigs. Additionally, a solid and a liquid inert marker were used to assess potential species differences in digesta flow as influenced by phase segregation.
Material and methods
All experimental procedures involving animals complied with institutional guidelines of the Poznań University of Life Sciences and with the European Union Directive 2010/63/EU on the protection of animals used for scientific purposes. All procedures were approved by the Local Ethical Committee for Experiments on Animals of the Poznań University of Life Sciences (protocol/approval no. 02/2024).
Animal husbandry – broilers
A total of fifty-six 1-d-old male Ross® 308 broiler chickens were acquired from a commercial hatchery (Dan Hatch Poland S.A., Stary Widzim 254, 64-200 Wolsztyn). At arrival, birds were group-housed in 1·2× 0·8 m2 floor pens with wood shaving litter and fed a pelleted-crumble starter broiler diet based on maize and soyabean meal (22 % crude protein (CP); 7·95 % crude fat; 12·6 MJ metabolisable energy (ME)/kg; 0·96 % Ca; 0·48 % available P) with the inclusion of 10 % hulled oats to stimulate gizzard development for 14 d. After 14 d of adaptation, birds were weighed, randomly selected and housed in pairs in twenty-eight cages measuring 0·50 × 0·40 × 0·50 m (length x width x height) with ad libitum access to water and pelleted experimental diets for 10 d, avoiding adjacent cages receiving the same diet. Average individual body weight at the start of the experiment was 591 g. Cages had wire-mesh floors and were equipped with manual feeders and drinkers. Birds were exposed to light for 24 h per d in the first 7 d, followed by 18 h light:6 h darkness. The temperature was maintained at 32°C during the first week and gradually reduced to about 23°C by the end of the experimental period. The daily routine included verification of temperature, feed and water supply and inspection of cages for dead and culled birds. No mortality was observed throughout the experiment.
Animal husbandry – pigs
A total of twenty-eight male 50-d-old growing pigs (Naima × (Pietrain × Duroc); Axiom Group Poland) were individually housed in floor pens with straw, equipped with a nipple drinker and trough feeder with ad libitum access to water and feed. During a 6-d adaptation period, pigs were fed a pelleted maize–soyabean meal diet (20·05 % CP; 5·15 % crude fat; 0·72 % Ca; 0·40 % available P; 12·6 MJ ME/kg), which was gradually substituted until day 6 for the experimental diets, which were then fed for a period of 10 d. Experimental diets were randomly allocated to the pigs, avoiding adjacent pens receiving the same diet. Average individual BW at the start of the experimental period was 19·2 kg. The daily routine included verification of temperature, feed and water supply and cleaning of pens. No mortality was observed throughout the experiment.
Experimental diets
A maize–soyabean–wheat pelleted diet was manufactured at the Experimental Station of the Department of Animal Nutrition and Feed Management Gorzyń/Miedzychód – Poland. The grains were ground in a Skiold Disk mill (SK2500) at 1·4 mm disc distance. Minerals, amino acids, vitamins and fat were directly added along with the ground grains to a 100 kg horizontal mixer Zuptor 100 (Zuptor) with 4-min mixing time and mixing speed of 27·4 rev/min. After mixing, the diet was pelleted using a Scorpion pellet press (BMG Pelleting Experts) equipped with a 3 mm die size.
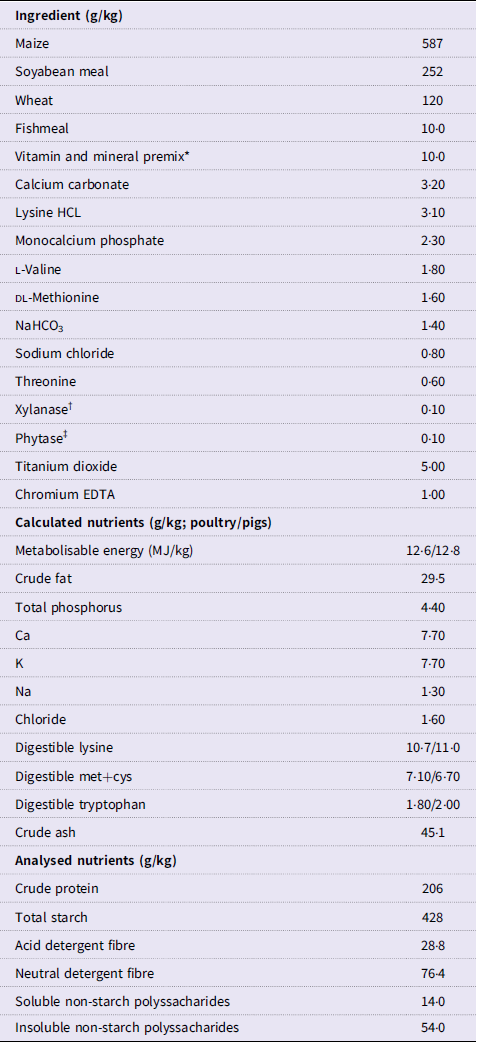
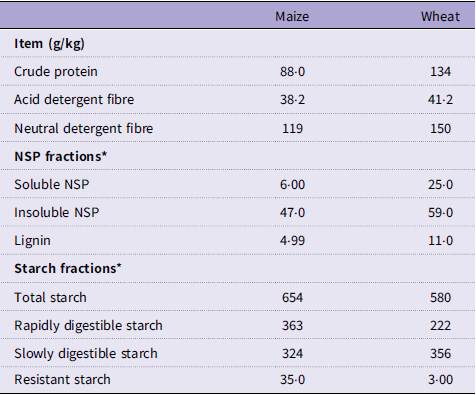
The diet (Table 1) was formulated to be nutritionally sufficient for both species, based on average nutrient recommendations for growth-to-finish broiler chickens (25-to-market-d-old(29); and growing pigs)(30). Vitamin and trace minerals levels were set to meet the requirements for broilers and were slightly above that of pigs, to prevent their undersupply. The experimental diet contained 2000 units of phytase (FYT)/kg of diet (Ronozyme HiPhos GT, DSM Nutritional Products) and a NSPase supplement (Ronozyme Multigrain, DSM Nutritional Products) containing endo-1,4-β-glucanase, endo-1,3 (4)-β-glucanase and endo-1,4-β-xylanase at 80, 70 and 270 units/kg of diet, respectively. Proximate analysis of maize and wheat is presented in Table 2. Titanium dioxide (TiO2) and Cr-EDTA were used as solid-and liquid-phase dietary markers, respectively. Particle size distribution (PSD) of the pelleted diet was determined through wet sieving(Reference Rodgers, Choct and Hetland31), and the geometrical mean diameter was 590 µm, calculated according to the American Society of Agricultural and Biological Engineers (Method ANSI/ASAE S319.3 FEB03). Particle size of the diet was chosen based on recommended values for growing pigs(Reference Rojas and Stein32).
Ingredients and nutritional composition of experimental diet (as-fed basis)

Table 1. Long description
The table presents the ingredients and nutritional composition of an experimental diet on an as-fed basis. It includes 15 rows and 2 columns. The first column lists the ingredients and additives, while the second column provides their respective quantities in grams per kilogram. The table starts with major ingredients like maize, soya bean meal, and wheat, followed by smaller quantities of fishmeal, vitamin and mineral premix, and various other additives like calcium carbonate, lysine HCL, and monocalcium phosphate. It also includes enzymes like xylanase and phytase, as well as markers such as titanium dioxide and chromium EDTA. The calculated nutrients section lists metabolisable energy, crude fat, total phosphorus, and various minerals and amino acids. The analysed nutrients section provides data on crude protein, total starch, acid detergent fibre, neutral detergent fibre, and non-starch polysaccharides.
Wet sieving particle size distribution (% of particles): 0 to 0.2 mm, 48.8 %; 0.2 to 1 mm, 23.9 %; 1 to 2 mm, 13.1 %; 2 to 3.55 mm, 14 %; >3.55 mm, 0.3 %.
* Provided per kg diet: IU: vitamin A 11 250, cholecalciferol 2500; mg: vitamin E 80, menadione 2.50, vitamin B12 0.02, folic acid 1.17, choline 379, d-pantothenicacid 12.5, riboflavin 7.0, niacin 41.67, thiamin 2.17, d-biotin 0.18, pyridoxine 4.0, ethoxyquin 0.09, Mn 73, Zn 55, Fe 45, Cu 20, I 0.62, Se 0.3.
† Ronozyme Multigrain (xylanase/beta glucanase; DSM-firmenich).
‡ Ronozyme HiPhos GT 20000 (DSM-firmenich).
Proximate analysis of maize and wheat

Table 2. Long description
A table comparing nutritional components of maize and wheat. The table has 12 rows and 3 columns. The columns are labeled Maize, Wheat, and Item (g/kg). The rows are labeled Crude protein, Acid detergent fibre, Neutral detergent fibre, Soluble NSP, Insoluble NSP, Lignin, Total starch, Rapidly digestible starch, Slowly digestible starch, and Resistant starch. The values for each item are as follows: Crude protein: Maize 88.0, Wheat 134; Acid detergent fibre: Maize 38.2, Wheat 41.2; Neutral detergent fibre: Maize 119, Wheat 150; Soluble NSP: Maize 6.00, Wheat 25.0; Insoluble NSP: Maize 47.0, Wheat 59.0; Lignin: Maize 4.99, Wheat 11.0; Total starch: Maize 654, Wheat 580; Rapidly digestible starch: Maize 363, Wheat 222; Slowly digestible starch: Maize 324, Wheat 356; Resistant starch: Maize 35.0, Wheat 3.00.
* Analysis performed by Englyst Carbohydrates Ltd.
Additionally, a starch-free, finely ground mixture of dextrose and fishmeal was produced by dry mixing the ingredients without any processing and fed to the animals for a short period of time prior to sample collection. The mash acted as a washout diet to prevent an extended fasting period, as proposed by Itani and Svihus(Reference Itani and Svihus33). To facilitate ingestion, the starch-free mash was mixed with water at a ratio of 10:1 (w:v) immediately before feeding.
Data collection and sampling
For recording purposes, all pigs, broilers and feed were weighed at the start and end of the 10-d experimental period. Average BW gain and FI of broilers during that period were 779 and 1144 g, respectively; pigs had an average BW gain and FI of 10·9 and 11·5 kg, respectively. Both species presented normal growth according to the breeders’ performance guidelines(29,34) , and there was no sign of diseases throughout the experimental period.
Prior to the last day of the experiment, the experimental feed was withdrawn and all animals were fed the starch-free fine mash during 3 h, followed by a fasting period of 5 h. Thereafter, all animals were given back access to the experimental diet for a period of 1 h, during which FI was recorded and expressed as a percentage of the estimated daily FI for each species at the corresponding age, based on performance guidelines(29,34) . There was no access to feed after this 1-h period. Subsequently, different groups of animals were killed at 2, 4, 6 and 8 h post-commencement of feeding, with seven replicates of two broilers or one pig sampled at each time point.
Broilers were individually weighed and timely euthanised by cervical dislocation. Whole blood samples were then collected postmortem from the jugular vein of one randomly selected bird of each pen and held in tubes with heparin (Vacutainer® Plus – BD) to avoid clotting. Blood serum was obtained by centrifuging at 3500 rpm for 15 min, placed in Eppendorf tubes and immediately frozen at –80°C prior to analyses. The birds were then eviscerated and the crop, gizzard and proventriculus were excised. Crop weight with contents was noted, and its contents were collected and weighed. Gizzard and proventriculus combined weight with contents were noted, gizzard pH with contents was measured in situ with the insertion of a portable pH meter through a small cut and the contents from gizzard and proventriculus were then collected, pooled and weighed. The SI was removed using clamps to prevent loss of material, and the duodenum was separated, defined from the gizzard pylorus to the end of the pancreatic loop. The rest of the SI (jejunum + ileum) was spread on a table and cut into four equal parts, herein termed first quarter (SI1), second quarter (SI2), third quarter (SI3) and fourth quarter (SI4) of the SI, each segment averaging 38 cm in length. The length of the duodenum and SI was noted. The digestive contents from all segments were obtained by gently pushing into plastic containers and weighed. Approximately 1·5 g of contents from SI1 and SI4 were held in Eppendorf tubes. Contents of the two birds from the same replicate were pooled. All digesta samples were immediately snap-frozen with liquid N2 (−196ºC) after collection and stored in a freezer at –30°C until analyses. Time between collection of each replicate was 15 min.
Pigs were weighed and timely stunned and euthanised using electrical stunning tongs. Whole blood samples were collected from the jugular vein of each pig, held in tubes with heparin and centrifuged for 15 min at 3500 rpm to obtain the serum, placed in Eppendorf tubes and immediately frozen. With the aid of clamps to prevent loss of digesta, pigs were eviscerated and the stomach was excised and weighed with contents. A small cut was made in the stomach for pH measurements with a portable pH metre, following collection and weighing of the whole contents. Due to the large volume of stomach digesta in some of the samples, contents were manually homogenised and approximately 150 mL were transferred to a plastic container. The SI was removed and duodenum was separated, defined from the pylorus to the end of the region held by the duodenocolic fold, approximately 60 cm from the pylorus(Reference König and Liebich35), while the remainder of SI (jejunum and ileum) was cut into four equal parts (SI1, SI2, SI3 and SI4), each segment averaging 418 cm in length. Length and weight of all segments were noted, and the whole digestive contents were gently pushed into plastic containers and weighed. Approximately 1·5 g of contents from SI1 and SI4 were held in Eppendorf tubes. All digesta samples were immediately snap-frozen with liquid N2 (−196 ºC) after collection and stored in a freezer at −30 °C until analyses. Time between collection of each replicate was 15 min, akin to broiler sampling.
Chemical analyses
Cereal and feed samples were ground to pass through a sieve with a mesh size of 0·5 mm (Retsch, Ultra Centrifugal Mill ZM 200) and analysed in duplicate for DM (method 943.01), CP (method 976.05), ether extract (method 920.39), acid detergent fibre (method 942.05, expressed inclusive of residual ash), and neutral detergent fibre (method 973.18, assayed with heat-stable amylase and expressed inclusive of residual ash) according to the Association of Official Agricultural Chemists (AOAC, 2005). Soluble and insoluble NSP in cereals and diets were determined according to Englyst et al.(Reference Englyst, Quigley and Hudson36). Dietary nitrogen content was analysed using a KjelFoss Automatic 16 210 analyser (Foss Electric), and ether extract was determined using a Soxtec System HT 1043 Extraction Unit (Foss Tecator). Starch content was determined utilising thermostable α-amylase and amyloglucosidase commercial assay kits (Megazyme International) according to AOAC (method 996.11). Starch fractions (rapidly digestible starch, slowly digestible starch, available starch, resistant starch) in cereals and diets were determined using the method of Englyst et al.(Reference Englyst, Englyst and Hudson37). Content of TiO2 in the diets was determined according to Short et al.(Reference Short, Gorton and Wiseman38). The Cr content was determined using a microwave digestion system (MARSExpress Vessel, CEM) with concentrated nitric acid and hydrogen peroxide and microwave plasma atomic emission spectrometry (MP-AES, Agilent), based on the methodology described in Reis et al.(Reference Reis, Valente and Almeida39).
Prior to analysis, all digesta samples were freeze-dried (Christ Epsilon-10D LSC plus, Medizinischer Apparatebau). Digesta from all SI segments were analysed for DM, total starch and TiO2 using the previously described methods. Because of a small sample volume, contents from the duodenum and the four SI segments were pooled for the analysis of Cr content. Additionally, CP was analysed in SI4.
Particle size distribution of digesta
Approximately 5 g of frozen digesta from duodenum, SI2 and SI4 of pigs and broilers were used to determine PSD by a laser diffraction method on a Malvern Mastersizer S instrument (Malvern Instruments Ltd) as described by Hetland et al.(Reference Hetland, Svihus and Olaisen40), detecting particle diameters in a range from 0·02 to 2000 µm. The instrument provided PSD information expressed as calculated volume percentages of particles less than 2000 µm in size.
Amylase and lipase activities
Approximately 100 µg of frozen SI1 and SI4 digesta held in Eppendorf tubes were weighed, mixed with PBS and homogenised, and the homogenates were centrifuged at 10 000 × g for 30 min at 4ºC. Amylase and lipase activity measurements were then carried out using colourimetric assay kits (BioVision). The SI1 and SI4 segments were specifically selected to observe possible dynamic changes in enzyme activity at the beginning and at the end of the SI. The results were quantified in terms of glycerol (for lipase) and nitrophenol (for amylase) released and expressed per g/DM or per g/TiO2 content in the digesta. For analysis of amylase, supernatants were diluted fifty times; for lipase, supernatants were not diluted.
Serum parameters
The following blood serum parameters were determined using Pointe Scientific assays (Pointe Scientific): glucose (Cat. No.: G7519), TAG (Cat. No.: T7531) and total cholesterol (Cat. No.: C7510). Serum insulin and glucagon levels were measured using ELISA kits and used to determine glucagon-to-insulin (G:I) ratio.
Scanning electron microscopy of starch granules
The structure of starch granules was observed using scanning electron microscopy (SEM) in freeze-dried samples of maize, wheat, experimental diet and digesta contents from the gizzard of broilers and stomach of pigs, SI2 and SI4. Following freeze-drying, the samples were further dehydrated by using a series of acetone solutions with increasing concentrations (30, 50, 70, 90 and 100 %). Each dehydration step was performed twice for 12 min to ensure complete water removal. Dehydrated samples were then transferred to a Critical Point Drying apparatus (Balzers CPD 030; Bal-Tec AG) with a drying agent (CO2) and mounted onto SEM stubs using a conductive adhesive tape to prevent movement of the stubs during analysis. Coating of the samples with gold was done using a sputter coater (Quorum Q150R Plus; Quorum). Mounted and coated samples were transferred to the SEM chamber and analysed in a Zeiss EVO SEM microscope (Zeiss) operated at 15 kV and 8 mm of working distance. Representative images were selected based on visual quality and clarity of granule structure.
Calculations and statistical analysis
The coefficients of apparent nutrient digestibility in the different segments of the SI (duodenum and SI 1 to 4 separately, and whole SI) were determined using only TiO2 concentrations since, as previously described, the analysis of Cr in single SI segments was not possible due to low sample volume. The following equation was used for calculations:
 $\scriptsize{{{Apparent}}\;{{digestibility}} = \left\{ {1 - \left[ {\left( {{{Ti}}{{{O}}_2}\;\% {{{{diet}}} \over {{{digesta}}}}} \right)\;{{x}}\;\left( {{{Nutrient}}\;\% \;{{{{digesta}}} \over {{{diet}}}}} \right)} \right]} \right\}}$
The proportions of TiO2 and Cr-EDTA contents that exited the anterior tract (pooled contents from the crop, proventriculus and gizzard of broilers; contents from stomach of pigs) and entered the SI at each time point, based on the amounts eaten during the 1-h meal, were determined by:
 \begin{align} & {{Proporon}}\;{{of}}\;{{marker}}\;{{exiting}}\;{{the}}\;{{anterior}}\;{{tract}}\;\left( \% \right) \\ & \,\,\,\,\,= \scriptsize{\left( {{{{{Amount}}\;{{eaten}}\;\left( {{g}} \right) - {{amount}}\;{{in}}\;{{the}}\;{{anterior}}\;{{tract}}\;\left( {{g}} \right)} \over {{{Amount}}\;{{eaten}}\;\left( {{g}} \right)}}} \right){{x}}\;100}\end{align}
Similarly, the proportions of TiO2 and Cr-EDTA exiting the SI (accounting for combined contents found in the anterior tract and SI) and entering the large intestine, based on the amounts eaten during the 1-h meal, were determined by:
 \begin{align} & {{Proportion}}\;{{of}}\;{{marker}}\;{{exiting}}\;{{the}}\;{{SI}}\left( \% \right) \\ & \,\,\,\,\,= \scriptsize{\left( {{{{{Amount}}\;{{eaten}}\;\left( {{g}} \right) - {{Amount}}\;{{in}}\;{{the}}\;{{anterior}}\;{{tract}}\;{{andSI}}\;\left( {{g}} \right)} \over {{{Amount}}\;{{eaten}}\;\left( {{g}} \right)}}} \right){{x}}\;100}\end{align}
Assuming that the passage of markers after each time point was representative for the next, that is, the passage from 0 to 2 h was representative for 0–4 h, which was then representative for 0 to 6 h and so on, the proportion of marker passage between specific intervals of 0–2 h, 2–4 h, 4–6 h and 6–8 h was calculated as the difference between cumulative recovery at time t and the average cumulative recovery at time t − 2 h, as in the equation:
 ${M_{\left( {t - 2} \right) - t,i}} = {M_{0 - t,i}} - {\overline M _{0 - \left( {t - 2} \right)}}$
where
 ${M_{\left( {t - 2} \right) - t,i}}$
is the estimated marker passage for bird i in the interval (t − 2 to t),
 ${M_{0 - t,i}}$
is the cumulative marker recovery for bird i at time t and
 ${\bar M_{0 - \left( {t - 2} \right)}}$
is the average marker recovery for all birds at the previous time point (t – 2 h).
The distribution of TiO₂ throughout the GIT was calculated based on the proportion of the ingested marker recovered in each segment. Titanium dioxide intake was determined from the FI during the 1-h feeding period and at each sampling time, the amount of TiO₂ recovered in each segment, as well as the amount exiting the SI, was expressed as a percentage of total TiO₂ intake, according to the following equation:
 $\scriptsize{{{Ti}}{{{O}}_2}\;{{distribution}}\;\left( \% \right) = {{{{Ti}}{{{O}}_2}\;{{recovered}}\;{{in}}\;{{a}}\;{{given}}\;{{segment}}\;\left( {{g}} \right)} \over {{{Total}}\;{{Ti}}{{{O}}_2}\;{{intake}}\;{{during}}\;1\;{{h}}\;{{feeding}}\;\left( {{g}} \right)}}\;{{x}}\;100}$
One cage (two broilers) or one pig was considered the experimental unit, with 7 units per time point. The residue normality of the data was determined by Shapiro–Wilk test. For the majority of response variables, data were analysed using a two-way ANOVA including species and sampling time as fixed effects. For marker passage variables where both markers were evaluated, analyses were performed separately for each sampling time using a two-way ANOVA with species and marker type as fixed effects. Additionally, to evaluate differences among the four SI segments for each species, apparent starch digestibility data were analysed using a linear mixed model with species and segment as fixed effects, and pig or broiler cage included as a random effect to account for repeated measurements across segments within the same experimental unit. When significant, interactions were submitted to Tukey’s test at 5 % probability for mean comparison. All statistical procedures were carried out on R program (R Foundation for Statistical Computing). Significance was assigned at P < 0·05. A retrospective power analysis was done to validate the sample size in G*Power 3.1(Reference Faul, Erdfelder and Lang41) using the variation in apparent starch digestibility at SI4 due to being the segment that best represents apparent digestibility at ileal level. The ileum is the most common intestinal segment selected in nutrient digestibility studies in livestock, and ileal digestibility dominates in production animal nutrition. Main effects of species and sampling time had a statistical power of 0·76 and 0·77, respectively, and the interaction between them had a power of 0·75.
Results
Relative weight and length of intestinal tract
Broilers had a higher weight of empty anterior tract relative to their BW compared with pigs (P < 0·001; Table 3). The relative length of empty duodenum, jejunum, ileum and all three segments combined was also higher for broilers than pigs (P < 0·001).
Live body weight, relative empty weight of anterior tract and relative length of small intestine of 24-d-old broilers and 60-d-old growing pigs

Table 3. Long description
The table has four rows and five columns. The columns are labeled Species, Live BW (kg), Relative weight (g/kg BW), and Relative length (cm/kg BW) with sub-columns Duodenum, Jejunum and ileum, and Small intestine. The rows are labeled Broilers, Pigs, and Pooled SEM. The table provides data on the live body weight, relative weight of the empty anterior tract, and relative length of the duodenum, jejunum, ileum, and small intestine for broilers and pigs. For broilers, the live body weight is 1-37 kg, the relative weight of the anterior tract is 28-6 g/kg BW, the relative length of the duodenum is 20-1 cm/kg BW, the relative length of the jejunum and ileum is 112 cm/kg BW, and the relative length of the small intestine is 132 cm/kg BW. For pigs, the live body weight is 30-1 kg, the relative weight of the anterior tract is 11-5 g/kg BW, the relative length of the duodenum is 2-08 cm/kg BW, the relative length of the jejunum and ileum is 55-8 cm/kg BW, and the relative length of the small intestine is 57-9 cm/kg BW. The pooled SEM values are provided for each measurement.
* Anterior tract represents the crop, proventriculus and gizzard for broilers and stomach for pigs.
Stomach pH and apparent nutrient digestibility
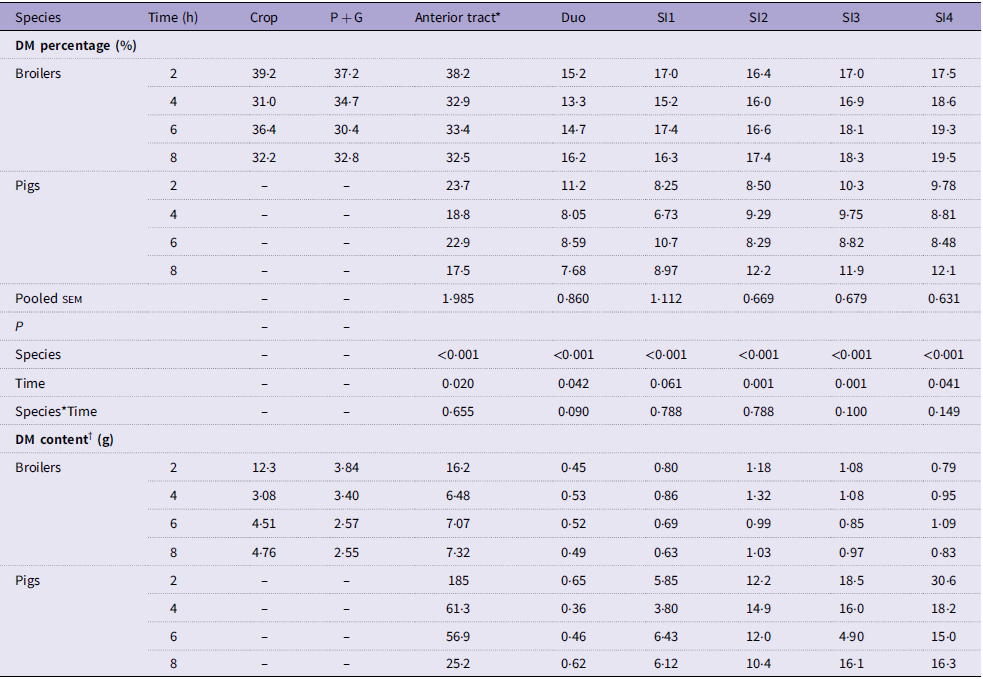
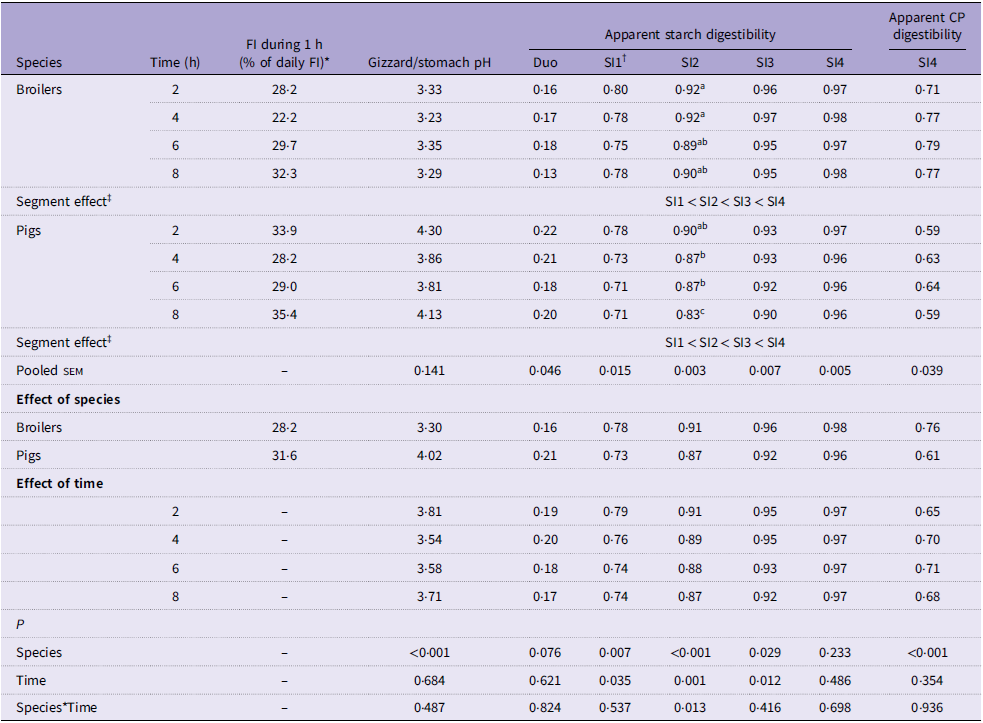
Table 4 summarises DM percentage and content in digesta from different segments of the upper GIT. Regardless of post-feeding time, it was observed that digesta of broilers presented higher DM across all segments compared with pigs (P < 0·05). Table 5 summarises the pH in the gizzard of broilers or stomach of pigs and apparent digestibility in different SI segments calculated using solid TiO2 marker concentrations. Descriptive data of FI during 1-h access (expressed as % of expected daily FI) is also presented. Notably, both broilers and pigs consumed approximately 30 % of their expected daily intake during the 1-h period of access to the experimental diet, with no major differences between treatments, assuring a comparable cross-species investigation of subsequent feed flow data.
DM content in different segments of the digestive tract of broilers and pigs at different post-feeding times after a single meal. Descriptive data only

Table 4. Long description
The table presents data on DM percentage and content in different segments of the digestive tract of broilers and pigs at various post-feeding times. It has 18 rows and 12 columns. The columns are labeled as Species, Time (h), Crop, P + G, Anterior tract, Duo, SI1, SI2, SI3, SI4, and DM content (g). The rows are labeled with different post-feeding times (2, 4, 6, 8 hours) and species (Broilers, Pigs). The table includes data for DM percentage and content in various segments of the digestive tract. Notable trends include higher DM percentages in broilers compared to pigs across all segments and times. The table also includes pooled SEM and P values for species, time, and species*time interactions.
P + G, proventriculus and gizzard.
a,b,cValues within a column with different superscripts differ significantly at P < 0.05.
* Stomach content in pigs, while for broilers, DM is an average of DM content in the crop, proventriculus and gizzard.
† Descriptive data only.
The pH of gizzard/stomach and apparent nutrient digestibility from different segments of the tract of broilers and pigs at different post-feeding times after a single meal

Table 5. Long description
A table comparing the pH and apparent nutrient digestibility in broilers and pigs at different post-feeding times. The table has 25 rows and 11 columns. Column headers are Species, Time (h), FI during 1 h (% of daily FI), Gizzard/stomach pH, Apparent starch digestibility (Duo, SI1, SI2, SI3, SI4), and Apparent CP digestibility (SI4). Row labels include Broilers, Pigs, Pooled SEM, Effect of species, Effect of time, and P. Row 1: Broilers, 2, 28.2, 3.33, 0.16, 0.80, 0.92, 0.96, 0.97, 0.71. Row 2: Broilers, 4, 22.2, 3.23, 0.17, 0.78, 0.92, 0.97, 0.98, 0.77. Row 3: Broilers, 6, 29.7, 3.35, 0.18, 0.75, 0.89, 0.95, 0.97, 0.79. Row 4: Broilers, 8, 32.3, 3.29, 0.13, 0.78, 0.90, 0.95, 0.98, 0.77. Row 5: Segment effect,, , , , SI1 < SI2 < SI3 < SI4,, , , . Row 6: Pigs, 2, 33.9, 4.30, 0.22, 0.78, 0.90, 0.93, 0.97, 0.59. Row 7: Pigs, 4, 28.2, 3.86, 0.21, 0.73, 0.87, 0.93, 0.96, 0.63. Row 8: Pigs, 6, 29.0, 3.81, 0.18, 0.71, 0.87, 0.92, 0.96, 0.64. Row 9: Pigs, 8, 35.4, 4.13, 0.20, 0.71, 0.83, 0.90, 0.96, 0.59. Row 10: Segment effect,, , , , SI1 < SI2 < SI3 < SI4,, , , . Row 11: Pooled SEM,, , 0.141,, 0.046, 0.015, 0.003, 0.007, 0.005, 0.039. Row 12: Effect of species, Broilers, 28.2, 3.30, 0.16, 0.78, 0.91, 0.96, 0.98, 0.76. Row 13: Effect of species, Pigs, 31.6, 4.02, 0.21, 0.73, 0.87, 0.92, 0.96, 0.61. Row 14: Effect of time, 2,, 3.81, 0.19, 0.79, 0.91, 0.95, 0.97, 0.65. Row 15: Effect of time, 4,, 3.54, 0.20, 0.76, 0.89, 0.95, 0.97, 0.70. Row 16: Effect of time, 6,, 3.58, 0.18, 0.74, 0.88, 0.93, 0.97, 0.71. Row 17: Effect of time, 8,, 3.71, 0.17, 0.74, 0.87, 0.92, 0.97, 0.68. Row 18: P, Species,, <0.001, 0.076, 0.007, <0.001, 0.029, 0.233, <0.001. Row 19: P, Time,, 0.684, 0.621, 0.35, 0.001, 0.012, 0.486, 0.354. Row 20: P, Species*Time,, 0.487, 0.824, 0.537, 0.013, 0.416, 0.698, 0.936.
FI, feed intake; Duo, duodenum; CP, crude protein; SI, small intestine.
a,b,c Values within a column with different superscripts differ significantly at P < 0.05.
* FI during the 1-h feeding period expressed as a percentage of the expected daily FI for each species at the according age (approximately 142 g for 24-d-old broilers and 1200 g for 60-d-old or 30-kg-body weight pigs).
† SI 1–4: Jejunum and ileum were cut into four equal length parts.
‡ Segment effect ‘<’indicates that the apparent starch digestibility of a SI segment is smaller than the next (P < 0.05).
Broilers presented a more acidic gizzard pH compared with stomach of pigs (P < 0·001) regardless of sampling time (Table 4). Apparent digestibility/disappearance of starch in the anterior tract of both species was negative (averaging −0·53 in the stomach of pigs and –0·84 in the gizzard of broilers across sampling times) and therefore is not presented. In the duodenum, there was a tendency (P < 0·1) for greater starch digestibility in pigs. Throughout the first three quarters of the SI (SI1, SI2 and SI3), starch digestibility was higher in broilers than in pigs across all sampling times (P < 0·05). In the second quarter (SI2), pigs at 8-h post-feeding had lower apparent starch digestibility compared with other treatments (P < 0·05), and overall starch digestibility remained higher in broilers. At the last quarter of the SI (SI4), both species achieved similar starch digestibility. In both species, apparent starch digestibility increased from SI1 to SI4 (P < 0·05). Broilers presented higher CP digestibility in SI4 than pigs (P < 0·001), regardless of sampling time.
Particle size distribution of digesta
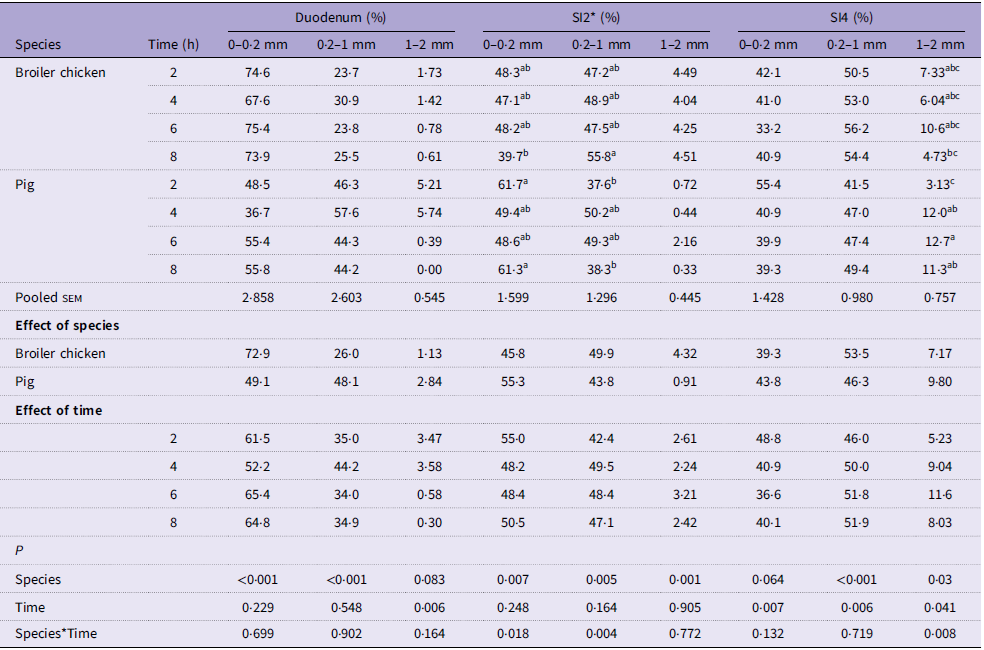
The PSD of digesta from duodenum, SI2 and SI4 are summarised in Table 6. The duodenal digesta of broilers presented a higher concentration of small particles (<0·2 mm) compared with pigs (P < 0·05), regardless of timing. In contrast, pigs had a higher (P < 0·05) percentage of particles within the range of 0·2 to 1 mm, with a tendency (P < 0·1) of higher volume of particles between 1 and 2 mm. For both species, there was a reduction (P < 0·01) in the volume of particles between 1 and 2 mm in the duodenum from 2 to 8 h post-feeding.
Particle size distribution of digesta from broilers and pigs collected at different post-feeding times after a single meal, expressed as calculated volume percentage

Table 6. Long description
The table presents data on the particle size distribution of digesta from broiler chickens and pigs collected at different post-feeding times after a single meal, expressed as calculated volume percentage. The table has 15 rows and 14 columns. The columns are labeled as Species, Time (h), and various particle size ranges in the duodenum, SI2, and SI4 sections. The rows are labeled with the species (Broiler chicken, Pig) and time intervals (2, 4, 6, 8 hours). The particle size ranges are 0-0.2 mm, 0.2-1 mm, and 1-2 mm for each section. The table includes pooled SEM, effect of species, and effect of time. Notable trends include higher concentrations of small particles (<0.2 mm) in broilers compared to pigs, and a reduction in the volume of particles between 1 and 2 mm in the duodenum from 2 to 8 hours post-feeding for both species.
SI, small intestine.
* SI 1–4: Jejunum and ileum were cut into four equal length parts. SI2 and SI4 represent the second and fourth quarters, respectively.
a,b,c Values within a column with different superscripts differ significantly at P < 0.05.
In the SI2, PSD of digesta was opposite to that observed in the duodenum, as broilers presented a lower percentage of particles <0·2 mm and a higher percentage of particles between 1 and 2 mm compared with pigs (P < 0·05). At the last quarter of the SI (SI4), the digesta of broilers tended (P < 0·1) to have a slightly lower volume of particles <0·2 mm and had a higher volume of particles between 0·2 and 1 mm compared with pigs (P < 0·01). The volume of larger particles (between 1 and 2 mm) was lower in pigs at 2-h post-feeding compared with other timings (P < 0·05) but did not differ for broilers between post-feeding times.
Visualisation of starch granules
In Figure 1, it is possible to visualise the starch granules of ground maize, polyhedral in shape and starch granules of wheat, which are generally oval-like with two size groups: 15–20 % small granules (2–15 µm diameter) and 80–85 % large granules (20–35 µm diameter)(Reference Kalab42). Scanning of starch granules in the pelleted diet serves the purpose of observing the integrity of granules post-pelleting. Figure 2 allows for a visual representation of starch digestion in the anterior tract, SI2 and SI4. Pictures in this figure were manually selected in order to demonstrate the presence of intact and partially digested starch granules in the segments. In the anterior tract of both species, starch granules appear mostly intact, especially at 2 h post-feeding. Signs of digestion can be observed in the second SI quarter, as evidenced by holes in the granules, which indicate enzymatic action(Reference Chakraborty, Pallen and Shetty43). By the fourth quarter, despite a near complete starch digestibility, residual fragments of starch granules can still be found.
Scanning electron microscopy of starch granules in ground maize, ground wheat and in the experimental pelleted diet.

Scanning electron microscopy images of starch granules in the digesta from different tract segments of broilers and pigs collected at 2 and 8 h after a single 1-h meal. SI, small intestine.

Figure 2. Long description
The table presents scanning electron microscopy images of starch granules in the digesta from different tract segments of broilers and pigs collected at 2 and 8 hours after a single 1-hour meal. The table has 4 rows and 3 columns. The rows are labeled with species and time: Broilers 2h, Pigs 2h, Broilers 8h, and Pigs 8h. The columns are labeled with tract segments: Gizzard/Stomach, Second quarter SI, and Fourth quarter SI. Each cell contains an image of starch granules. Row 1: Broilers 2h. Gizzard/Stomach: Image of starch granules with a scale bar of 10 micrometers and a magnification of 2,500x. Second quarter SI: Image of starch granules with a scale bar of 2 micrometers and a magnification of 2,500x. Fourth quarter SI: Image of starch granules with a scale bar of 2 micrometers and a magnification of 2,500x. Row 2: Pigs 2h. Gizzard/Stomach: Image of starch granules with a scale bar of 10 micrometers and a magnification of 2,500x. Second quarter SI: Image of starch granules with a scale bar of 2 micrometers and a magnification of 2,500x. Fourth quarter SI: Image of starch granules with a scale bar of 2 micrometers and a magnification of 2,500x. Row 3: Broilers 8h. Gizzard/Stomach: Image of starch granules with a scale bar of 10 micrometers and a magnification of 2,500x. Second quarter SI: Image of starch granules with a scale bar of 2 micrometers and a magnification of 2,500x. Fourth quarter SI: Image of starch granules with a scale bar of 2 micrometers and a magnification of 2,500x. Row 4: Pigs 8h. Gizzard/Stomach: Image of starch granules with a scale bar of 10 micrometers and a magnification of 2,500x. Second quarter SI: Image of starch granules with a scale bar of 2 micrometers and a magnification of 2,500x. Fourth quarter SI: Image of starch granules with a scale bar of 2 micrometers and a magnification of 2,500x.
Amylase and lipase activities in digesta
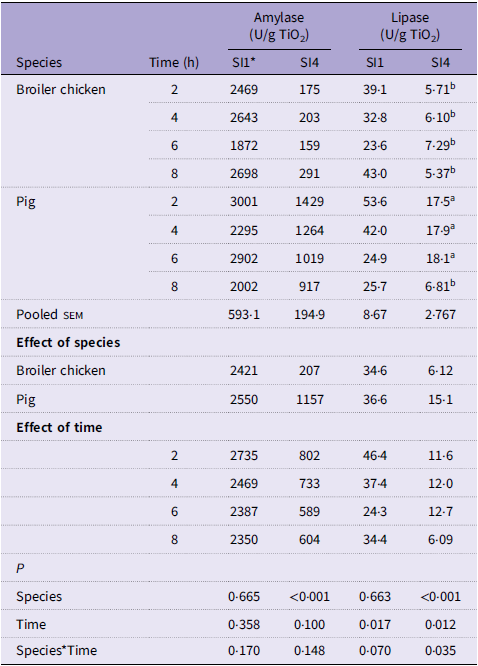
Enzyme activities in digesta from the first and fourth quarters of the SI (SI1 and SI4) are presented in Table 7, expressed as U/g of TiO2. No difference between species was observed for amylase activity in the SI1, whereas in SI4, amylase activity was overall higher in pigs than in broilers (P < 0·05). Lipase activity was lower in pigs at 8 h post-feeding than at the other times (P < 0·05).
Amylase and lipase activity in small intestinal digesta from broilers and pigs collected at different post-feeding times after a single meal

Table 7. Long description
A table comparing amylase and lipase activity in broiler chickens and pigs over different post-feeding times. The table has 12 rows and 8 columns. Column headers are Species, Time (h), Amylase (U/g TiO2) SI1, Amylase (U/g TiO2) SI4, Lipase (U/g TiO2) SI1, Lipase (U/g TiO2) SI4, Pooled SEM, Effect of species, and Effect of time. Row labels include different time points (2, 4, 6, 8 hours) and species (Broiler chicken, Pig). The table also includes pooled SEM values and effects of species and time. Row 1: Broiler chicken, 2, 2469, 175, 39.1, 5.71b. Row 2: Broiler chicken, 4, 2643, 203, 32.8, 6.10b. Row 3: Broiler chicken, 6, 1872, 159, 23.6, 7.29b. Row 4: Broiler chicken, 8, 2698, 291, 43.0, 5.37b. Row 5: Pig, 2, 3001, 1429, 53.6, 17.5a. Row 6: Pig, 4, 2295, 1264, 42.0, 17.9a. Row 7: Pig, 6, 2902, 1019, 24.9, 18.1a. Row 8: Pig, 8, 2002, 917, 25.7, 6.81b. Row 9: Pooled SEM, 593.1, 194.9, 8.67, 2.767. Row 10: Effect of species, Broiler chicken, 2421, 207, 34.6, 6.12. Row 11: Effect of species, Pig, 2550, 1157, 36.6, 15.1. Row 12: Effect of time, 2, 2735, 802, 46.4, 11.6. Row 13: Effect of time, 4, 2469, 733, 37.4, 12.0. Row 14: Effect of time, 6, 2387, 589, 24.3, 12.7. Row 15: Effect of time, 8, 2350, 604, 34.4, 6.09. The table also includes P values for species, time, and species*time interactions.
SI, small intestine.
* SI 1–4: Jejunum and ileum were cut into four equal length parts. SI1 and SI4 represent the first and fourth quarters, respectively.
a,b,c Values within a column with different superscripts differ significantly at P < 0.05.
Serum metabolites
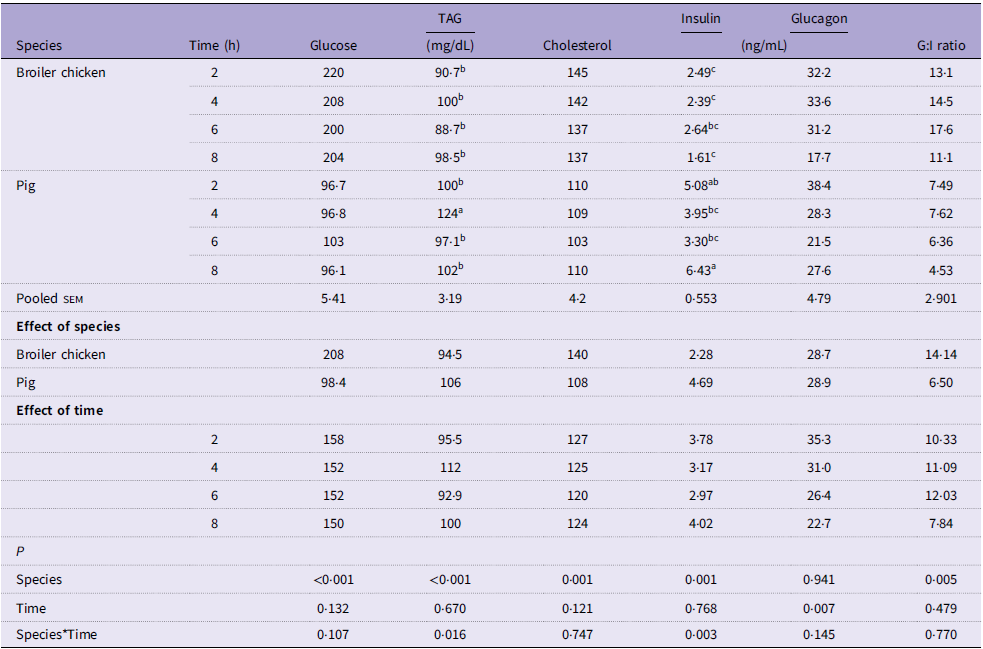
Serum glucose and total cholesterol levels were higher in broilers than pigs regardless of post-feeding time (P < 0·001; Table 8). Serum TAG were higher in pigs at 4 h post-feeding than at other times (P < 0·05). Overall, pigs exhibited higher insulin levels than broilers (P < 0·05), peaking at 8 h post-feeding, whereas in broilers, values remained stable across time points. Glucagon levels were similar between species and declined over time (P < 0·05). Because of the lower insulin levels, the G:I ratio was higher in broilers than in pigs (P < 0·05), with no effect of post-feeding time.
Serum metabolites of broilers and pigs collected at different post-feeding times after a single meal

Table 8. Long description
The table presents data on serum metabolites of broiler chickens and pigs collected at different post-feeding times after a single meal. It includes measurements of glucose, triacylglycerol (TAG), cholesterol, insulin, glucagon, and the glucagon-to-insulin (G:I) ratio. The table has 20 rows and 9 columns. Column headers are Species, Time (h), Glucose (mg/dL), TAG, Cholesterol, Insulin (ng/mL), Glucagon, and G:I ratio. Row labels include specific times (2, 4, 6, 8 hours) and grouped rows for pooled SEM, effect of species, effect of time, and P values. Notable trends include variations in glucose, TAG, cholesterol, insulin, glucagon, and G:I ratio across different species and times.
G:I, glucagon-to-insulin ratio.
a,b,c Values within a column with different superscripts differ significantly at P < 0·05.
Marker passage dynamics
Marker type (TiO2 or Cr-EDTA) had no effect on the proportions exiting the anterior tract or exiting the SI at any time point (Figure 3), and no species v. marker interactions were observed. Overall, at 2 h post-feeding, approximately 60 to 65 % of both markers had exited the anterior tract of broilers and pigs, increasing to 80 % by 4 h and reaching 90–95 % by 8 h. However, a species effect was detected at 4 and 8 h (P < 0·05), with pigs showing slightly greater proportions exiting the anterior tract than broilers at these time points. The proportion of both markers exiting the SI increased over time, ranging from 26–35 % at 2 h to 68–83 % at 8 h post-feeding for both species, but a tendency (P < 0·1) was observed for pigs having higher proportions of markers exiting the SI at 8 h post-feeding (slightly faster for Cr-EDTA at 82·9 % v. 77·6 % for TiO2, but not significantly different) compared with broilers (68·9 for TiO2. 72·4 % for Cr-EDTA).
Proportion of solid-phase marker (titanium dioxide, TiO2) and liquid-phase marker (chromium(III) EDTA, Cr-EDTA) exiting the anterior tract or exiting the SI of broilers and pigs at different post-feeding times following a single meal. All animals had 1-h access to maize-based pelleted diets prior to sampling at 2, 4, 6 and 8 h post-prandial, and rates were calculated relative to feed intake during this hour. Anterior tract comprises the crop, proventriculus and gizzard of broilers or stomach of pigs. SI, small intestine.

Figure 3. Long description
Panel A: A line graph showing the proportion of eaten markers exiting the anterior tract in broilers and pigs over time. The horizontal axis represents time in hours post-feeding (2, 4, 6, 8 hours), and the vertical axis represents the proportion of eaten marker in percent. Four data lines are shown: Broilers (Cr-EDTA), Pigs (Cr-EDTA), Broilers (TiO2), and Pigs (TiO2). The proportion of eaten markers increases over time for all lines. Panel B: A line graph showing the proportion of eaten markers exiting the small intestine in broilers and pigs over time. The horizontal axis represents time in hours post-feeding (2, 4, 6, 8 hours), and the vertical axis represents the proportion of eaten marker in percent. Four data lines are shown: Broilers (Cr-EDTA), Pigs (Cr-EDTA), Broilers (TiO2), and Pigs (TiO2). The proportion of eaten markers increases over time for all lines.
The proportion of markers exiting the SI at every 2 h interval differed between species, but not between markers (Figure 4). During the first 2 h, passage of markers through the whole anterior tract and SI was similar between broilers and pigs for both Cr-EDTA and TiO₂, although slightly faster for Cr-EDTA than TiO2 in pigs (35·5 v. 26·3 %, but not statistically significant). In contrast, during the next interval from 2 to 4 h, the passage of markers out of the SI slowed down compared with pigs (P < 0·05). During the 4–6 h interval, marker flow increased in broilers, and it was higher than pigs (P < 0·05), but from 6 to 8 h, again the amount of markers passing out of the SI of broilers was lower (P < 0·05).
Proportion of solid-phase marker (titanium dioxide, TiO2) and liquid-phase marker (chromium(III) EDTA, Cr-EDTA) exiting the small intestine (SI) of broilers and pigs and disappearing at 2-h post-prandial intervals following a single meal. All animals had 1-h access to maize-based pelleted diets prior to sampling at 2, 4, 6 and 8 h post-prandial, and rates were calculated relative to feed intake during that 1 h.

Figure 4. Long description
A line graph showing the proportion of eaten markers exiting the small intestine over different post-feeding intervals for broilers and pigs. The horizontal axis represents the post-feeding interval in hours (0-2, 2-4, 4-6, 6-8), and the vertical axis represents the proportion of eaten marker exiting the small intestine in percent. The graph includes four data lines: Broilers (Cr-EDTA) with a dashed grey line, Pigs (Cr-EDTA) with a dashed black line, Broilers (TiO2) with a solid grey line, and Pigs (TiO2) with a solid black line. The data shows varying trends for each marker and species over the post-feeding intervals.
The distribution of TiO₂ throughout the different segments of the GIT (Figure 5) was overall consistent with a forward marker progression in both pigs and chickens, but slight differences between the species were also observed. The proportion of TiO₂ recovered in the anterior tract decreased over time (P < 0·001), from an average of 36·1 % at 2 h to 7·5 % of TiO2 remaining in the anterior tract of both species after 8 h post-feeding. Proportion of TiO2 in the duodenum (values not shown in the Figure) was 1·03, 1·41, 1·10 and 0·99 % for broilers at 2, 4, 6 and 8 h post-feeding, respectively, and 0·15 % at 2 h and 0·12 % at 4, 6 and 8 h post-feeding for pigs. In the SI1 (values not shown in the Figure), proportions of TiO2 at 2, 4, 6 and 8 h post-feeding were, respectively, 3·42, 3·70, 2·45 and 1·90 % for broilers, and 1·92, 1·58, 2·38 and 1·78 % for pigs. Therefore, proportion of TiO2 in the duodenum and SI1 was consistently higher in broilers than pigs at all time points (P < 0·05) and did not change over time. In the second and third quarters of the SI (SI2 and SI3), TiO2 recovery initially increased from 2 to 4 h and then declined from 4 h onwards (P < 0·05) for both species. In the SI4, broilers showed stable TiO2 proportions across post-feeding times (between 7 and 9·9 %), whereas pigs exhibited a higher proportion of TiO₂ (20·4 %) after 2 h, which then reached values similar to broilers by 6 and 8 h post-feeding (10·7 and 7 %, respectively). The proportion of TiO2 exiting the SI increased over time (P < 0·001) in similar manner between both species; at 2 h post-feeding, an average 30·6 % of the marker had passed beyond the SI of pigs and chickens, increasing to 73·3 % at 8 h.
Distribution of titanium dioxide (TiO2) in different segments of the gastrointestinal tract of broilers and pigs at different post-feeding times, following a single meal. All animals had 1-h access to maize-based pelleted diets prior to sampling, and the distribution was calculated based on feed intake and amount of TiO2 consumed during this hour. Anterior tract comprises the pooled contents of crop, proventriculus and gizzard of broilers or stomach of pigs. SI, small intestine.

Discussion
Comparing digestive physiology between broilers and pigs is challenging due to species-specific differences in optimal feed particle size, nutritional needs and gut anatomy. Some of the limitations surrounding a comparative study of this nature have been discussed in our previous work(Reference Bassi, Hejdysz and Pruszyńska-Oszmałek23). The experimental diets were finely ground (about 600 μm) to avoid them being a disadvantage for the pigs, as the particle size is closer to the recommended value for pigs(Reference Vukmirović, Čolović and Rakita44) but still tolerable for broilers(Reference Amerah, Ravindran and Lentle20). Due to this fine grinding, oat hulls were added as insoluble fibre source in the adaptation diet for broilers to ensure adequate gizzard development prior to the experimental period. The separation between duodenum, jejunum and ileum of poultry is more straightforward across studies, but less evident in pigs, particularly between the jejunum and ileum(Reference Laerke, Hedemann, Bach-Knudsen, Kjeldsen, Poulsen and Jensen45); while we previously attempted to follow anatomical references when defining SI segments for both species(Reference König and Liebich35,Reference Laerke, Hedemann, Bach-Knudsen, Kjeldsen, Poulsen and Jensen45) , in the current study the jejunum and ileum were divided into four equal-length parts to minimise species-related discrepancies. A limitation of this approach is that the segments may not be interpreted as anatomically equivalent regions between broilers and pigs. However, it was the preferred method to provide a more standardised comparison of digestion and marker kinetics and to facilitate comparison with previous references that applied a similar segmentation of the SI.
Broilers exhibited a greater relative anterior tract mass and relatively longer SI compared with pigs based on BW. A higher anterior tract mass in chickens stems primarily from the highly developed musculature of the gizzard and development of the crop as a specialised food storage organ(Reference Svihus24,Reference Classen, Apajalahti and Svihus46) . Elefson et al.(Reference Elefson, Lu and Chevalier47) reported a relative stomach weight of 7·03 g/kg BW in pigs weighing 28·1 kg, whereas in broilers Gorenz et al.(Reference Gorenz, Oelschlager and Jespersen48) reported a relative weight of 32·3 g/kg for the crop, proventriculus and gizzard combined in 25-d-old (1·0 kg live BW) fast-growing chickens. Corroborating our findings, studies report a relative SI length of 57–58 cm/kg BW in pigs weighing approximately 23 to 28 kg(Reference Elefson, Lu and Chevalier47,Reference Adeola and King49) , whereas Gorenz et al.(Reference Gorenz, Oelschlager and Jespersen48) found a relative SI length of 132 cm/kg BW in 25-d-old chickens and Kokoszynski et al.(Reference Kokoszyński, Bernacki and Saleh50) reported 98 cm/kg BW in 42-d-old broilers (2·1 kg live BW). However, in broiler chicks, the relative growth of the intestine plateaus at approximately 9 d of age(Reference Nitsan, Dunnington and Siegel51), whereas in pigs it remains relatively constant until approximately 70 kg BW(Reference Elefson, Lu and Chevalier47). In contrast, pigs have a markedly larger hindgut in proportion to the GIT than chickens(Reference Moran and Bedford9), likely owing to their more extensive post-ileal fermentation process compared with poultry(Reference Svihus, Choct and Classen52).
Some of the current findings are consistent with our previous trial(Reference Bassi, Hejdysz and Pruszyńska-Oszmałek23) and reinforce species-specific differences in the GIT, such as the more acidic gastric environment observed in broilers and the greater proportion of small particles (<0·2 mm) found in the duodenal digesta of broilers compared with pigs. DM content in the tract, while only descriptive, further evidences the consistently higher DM of digesta in poultry(Reference Moran and Bedford8). The probable causes and implications of such findings to starch digestion capacity of broilers have been previously discussed(Reference Bassi, Hejdysz and Pruszyńska-Oszmałek23). When assessing apparent starch digestibility in the whole jejunum and ileum, we observed no differences between species, but rather an effect of cereal type. However, the current study was built on the premise that broilers would exhibit a more rapid flow of starch through the GIT compared with pigs due to differences in gut anatomy and feed retention. By equally dividing the segments into four parts, it was possible to observe that starch digestibility in the SI1, SI2 and SI3 was higher in broilers than pigs. Between 2 and 4 h post-prandial, starch digestibility in SI2 of broilers, for instance, was on average 0·92, compared with approximately 0·88 in pigs. This earlier digestion of starch confirms our hypothesis that broilers are adapted to a more rapid breakdown of starch in the proximal SI, enabled specially by gizzard activity, finely grinding particles before they enter the duodenum. In the second quarter of the SI, PSD differences between species were less evident, suggesting that the small particles exiting the gizzard have been rapidly digested and absorbed due to their higher surface area, allowing easier enzyme access(Reference Amerah, Ravindran and Lentle20). In addition, both the current and previous studies observed greater N digestibility in the distal SI of broilers compared with pigs, which suggests the lower gizzard pH could be improving proteolytic action in the GIT(Reference Shewry and Halford53).
Other individual studies evaluating segmental starch digestibility in pigs and broilers show varying results, but overall corroborate our findings on interspecies differences. Amaral et al.(Reference Amaral, Amaral and Cantarelli54) found 0·60 apparent digestibility of starch in the initial SI (duodenum + beginning of jejunum) and 0·75 in the proximal-to-middle jejunum of pigs fed diets with 550 µm maize. Martens et al.(Reference Martens, Flécher and de Vries55) reported a lower digestibility (0·33) in the the SI’s first quarter (SI1) of pigs fed maize diets with different processing compared with this study (about 0·73), likely because the duodenum was included within SI1 in their study. Despite this, they also observed near-complete starch digestion in the distal SI (SI4). In broilers, Herwig et al(Reference Herwig, Schwean-Lardner and van Kessel56) reported a high starch digestibility in the proximal jejunum of 28-d-old broilers, ranging from 77·9 % to 87 % depending on the inclusion of wheat (rapidly digested) and pea (slowly digested) starch to the diet, then reaching 97–98 % digestibility in the distal ileum. Selle et al.(Reference Selle, Moss and Khoddami57) evaluated segmental starch digestibility throughout common feedstuffs for broilers and reported 0·71–0·73 starch digestibility in the proximal jejunum of 28-d-old broilers fed maize diets, increasing to 0·83–0·90 in the distal jejunum. Evidently, grain type and particle size are key factors to starch digestion kinetics and final digestibility values in both poultry and pigs and must be considered when interpreting species differences and when applying them to practical diet formulations.
In SI1, region of peak amylolytic action, amylase activity per g of TiO2 was similar between species but sharply declined in the SI4 of broilers, a sign that maintaining high amylase levels distally may not be necessary in broilers due to a rapid starch digestion in the proximal SI. The greater lipase activity observed in the final quarter of the SI in pigs agrees with our previous observation(Reference Bassi, Hejdysz and Pruszyńska-Oszmałek23), viewed as a probable adaptation to digesting high-fat levels in sow milk(Reference Liu, Lyu and Liu27). The role of salivary amylase in pigs also should not be neglected, as it may remain active in distal parts of the SI(Reference Martens, Bruininx and Gerrits28) and could contribute to an early digestion of starch in the pigs’ stomach(Reference Martens, Flécher and de Vries55), as supported by the tendency for higher starch digestibility in the duodenum of pigs compared with broilers observed in our study.
Serum glucose was higher, and serum insulin was lower in broilers than pigs across all post-feeding times. This was expected, as birds consistently maintain high plasma glucose concentrations (about 200 mg/dL) as an evolutionary adaptation to the high energy demands of flight, while maintaining low insulin levels and, consequently, high G:I ratio(Reference Braun and Sweazea58,Reference Quattrone, Picozzi and Lubian59) . Despite the faster proximal starch digestion observed in this study, post-prandial glucose regulation in broilers is less pronounced and less responsive to insulin, not being directly related to digestion dynamics(Reference Selle, Macelline and Wang60). In mammals, glucose plasma concentration is more tightly regulated, as disruptions in blood glucose can lead to hyperglycaemia(Reference Polakof, Mommsen and Soengas61). The slower and more gradual starch digestion observed in pigs could perhaps be associated with a more sustained insulin response, which is essential to improve energy and amino acid utilisation efficiency(Reference Regmi, Matte and van Kempen62).
While poultry in general are described as having faster digesta passage than pigs, particularly in total tract measurements(Reference Svihus and Itani10,Reference Wilfart, Montagne and Simmins11) , non-comparative studies indicate that upper GIT retention can be similar between both species depending on marker type and diet. In pigs, Wilfart et al.(Reference Wilfart, Montagne and Simmins11,Reference Wilfart, Montagne and Simmins17) reported feed MRT ranging from 0·9 to 1·2 h in the stomach and 3·6 to 4·3 h in the total SI regardless of dietary fibre content or marker phase, whereas Lannuzel et al.(Reference Lannuzel, Veersma and van Erven15,Reference Lannuzel, Veersma and Wever16) observed 20–90 min MRT for liquids, 1–4 h for fine solids and up to 7–10 h for coarse fibrous particles in the stomach, with a consistent 2–4 h in the SI. Dorado-Montenegro et al.(Reference Dorado-Montenegro, Dijksman and Gerrits18), compiling data from four pig experiments, reported a wider range of MRT, with stomach retention ranging from 0·9 to 10 h for solids and 0·2 to 6·6 h for liquids and SI retention ranging from 0·5 to 4·8 h for solids and 0·5–7h for liquids. In broilers, Dorado-Montenegro et al.(Reference Dorado-Montenegro, Habibi and Gerrits13) reported MRT about 1 h (liquids) to 2 h (solids) in the anterior tract and 3·2–4·1 h in the total SI, also depending on dietary fibre. Vergara et al.(Reference Vergara, Ferrando and Jiménez14) reported longer retentions in the gizzard, from 1 h (liquids) to up to 6 h (fibre-rich rice husks). A review by Svihus and Itani(Reference Itani and Svihus33) showed that passage through the total SI is less influenced by dietary conditions, ranging from approximately 2 to 5 h. The largest interspecies differences may occur in the hindgut, reaching up to 44 h retention in pigs(Reference Wilfart, Montagne and Simmins11) but 3 to 5 h in broilers(Reference Dorado-Montenegro, Habibi and Gerrits13). Notably, solids largely bypass the avian caeca, while liquids can be selectively refluxed and retained in the caeca for up to 25 h(Reference Garçon, Ellis and Powell63). Despite the variation seen among these studies, they support that upper GIT passage can be comparable in broilers and pigs, with differences being more apparent in the hindgut. In this study, the cumulative marker passage through the stomach and SI was overall similar, but interesting species effects were still found, particularly when looking at the interval-based analysis. During the first 2 h post-feeding, both species rapidly fill up the SI to initiate digestion, whereas from 2 to 4 h marker flow in broilers was minimal. From 4 to 6 h, passage in broilers increased again and then again declined in the interval of 6–8 h, while pigs presented a more progressive flow. Although further studies are needed, these results are suggestive of the storage function of the anterior tract of broilers, alternating retention and release of digesta into the SI as digestion progresses(Reference Classen, Apajalahti and Svihus46), and are also consistent with anti-peristaltic movements pushing digesta back to the proximal SI, thereby increasing retention time and exposure to enzymes(Reference Sacranie, Iji and Choct25) and likely contributing to this intermittent release of digesta from the anterior tract. In contrast, the segmented surface of the SI of pigs slowly pushes digesta to ensure proper enzymatic action(Reference Moran and Bedford8); thus, marker transit in pigs was steadier.
Lastly, rheological behaviour of the feed may differ between species, as it has been previously discussed that MRT in pigs and poultry (mainly in the stomach area) can be shorter for liquids than for solids, particularly in fibre-rich diets(Reference Lannuzel, Veersma and van Erven15,Reference Lannuzel, Veersma and Wever16,Reference de Vries, Kwakkel and Pustjens19) . Liquid markers may pass more rapidly through the gizzard or stomach, while (coarse) solid markers or fibrous components like rice husk can be selectively retained. We observed however that the passage of both TiO2 and Cr-EDTA throughout the stomach and SI of broilers and pigs was similar. Notably, our experimental diet was finely ground and low in fibre content, which likely limited the chances of selective retention of TiO2 over Cr-EDTA(Reference Dorado-Montenegro, Habibi and Gerrits13,Reference de Vries, Kwakkel and Pustjens19,Reference de Vries, Beukers-van Laar and Garcia Ruiz64) . Factors such as feed PSD and the influence of fibre type and levels should be further explored in future comparative studies of marker dynamics and solid/liquid digesta behaviour between broilers and pigs. Naturally, digestion and passage are interconnected; thus, differences in marker dynamics will have an influence on digestibility calculations. In broilers, for instance, De Vries et al.(Reference de Vries, Kwakkel and Pustjens19,Reference de Vries, Beukers-van Laar and Garcia Ruiz64) discussed that the reflux of digesta and selective retention of solids may cause TiO₂ to accumulate, leading to overestimation of nutrient digestibility, while liquid markers may underestimate digestibility because of their rapid passage and disappearance from the SI. Martens et al.(Reference Martens, Flécher and de Vries55) further ties this dynamism to starch digestibility, as partly solubilised starch during digestion can behave as both insoluble and soluble fractions with distinct passage patterns. Consequently, the choice of marker and understanding of species-specific transit behaviour are critical when interpreting digesta phase segregation and digestion kinetics data.
In conclusion, this study further solidifies that, although starch digestibility and marker passage were overall similar between broilers and growing pigs, the underlying physiological mechanisms behind starch digestion efficiency and digestion kinetics of each species are different. This understanding is critical for interpreting digestibility studies and evaluating the application of novel ingredients, processing methods, nutrient and additives utilisation strategies, or digestive modelling.
Data availability statement
The data supporting the findings of this study are available from the corresponding author upon reasonable request.
Acknowledgements
The authors thank Klaudia Ciołek and the technical staff of the Agricultural Experimental Station Gorzyń (Gorzyń, Poland) of the Poznań University of Life Sciences (UPP, Poznań, Poland), Monika Kubiak and the technical staff of the Laboratory of the Department of Animal Nutrition and Feed Management of UPP, Marcin Hejdysz, Ewa Pruszyńska-Oszmałek, Paweł Kołodziejski, and Marcin Kujawa from UPP, and Frank Sundby from Norwegian University of Life Sciences (NMBU, Ås, Norway).
Author contributions
LSB planned the study and animal experiments, conducted data collection and statistical analysis and drafted the paper. AJC provided data consultation and validation. SAK and BS conceived and supervised the research. All authors revised and approved the final manuscript.
Financial support
This research was financially supported by the project ‘Increased SUStainability through a higher use of barley and oats in BROILer production’ (Norwegian Reserch Council, project number 320308), and with support from UPP (Poznań, Poland), NMBU (Ås, Norway), DSM-firmenich (Derbyshire, UK), Felleskjøpet Forutvikling A.S. and Nortura S.A. (Oslo, Norway). The data that support the findings of this study are available upon reasonable request.
Competing interests
The authors declare that they have no known competing financial interests or personal relationships that could influence the work reported in this paper.