

INTRODUCTION
The tropical eastern Atlantic surgeonfish Acanthurus monroviae (Steindachner, 1876) is native along the coast of Africa (Morocco to Angola) and the São Tomé, Cape Verde and Canary Archipelagos. However, some vagrants of this species have been occasionally seen outside their normal geographical range in the Mediterranean (Crespo et al., Reference Crespo, Rey and Garcia1987; Golani & Sonin, Reference Golani and Sonin1996; Hemida et al., Reference Hemida, Diatta, Golani, Ben Souiss, Guelorget and Capape2004; Ben Souiss et al., Reference Ben Souiss, Diatta, Lamia and Capape2011) with a few specimens detected as far out as the Brazilian coast (Joyeux et al., Reference Joyeux, Floeter, Ferreira and Gasparini2001; Luiz-Júnior et al., Reference Luiz-Júnior, Floeter, Gasparini, Ferreira and Wirtz2004) and St Paul's Rocks in the equatorial Atlantic (Ferreira et al., Reference Ferreira, Luiz, Feitoza, Ferreira, Noguchi, Gasparini, Joyeux, Godoy, Rangel, Rocha, Floeter, Carvalho-Filho, Vianna, Hazin and Souza2009).
Here, we describe the occurrence of a specimen of A. monroviae at the Portuguese western coast in 2007 and discuss the significance of this observation in relation to the life-history characteristics of this species and the biogeography of this part of the western European shores.
MATERIALS AND METHODS
One adult specimen of Acanthurus monroviae was observed and photographed by divers at the Arrábida Marine Park at a site called ‘Pedra do Leão (38.43°N 9.07°W), on 30 December 2007 at 1100 hours and at 12 m depth. Water temperature was around 15°C and the estimated length was 25–30 cm.
Sea surface temperature (SST) was obtained for the period 1985–2009 (5-day average; 4 km grid; Pathfinder AVHRR SST; source: US National Oceanic and Atmospheric Administration (NOAA) http://www.nodc.noaa.gov/sog/pathfinder4km/userguide.html-last accessed 18 February 2010) and the long term average was calculated to produce a colour map of the Iberian Peninsula. Optimum interpolation SST for the region (37.9°–39°N – 10.1°–8.5°W) for the past 20 years was used as a proxy of the sea temperature in the marine park (source: NOAA http://www.emc.ncep.noaa.gov/research/cmb/sst_analysis/—last accessed 31 October 2012) as it was highly correlated with our in situ temperature data loggers located at 5 m depth during 2008 and 2009 (38.45°N 9.02°W). The North Atlantic Oscillation (NAO) Index (source: NOAA http://www.cpc.ncep.noaa.gov/products/precip/CWlink/pna/nao.shtml—last accessed 31 October 2012) was also obtained for the same period and both sets of data were analysed separately by season: winter (December to April) and summer (June to September).
RESULTS
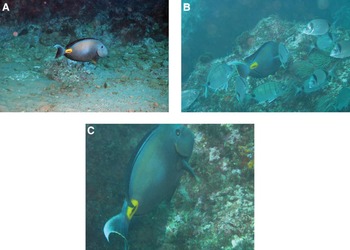
The specimen of Acanthurus monroviae (Monrovia doctorfish) was registered and photographed at the Arrábida Marine Park on 30 December 2012 at 12 m depth (Figure 1A–C). The fish was feeding on the rocky reefs together with a mixed school of common two-banded seabreams (Diplodus vulgaris) and white seabreams (Diplodus sargus).
Acanthurus monroviae (Monrovia doctorfish) observed on 30 December 2007 at the Arrábida Marine Park, Portugal (12 m depth). Photography credits: (A) Carlos Monteiro and (B, C) Cláudio Dias.

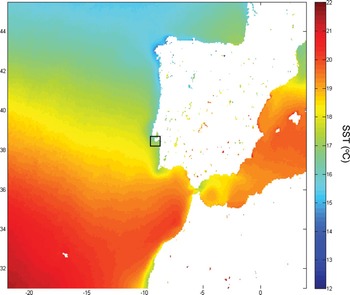
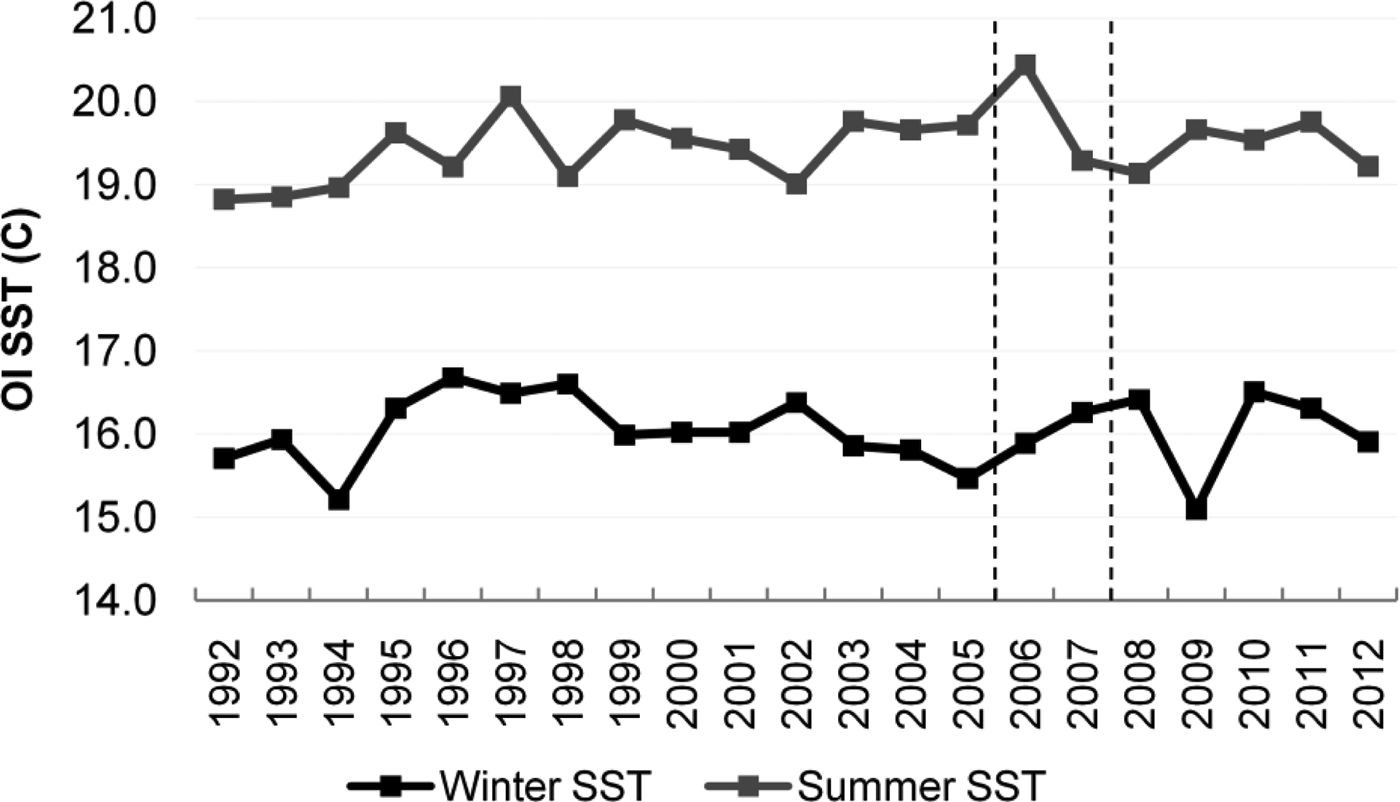
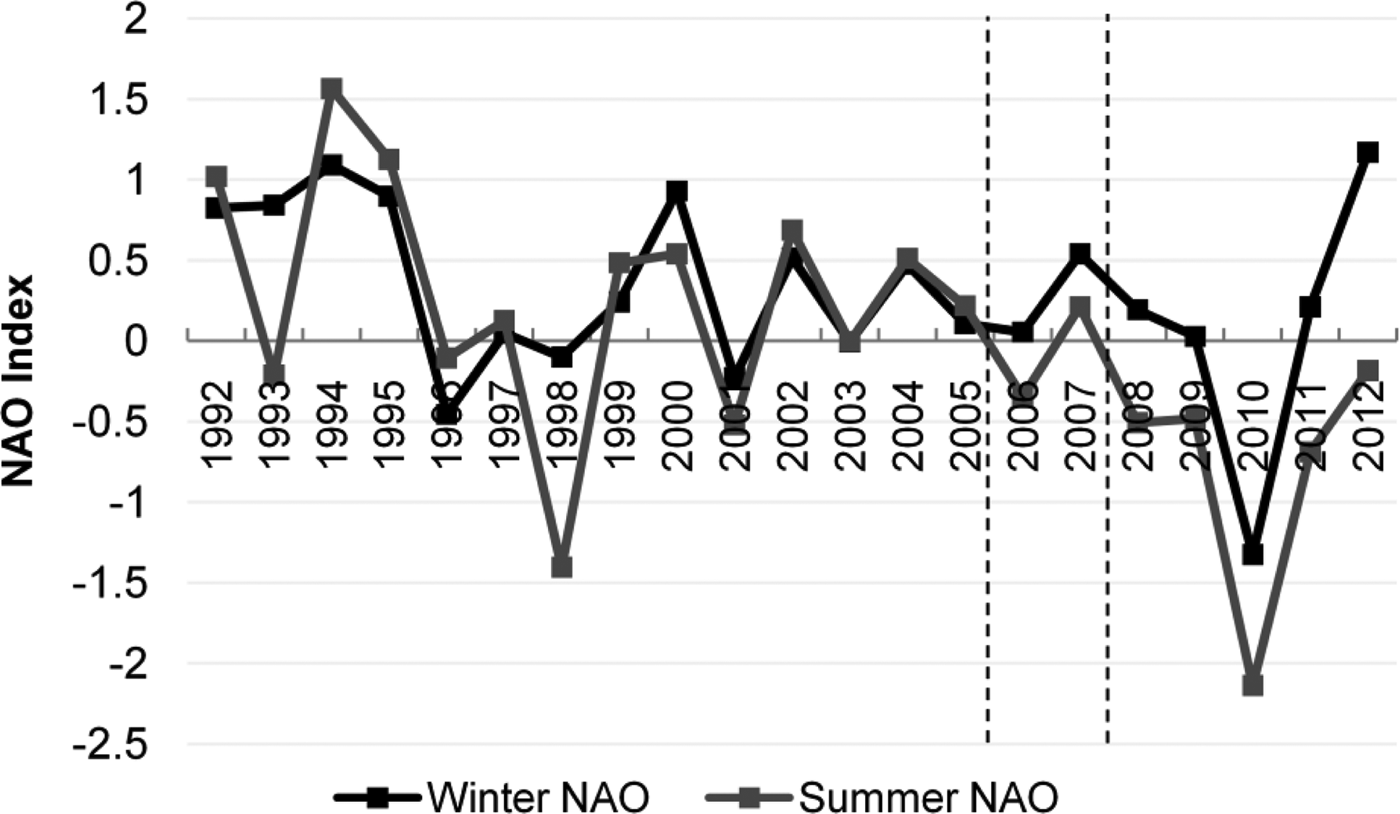
This marine park is located at an important biogeographic transitional zone between warm and cold temperate waters, as observed by the long term average of SST (Figure 2). Average optimum interpolation SST analysis showed that the year before the sighting (2006) was the warmest summer of the past 20 years, with a steady SST increase being observed since 2002 (Figure 3). Winter temperature also showed an increase from 2005 to 2008 (Figure 3). The annual NAO average was similar among seasons between 2001 and 2005 but after that, higher values were found in winter than in summer NAO (Figure 4). During 2006, the average summer NAO was negative and the winter NAO was close to zero. During 2007 a small peak was found in both NAO averages (Figure 4). In situ data loggers from 2008 and 2009, located at 5 m depth, revealed an annual temperature range between 11.5°C and 21.5°C within this marine park with December temperatures varying between 12.9°C and 16.9°C.
Long-term average sea surface temperature (SST; °C) in the Iberian Peninsula. Mean 5-day composite Pathfinder AVHRR SST, 1985–2009 (4 km). The location of the Arrábida Marine Park is shown.

Average seasonal optimum interpolation (OI) sea surface temperature (SST) by year (1992–2012) from the study region (source: US National Oceanic and Atmospheric Administration) with the years 2006/2007 highlighted.

Average seasonal North Atlantic Oscillation Index by year (1992–2012), with the years 2006/2007 highlighted (source: US National Oceanic and Atmospheric Administration).

DISCUSSION
Fish assemblages at the Arrábida Marine Park show a high variability among years, especially in species of tropical, warm-temperate and cold-temperate affinities. These changes in the coastal fish communities have been related to the intensity and duration of the winter NAO Index (Henriques et al., Reference Henriques, Gonçalves and Almada2007). This is a biogeographic transition zone between warm and cold temperate waters and is also near the northern limit of the main north-east Atlantic upwelling events (Wooster et al., Reference Wooster, Bakun and McLain1976). Summer SST in 2006 was the highest of the past 20 years and the NAO Index showed both winter and summer warm conditions. The long term average SST map also shows that the marine park is in a transition region between cold and warm waters, suggesting this is probably the northernmost location where most species of tropical affinity could eventually reach following a short-term increase in water temperature.
The first occurrence of Acanthurus monroviae (Monrovia doctorfish) in the Mediterranean was in Málaga (off the Spanish south coast) in March 1981 (Crespo et al., Reference Crespo, Rey and Garcia1987). Further records of vagrant individuals were documented in Israel in 1995 (Golani & Sonin, Reference Golani and Sonin1996) and Algeria in 2001 (Hemida et al., Reference Hemida, Diatta, Golani, Ben Souiss, Guelorget and Capape2004), the present record being the first one for the Atlantic coast of Europe. One puzzling question remains unanswered which is: what are the mechanisms by which these vagrant individuals reach such far locations as adults? In fact, the above mentioned examples, as well as the present case, all report sightings of adult fish and, at least at the Arrábida Marine Park, intensive sampling of nearshore communities was being performed. It is therefore highly unlikely that the reported individuals reached these areas as larvae or juvenile.
The mechanisms by which this species colonizes areas outside its natural home range remain unknown. Other species of surgeonfish are known to have extended periods of pelagic larval duration (PLD) as, for example, 45–70 days in Acanthurus bahianus, A. chirurgus and A. coeruleus (Rocha et al., Reference Rocha, Bass, Robertson and Bowen2002) with the species A. triostegus being able to delay metamorphosis and extend their PLD to 44–60 days (McCormick, Reference McCormick1999). This could offer a plausible explanation for how vagrant individuals of this species are found so far away from their natural distribution areas. However, since vagrant individuals in all the above mentioned cases are adults, other mechanisms must be at play.
The effects of stochastic climatic events on ocean currents (Joyeux et al., Reference Joyeux, Floeter, Ferreira and Gasparini2001) and some degree of habitat connectivity and/or viable dispersal mechanisms such as transport by currents in association with drifting materials (natural or artificial), may favour the direct dispersal of adults to areas outside their natural home range. Recently, Luiz et al. (Reference Luiz, Madin, Robertson, Rocha, Wirtz and Floeter2012) showed that rafting is a key mechanism for species crossing the mid-Atlantic barrier in the tropics, providing strong evidence that reef fish can overcome large oceanic distances by associating with drifting material. Additionally, winters with strong south winds and waves bring warm temperatures nearshore to the western Portuguese shore and are known to be linked with an increase in the occurrence of species with warm temperate and tropical affinities in this region (Henriques et al., 2007). One month after the detection of this surgeonfish (31 January 2008) fishers from Sesimbra village (a small fishing port inside the Arrábida Marine Park), caught one specimen of another tropical species, Fistularia petimba (red cornetfish) (local fishers, personal communication), adding these occurrences to a list of species with warm water affinity detected in this region. This makes the western Portuguese coast, in particular the region around the Arrábida Marine Park an important ‘barometer’ for studying the effects of more frequent environmental changes and a potential warmer ocean, with possibly permanent expansions of the geographical ranges of these species.
ACKNOWLEDGEMENTS
The authors thank the AMP/ICNB authority, in particular M. Henriques for all the marine park support. This study was financed by the Fundação para a Ciência e a Tecnologia (FCT) through the PDCT/MAR/57934/2004 project and the Pluriannual Program (R&D Unit 331/94). B.H.C. was supported by a PhD grant from FCT (SFRH/BD/41262/2007).