




No CrossRef data available.
ON THE ALTERNATIVE LONG-RUN VARIANCE RATIO TEST FOR A UNIT ROOT
Published online by Cambridge University Press: 15 March 2006
Abstract
This paper investigates the effects of consistent and inconsistent long-run variance estimation on a test for a unit root, based on the generalization of the von Neumann ratio. The results from the Monte Carlo experiments suggest that the unit root tests based on an inconsistent estimator have less size distortion and more stability of size across different autocorrelation specifications as compared to the tests based on a consistent estimator. This improvement in size property, however, comes at the cost of a loss in power. The finite-sample power, in addition to the local asymptotic power, of the tests with an inconsistent estimator is shown to be much lower than that of conventional tests. This finding can be well generalized to the test for cointegration in a multivariate system. The paper also points out that combining consistent and inconsistent estimators in the long-run variance ratio test is one possibility of balancing the size and power.The authors thank two anonymous referees, Pentti Saikkonen, and participants of the 2004 Midwest Econometrics Group meetings, 2005 Spring Meetings of The Japanese Economic Association, and a workshop at Vanderbilt University for helpful comments and suggestions.
Information
- Type
- Research Article
- Information
- Copyright
- © 2006 Cambridge University Press
1. INTRODUCTION
Conventionally, the autocorrelation robust inference relies on the consistent estimation of the long-run variance of the data. In the regression context, such an estimator based on the nonparametric kernel method is often referred to as the heteroskedasticity autocorrelation consistent (HAC) estimator and is frequently employed to construct standard errors or the Wald-type test statistics in the presence of serial correlation of unknown form (see, e.g., Newey and West, 1987; Andrews, 1991). HAC estimation, however, is known to suffer from small-sample bias that results in size distortion of the test statistics. Kiefer, Vogelsang, and Bunzel (2000) have recently proposed autocorrelation robust test statistics standardized by an inconsistent long-run variance estimator instead of a consistent estimator. Their alternative asymptotic approximation to the distribution of the test statistic incorporates the randomness of the (inconsistent) long-run variance estimator and is considered to have some advantages in improving the size properties compared to the conventional approach.
Since the influential paper of Phillips (1987), nonparametric long-run variance estimation has also played an important role in the unit root/cointegration literature. The nonparametric or semiparametric unit root test designed to incorporate general serial correlation, however, is known to suffer from some size distortion for the same reason as the test with HAC estimation in the standard regression model. Therefore, it seems reasonable to investigate whether the inconsistent estimation of the long-run variance provides a useful alternative approach in the unit root test in addition to in the tests in the regression model. In this paper, we conduct theoretical and simulation analyses on the effect of consistent and inconsistent long-run variance estimation in testing for a unit root. In particular, we focus on a class of nonparametric tests based on the generalization of the von Neumann (VN) ratio. This class of the unit root test includes the test considered by Sargan and Bhargava (1983) and Bhargava (1986), the class of the locally best invariant (LBI) test considered by Nabeya and Tanaka (1990), the Lagrange multiplier (LM) test of Schmidt and Phillips (1992), the modified Sargan–Bhargava (MSB) test considered by Stock (1994, 1999) and Perron and Ng (1996), and a nonparametric unit root test of Breitung (2002). Its multivariate extension includes the cointegration tests considered by Phillips and Ouliaris (1990), Shintani (2001), and Harris and Poskitt (2004).
The main reason for the choice of the VN ratio test in our analysis, rather than the more commonly used nonparametric variation of the Dickey–Fuller type test proposed by Phillips (1987) and Phillips and Perron (1988), is its convenience in considering the properties of the long-run variance estimation under the null and alternative hypotheses. In a typical regression framework, the true long-run variance used to standardize the Wald test statistic is common under both null and alternative hypotheses. In the test for a unit root, this is not the case. To be more specific, estimation of a positive long-run variance of the first differenced observation (or the error term) is often required for the test statistic to have a nuisance parameter free limiting distribution under the null hypothesis of a unit root. Under the alternative hypothesis of a stationary root, however, the long-run variance of the same variable becomes zero because of overdifferencing. In contrast, the long-run variance of the variable in level is positive and finite under the alternative, whereas the corresponding long-run variance cannot be defined under the null hypothesis. The unit root test statistic we consider is constructed using the ratio of the long-run variance estimator of the first differenced series to that of the series in levels. Because the growth rate of the bandwidth in the kernel estimator is the key to distinguishing the consistent estimator from the inconsistent estimator, the various combinations of the bandwidths in the numerator and denominator in the long-run variance ratio offer a systematic way to investigate the effect of new approach under both the null and alternative hypotheses.
The remainder of the paper is organized as follows. Section 2 introduces the long-run variance ratio test for a unit root and derives its limiting distribution under different assumptions on the growth rate of bandwidths. The finite-sample size properties of each test are investigated by a Monte Carlo simulation in Section 3. The power of the test is studied in Section 4. Some extensions, including the analysis of cointegration, are considered in Section 5. Finally, concluding remarks are made in Section 6. Throughout this paper, we use the symbols

to signify weak convergence and convergence in probability, respectively. All the limits are taken as the sample size T → ∞.
2. THE TEST STATISTICS
Let {yt}t=1T be a univariate time series generated by

where ut is a weakly stationary zero-mean error with a strictly positive long-run variance defined by

where γj = E(utut−j). For simplicity, the initial condition is set to y0 = 0. We consider a test for the null hypothesis of α = 1 against the alternative hypothesis of |α| < 1. Therefore, under the alternative hypothesis, yt is the zero-mean stationary process with the long-run variance ωy2 = (1 − α)−2ω2.
Throughout this paper, the long-run variance of the zero-mean series xt is estimated by a nonparametric kernel estimator with the Bartlett kernel,

where K is the bandwidth/lag truncation parameter. As emphasized in Newey and West (1987), this choice of the kernel function ensures nonnegative estimates, and thus the long-run variance ratio test statistic defined subsequently will always be nonnegative. In addition, this long-run variance estimator is known to be consistent when bandwidth K grows at a rate slower than T1/2, with an optimal growth rate being T1/3 under some moment conditions (Andrews, 1991). When xt has a nonzero mean,

where

will provide a consistent estimator. This estimator, however, becomes inconsistent if K grows too fast, for example, at the rate T. In what follows we have a convenient shortcut formula for the Bartlett kernel estimator when its bandwidth equals the sample size.
LEMMA 1. Let
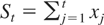
. Then, (2) with K = T can be written as
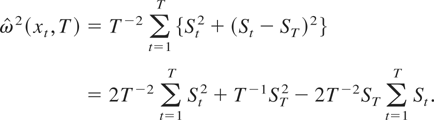
This lemma generalizes equation (1) of Kiefer and Vogelsang (2002) to the case when ST ≠ 0 and will be used to derive the main theoretical results of our paper.
The VN ratio is usually defined as the ratio of the sample variances of the first differences and the levels of a time series. The ratio is often applied to regression residuals to conduct the Durbin–Watson test for serial correlation. As a test statistic for a unit root hypothesis, however, we utilize the following generalization of the VN ratio:

where Δyt = yt − yt−1 for t = 1,…,T. This ratio replaces the sample variances in the original VN ratio with the sample long-run variances. If ut is independent and identically distributed (i.i.d.), the ratio with the choice of K = M = 1 can be used to test the null hypothesis of a unit root. But for the serially correlated ut, it does not provide the nuisance parameter free distribution under the null. We consider the following combinations of growth rates of K and M that provide asymptotically pivotal test statistics in the presence of serially correlated error, ut.

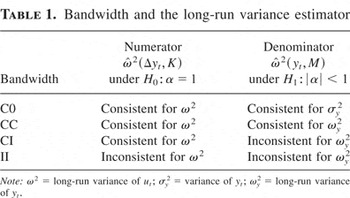
The choice of C0 is a combination of the bandwidth growth rates that ensures the numerator providing a consistent estimator of ω2 under the null and the denominator providing a consistent estimator of the variance of yt (or the autocovariance of order zero) under the alternative. With the choice of CC, the numerator provides a consistent estimator of ω2 under the null, and the denominator provides a consistent estimator of ωy2 under the alternative. CI is the case of the denominator being an inconsistent estimator of ωy2 under the alternative, whereas the numerator is still a consistent estimator of ω2 under the null. Finally, II is the combination in which both the numerator and denominator are inconsistent estimators under the null and alternative, respectively. The relationship between our assumptions on bandwidth and the asymptotic properties of the long-run variance estimators is summarized in Table 1. Note that employing a rate other than T1/3 is also possible in C0, CC, and CI, and theoretical results will not be affected as long as it provides a consistent estimator. The T1/3 rate is employed here simply because it is the optimal rate, and this particular rate will be used in the simulation in the next section.
Bandwidth and the long-run variance estimator

When nonzero mean stationarity or trend stationarity is allowed as an alternative hypothesis, a demeaned and detrended version of the unit root test is often employed in practice. The long-run variance ratio test can be also extended to these more empirically relevant cases. Suppose

. The demeaned and detrended test statistics are given by
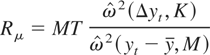
and
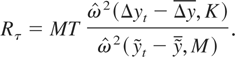
When K = M = 1, Rμ corresponds to the test of Sargan and Bhargava (1983) and Rτ corresponds to the R2 test proposed by Bhargava (1986). Note that Rτ is based on a detrending procedure that is efficient under the null. Schmidt and Phillips (1992) also showed that, for a Gaussian likelihood, the LM principle leads to these tests. With the choice of C0, the test is equivalent to the nonparametric extension of the VN ratio test considered by Nabeya and Tanaka (1990) and Schmidt and Phillips (1992). It is also equivalent to the MSB test considered by Stock (1994, 1999) and Perron and Ng (1996). The one-dimensional case of the cointegration tests considered by Phillips and Ouliaris (1990), Shintani (2001), and Harris and Poskitt (2004) reduces to the same unit root test under C0. The terms R and Rμ under CC are equivalent to P*(1,0) and Pμ*(1,0) of Shintani (2001), respectively. For II, Rμ is somewhat similar to the Breitung (2002) test based on the variance ratio

where

. Note that BR can be rewritten as
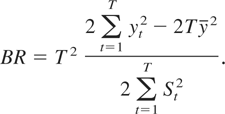
Applying Lemma 1 to (5) under II yields
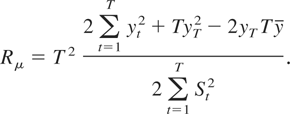
Therefore, the first term is common between the two test statistics. Nevertheless, two statistics are different with their own limiting distribution as the remaining terms are not negligible. In the simulation, we will also consider BR for the purpose of comparison.1
Recently, Müller (2005) also considered the effect of an inconsistent long-run variance estimator in his analysis of the test of stationarity. We do not consider his test here because its null hypothesis is not a unit root.
We now introduce the following assumption on the error term.
Assumption 1.
(a)

where δ and B are some positive constants.
(b) εt is i.i.d. with zero mean, variance σ2, and finite fourth cumulants, and εs = 0 for s ≤ 0.
Under Assumption 1, we have

where [Ts] signifies the integer part of Ts and W(s) denotes a standard Brownian motion defined on C[0,1]. The limiting distribution of the long-run variance ratio test is given in the following theorem.
THEOREM 1. Suppose that {yt}t=1T is generated by (1) with α = 1 and Assumption 1 is satisfied. Then,
(a) (Standard test)

where

.
(b) (Demeaned test)

where

.
(c) (Detrended test)

where

.
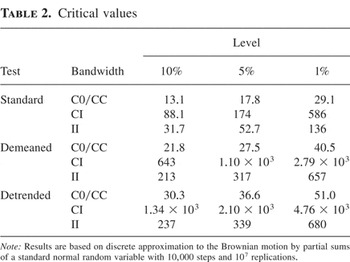
The limiting distribution of each test statistic is a function of a Brownian motion or a Brownian bridge. Evidently, this contrasts with the autocorrelation robust test in regression where only the test with an inconsistent long-run variance estimator has a nonstandard limiting distribution. Critical values for the limiting distribution of the long-run variance ratio tests with all the combinations of bandwidth growth rates are provided in Table 2. Numbers are obtained by simulation using an approximation of Brownian motion by partial sums of standard normal random variables with 10,000 steps and 107 iterations. In the following section, we evaluate the finite-sample size property of each test using these asymptotic critical values. Note that the test rejects the null hypothesis for large values of the long-run variance ratio and the critical region is constructed accordingly. The consistency of the tests is also provided in the following theorem.
Critical values

THEOREM 2. Suppose that {yt}t=1T is generated by (1) with |α| < 1 and Assumption 1 is satisfied. Then, for any bandwidth growth rate combinations C0, CC, CI, or II,

for any fixed constant c*.
In practice, the ordinary least squares (OLS) residuals from the regression model (1) are often used to estimate the long-run variance of ut to ensure the consistency of the unit root test. Theorem 2, however, shows that the long-run variance estimator, using the overdifferenced series Δyt under the fixed alternative, still provides consistency of the long-run variance ratio tests. This result is based on the fact that the long-run variance estimator based on Δyt converges to zero from a positive value at a sufficiently slow rate under the alternative. In the simulation that follows, we focus on the case with the long-run variance estimator using Δyt rather than using the quasi-differenced series from the OLS residuals. Nevertheless, the residual-based long-run variance ratio test seems to be a reasonable alternative to our test.
3. FINITE-SAMPLE SIZE OF THE TESTS
In this section, the finite-sample size properties of each test introduced in the previous section are investigated by a Monte Carlo simulation. We follow previous experimental studies in the unit root testing literature and consider the autoregressive (AR) and moving-average (MA) models to introduce serial correlation in the error term. In particular, our data generating process is (1) with α = 1 using the following three different error structures:

where εt is an i.i.d. standard normal random variable, ρ = −0.8, −0.5, 0.5, 0.8, and θ = −0.8,−0.5,0.5,0.8. Initial values y0, u0, and ε0 are set to 0. In all cases we use 10,000 replications. There is fairly general agreement that the data-based bandwidth selection method in the long-run variance estimation has very important effects on improving the finite-sample performance of the semiparametric and nonparametric unit root tests (see, e.g., Stock, 1994; Phillips and Xiao, 1998). For this reason, we use the Andrews (1991) automatic bandwidth selection procedure (designed for the Bartlett kernel) to select K when tests based on C0, CC, and CI are applied to AR(1) and MA(1) errors. For the test with CC, the value of the automatic bandwidth selected for K is also used for M. For i.i.d. errors, we simply use K = 1.
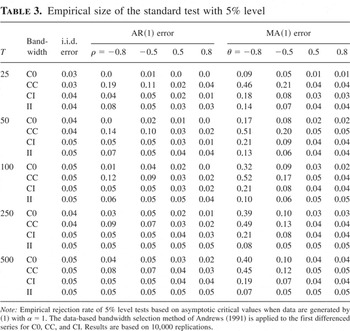
Table 3 reports the rejection frequency of the standard long-run variance ratio test, R, with an asymptotic level of 5% for a sample of five different sizes, T = 25, 50, 100, 200, and 500. For each pair of bandwidth growth rates, the first column shows the empirical size when the unit root process has an i.i.d. error. With the exception of a slight underrejection for the C0/CI case when T = 25, the empirical size of the long-run variance ratio tests is very close to the asymptotic level for all combinations of bandwidth growth rates. The difference among the various choices of bandwidth, however, becomes more evident when the error terms are serially correlated.
Empirical size of the standard test with 5% level

Consistent with the finding by Schwert (1989) for semiparametric unit root tests, the long-run variance ratio tests suffer from size distortion mostly in the case of the near MA unit root (θ = −0.8). Overrejection is observed for all tests, which implies that the tests are too liberal. However, when inconsistent asymptotics are used for both the numerator and the denominator (II), the size distortion becomes smaller, and the empirical size approaches the asymptotic level as sample size increases. In contrast, the size distortion of other tests for the near MA unit root case does not disappear, even for T = 500. The size distortion appears to be largest when the test is based on CC. The problem seems to be less severe when the combination of the consistent and inconsistent estimators (CI) is employed in comparison with the conventional case (C0 and CC) when the sample size increases. For the positively correlated MA error (θ = 0.5,0.8), the tests based on CC, CI, and II have their empirical size quite close to the nominal size. In this case, only the test with C0 has a noticeable size distortion that results in the conservative test.
On the whole, the size distortion seems to be somewhat less severe for the AR errors compared to the MA errors. The empirical size of the test with C0 is smaller than the nominal size for the entire range of AR parameters, which suggests that the test is too conservative. The largest deviation from the nominal size is observed in the test with CC when AR errors are positively correlated (ρ = 0.5,0.8). In contrast to the C0 case that underrejects for all cases, the test with CC overrejects when AR parameters are positive (ρ = 0.5,0.8), but underrejects when AR parameters are negative (ρ = −0.8,−0.5). As in the MA error results, the AR error results again favor the tests that involve inconsistent estimators, namely, the CI and II cases. When the sample size increases, both tests have a size that is very close to the asymptotic level for all values of AR parameters.
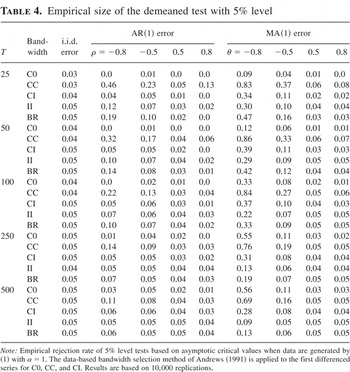
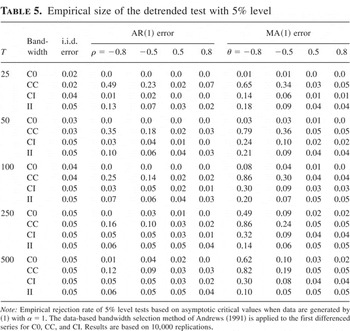
Tables 4 and 5 report the same results for Rμ and Rτ, respectively. For the i.i.d. error and positively correlated error, the size performance of the demeaned and detrended tests is very similar to that of the standard case except for a very small sample (T = 25). For the negatively correlated case, the problem of size distortion becomes more severe in general. In particular, rejection frequency increases substantially with CC for the negatively correlated MA error. When II is used, however, stability of size remains for θ = −0.5, and increases in the rejection frequency seems to be very modest, even for θ = −0.8, compared to the other choice of bandwidths. The size performance of BR test is somewhat similar to that of the demeaned test with II.
Empirical size of the demeaned test with 5% level

Empirical size of the detrended test with 5% level

In summary, consistent with the previous findings in the literature, the test based on a consistent nonparametric long-run variance estimator suffers from substantial size distortion when the errors are negatively correlated. In contrast, the empirical size of the test using a pair of inconsistent estimators seems to be very close to nominal size on the whole regardless of the serial correlation structure. Therefore, in terms of stability and accuracy of size, this choice of bandwidth growth seems to be the most effective one, with the combination of consistent and inconsistent estimators the second best.
4. POWER OF THE TESTS
In the previous section, we found that it was possible to improve the size of the long-run variance ratio test for a unit root by introducing inconsistent long-run variance estimators. This section investigates the power properties of the same tests.
First, we consider the limiting distribution under the local alternative α = 1 + T−1c for a particular value of c < 0. As in the case of other unit root tests, the limiting distribution involves the functional of a diffusion

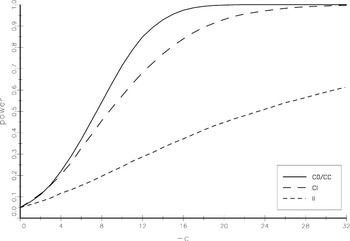
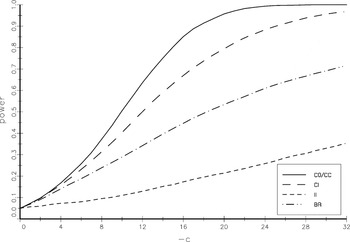
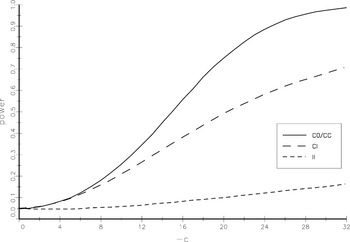
. Under this local alternative, all the asymptotic results in Theorem 1 hold by replacing W(s) with Jc(s). This can be shown by using an argument similar to that of Stock (1999) in his analysis of the local asymptotic power of the MSB test. The local asymptotic power functions of R,Rμ, and Rτ for various bandwidth growth rates based on the 5% level are plotted in Figures 1, 2, and 3, respectively. They are approximated by discrete Gaussian random walks with 500 steps with 10,000 replications. For the standard test (R) in Figure 1, the C0/CC and CI cases have similar power when c is close to zero. The difference between their power and that of the II case is evident even if c is close to zero. Although the power of the CI case is slightly below the C0/CC power function for moderate values of c, both power functions become 1.00 relatively fast for distant alternatives. In contrast, the power for the II case is considerably lower for the entire range of local alternative parameter c. It becomes only about 0.5 even if the c is as small as −24. The local asymptotic power functions of the demeaned and detrended tests (Rμ and Rτ in Figures 2 and 3) show the reduction of the local power by detrending the data compared to their corresponding power for the standard test. However, in terms of the ranking and pattern among the different choices of bandwidth, they are very similar to those of the standard tests. Figure 2 also contains the local asymptotic power of the BR test, which shows higher power relative to the II case but lower power relative to the other cases. In summary, the asymptotic power function of the tests based on the pair of inconsistent estimators (II) is well below other power functions for the entire range of c for all cases.

Asymptotic power functions: standard test.

Asymptotic power functions: demeaned test.

Asymptotic power functions: detrended test.
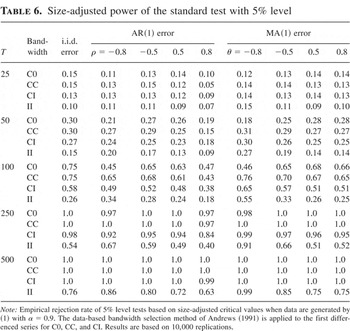
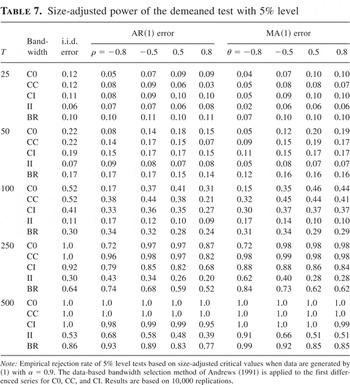
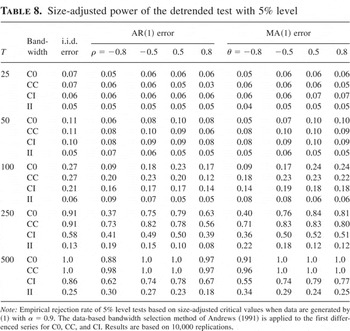
Second, we investigate the finite-sample power properties using a simulation design similar to the one used in the previous section. We first obtain small-sample size-adjusted critical values based on the results in Tables 3, 4, and 5. Note that the size-adjusted critical values are computed for all combinations of data generating process and sample size. We then generate the data from (1) with α = 0.9 using the same values of the error term used for the α = 1 case and apply the unit root test to the data. The frequencies of the rejection of the null hypothesis using the size-adjusted critical value are reported in Tables 6, 7, and 8. The four main findings from the tables are as follows. First, in agreement with the local asymptotic power result, the finite-sample size-adjusted power of the test with II is much lower than that of the tests with C0, CC, and CI. For example, when the error is i.i.d., the power of the standard, demeaned, and detrended tests is only 0.76, 0.53, and 0.25, respectively, even for the large sample with T = 500. For the same sample size, the power of other tests is 1.00 or at least close to 1.00. Second, the difference among the size-adjusted power of tests with C0, CC, and CI is modest compared to the much lower power of the II case. Among the group of C0, CC, and CI, the test with CC performs somewhat better than the other two when the error is negatively correlated, namely, AR(1) error with ρ = −0.8,−0.5 and MA(1) errors with θ = −0.8,−0.5. Third, with the exception of the detrended test with a large sample (T = 250, 500), the test based on CI shows reasonably good finite-sample power very close to the power of the tests based on C0 and CC. This fact is interesting given the finding of the previous section that the test with CI has a much better size property than tests based on C0 and CC. Fourth, for a large sample, the power of the BR test is higher than the power of the demeaned test with II but is lower than the power of the other demeaned tests.
Size-adjusted power of the standard test with 5% level

Size-adjusted power of the demeaned test with 5% level

Size-adjusted power of the detrended test with 5% level

The summary of this section follows. Both the local asymptotic power and the size-adjusted finite-sample power of the long-run variance ratio tests based on the pair of inconsistent estimators (II) are found to be dramatically lower than those of the test based on the pair of consistent estimators (C0 and CC). This suggests that the stability of size in the II case seems to be too costly to justify the usefulness of the inconsistent long-run variance estimator in the long-run variance ratio test for a unit root. However, at the same time, the tests based on the combination of consistent and inconsistent long-run variance estimators (CI) are found to have reasonable power and also a good size. Therefore, among the various pairs of bandwidth growth rates in the long-run variance ratio, the choice of CI may have some practical use in testing for a unit root.
5. EXTENSIONS
5.1. Response Surface Analysis
In the previous section, some specific rates of the bandwidth growth were chosen to represent the tests with consistent and inconsistent long-run variance estimators. For the case of the numerator of the test statistics, the bandwidth can be generally written as

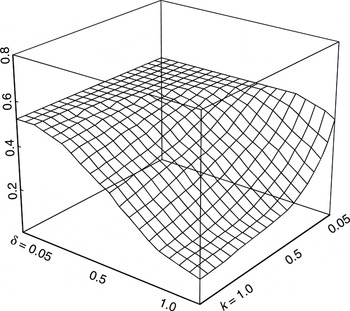
where k > 0 and 0 < δ ≤ 1. In particular, δ = 1/3 is used in C0, CC, and CI to represent the rate for the consistent estimator. This rate is known to minimize the mean square error of the long-run variance estimator when k = 1.1447 × (f(1)/f(0))2 where f(i) is the ith derivative of the spectral density of ut at frequency zero (Andrews, 1991). Theoretically, as long as the selected growth rate of the bandwidth provides a consistent long-run variance estimator, the limiting distribution of the test statistic under the null and its local asymptotic power do not depend on the rate or the choice of a constant k. Even so, the choice may have some effects on the small-sample performance of the test. For the case of the inconsistent long-run variance estimator in II, the choice of δ = 1 and k = 1 (K = T) is used because it has the simplest form in the sense that it does not require any truncation in the kernel estimation. Unlike the consistent case, however, even with a common growth rate T, the test statistics based on K = kT, with 0 < k < 1, will have different limiting distribution (and thus local asymptotic power) depending on the choice of a constant k. For these reasons it is of interest to see the sensitivity of the simulation results to the choice of parameters δ and k in (9). A similar argument can also be made with the choice of bandwidth M in the denominator of the test statistics. Here we conduct a simple response surface analysis of the (finite-sample) power of the test with various bandwidths that includes the cases of CC and II.
The simulation design is identical to the one used for the analysis of the finite-sample power in Section 4. For simplicity, we use the same bandwidth for the numerator and denominator (K = M) and report only the results for the demeaned test in the case of T = 100 and i.i.d. error. Both parameters, δ and k, vary from 0.05 to 1.0. Figure 4 shows the size-adjusted power of the test as a function of δ and k.

Size-adjusted power: demeaned test (T = 100).
The power turns out to be the lowest at 0.11 when both δ and k are the largest (δ = 1 and k = 1). Note that this number corresponds to the case of II with T = 100 and i.i.d. error in Table 7. For a fixed value of δ, the power increases as k decreases. Similarly, for a fixed value of k, the power increases monotonically as δ decreases. Finally, it also shows that no combination of δ and k provides a power higher than 0.52, the value obtained in Table 7 for the case of CC.
5.2. Cointegration
The long-run variance ratio test for a unit root can be generalized to test for cointegration (or cointegrating rank) in a multivariate system. Let

be the long-run variance covariance matrix of an n-dimensional vector xt, a multivariate generalization of (2). The test statistic for the null hypothesis of r cointegration in an n × 1 vector of time series yt then can be constructed by using the sum of the (n − r) smallest eigenvalues of

. With a bandwidth growth rate that provides a consistent long-run covariance matrix estimator, both theoretical and small-sample properties of the test have already been considered in several studies, including Shintani (2001) and Harris and Poskitt (2004). For example, in the case of the demeaned test for no cointegration (r = 0), the statistic under the null weakly converges to a random variable

where

is n-vector standard Brownian motion. Limiting distribution of the test statistic based on the inconsistent long-run covariance matrix estimator can also be obtained as a multivariate generalization of Theorem 1. Again, for the demeaned test, random variables in the limit are

and

respectively, for CI and II, where

. In this section, we investigate how the findings for the univariate case obtained in the previous sections can be generalized to the multivariate case. In particular, we are interested in the effect of introducing the inconsistent estimator on the determination of the cointegrating rank in finite samples.
We follow Harris and Poskitt (2004) in simulation design and generate five-dimensional vector series yt = (y1t,y2t,y3t,y4t,y5t)′ from a vector autoregressive (VAR) model,

where A(L) = diag[1 − αL,1 − αL,1 − αL,1 − L,1 − L] with |α| ≤ 1 and εt = (ε1t,ε2t,ε3t,ε4t,ε5t)′ is an i.i.d. multivariate normal random variable. An equicorrelation matrix with correlation coefficient 0.8 is used as a variance covariance matrix of εt, and a vector of 0's is used as an initial value y0. Because all the test statistics we consider here are invariant to any transformation of the form Byt where B is any 5 × 5 nonsingular matrix, the simulation results based on (10) cover a fairly general case of cointegration, including a linear transformation considered by Harris and Poskitt (2004). However, in general, the bandwidth selected by the automatic procedure is not invariant to a linear transformation. For this reason, we employ here a fixed rule for selecting bandwidth in long-run covariance matrix estimation. In particular, we follow Schwert (1989) and use K = [4(T/100)1/3] where [x] is an integer part of x. The sample size T varies from 25 to 500 as in the univariate case. The cointegrating rank is determined by successively testing from the hypothesis of r = 0 to the hypothesis of r = 4 in case each hypothesis is not rejected. The asymptotic critical values for the multivariate version of the demeaned tests based on C0, CC, CI, II, and BR are obtained by approximating the limiting distribution using a multivariate normal random variable with 1,000 steps and 105 iterations.
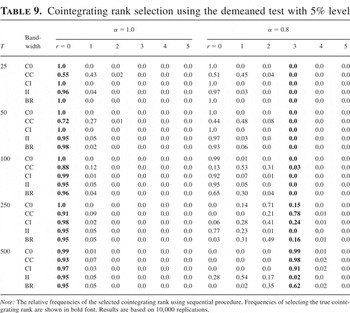
Table 9 reports the relative frequencies of selected cointegrating ranks by sequentially applying the asymptotic 5% level tests in 10,000 replications. The left side of the table shows the result with α = 1, the case of no cointegration (r = 0). The right side of the table shows the result with α = 0.8, the case when the cointegrating rank is three (r = 3). The asymptotic theory predicts that the probability of selecting the true cointegrating rank converges to 95% whereas the probability of selecting the smaller rank converges to zero.
Cointegrating rank selection using the demeaned test with 5% level

When α = 1, all the tests, except the one based on CC, select the true cointegrating rank (r = 0) with a very high frequency for all the sample sizes under consideration. Among all the tests, the one based on II stands out as the frequency of selecting rank zero is closest to the theoretical value 95%, even if the sample size is as small as T = 25 or 50. The BR test shows the second-best finite-sample performance. The test based on CC often selects r = 1 for the sample sizes of T = 25 and 50, but the frequency of selecting r = 0 dramatically increases for a larger sample size. The notable difference in the finite-sample performance reveals the fact that the good size property of the test based on an inconsistent estimator (II) and size distortion in the test based on a consistent estimator (CC) observed in the univariate case are also present in the five-dimensional case.
When α = 0.8, no test selects the true cointegrating rank (r = 3) when the sample size is less than T = 100. The frequencies of selecting r = 3 increase as the sample size increases. In particular, the tests based on C0, CC, and CI perform reasonably well when the sample size becomes as large as T = 500. Among these three tests, the one based on CC dominates the other two and selects the true rank more than three times as often as other tests when T = 250. In contrast, the test based on II underestimates r for almost all the cases. This poor performance of the test based on II can be explained by its low power to reject the null when the value of r in the hypothesis is smaller than its true value, which occurs in the early stage of the sequential cointegrating rank selection procedure. The BR test performs better than the II case but is dominated by other tests.
From this additional experiment on cointegration, we find that the better finite-sample property associated with lower finite-sample power in the unit root test using an inconsistent long-run variance estimator can be well generalized to the multivariate case.
6. CONCLUSION
In this paper, we investigated the properties of the long-run variance ratio tests for a unit root, a generalization of a test based on the VN ratio. Our main interest was in evaluating the effect of introducing inconsistent long-run variance estimation on the size and power of the test for a unit root.
Based on the results of the Monte Carlo simulation designed to evaluate the finite-sample property, the unit root tests with an inconsistent long-run variance estimator were found to have much less size distortion compared to the tests with a conventional consistent long-run variance estimator. This finite-sample size improvement, however, came at the cost of a loss in power. The finite-sample power, in addition to the local asymptotic power, of the tests with an inconsistent long-run variance estimator was shown to be much lower than in tests with a consistent estimator. A further simulation experiment was conducted by sequentially applying a multivariate version of the long-run variance ratio test to determine the cointegrating rank. When an inconsistent long-run variance estimator was used, the frequency of selecting the true cointegrating rank was found to be dramatically lower than in the conventional test, reflecting the low power to reject the null hypothesis with a value that was less than the true cointegrating rank.
These findings resemble the case of the autocorrelation robust test in the standard regression context, where the test with a better size property, proposed by Kiefer et al. (2000), has a lower power compared to the test based on the conventional HAC asymptotics. However, in the context of the long-run variance ratio test for a unit root, our simulation result showed that a test that combines consistent and inconsistent estimators improves the power while maintaining the good size property of the test based only on inconsistent estimators. Alternatively, although not pursued in this paper, (i) the introduction of generalized least squares detrending (Elliott, Rothenberg, and Stock, 1996), (ii) the use of an AR spectral density estimator instead of a kernel-based estimator (Berk, 1974; Perron and Ng, 1996), and (iii) the investigation of the role of higher order terms using an asymptotic expansion (Jansson, 2004) seem to comprise a promising direction in which to extend the analysis of the effect of introducing an inconsistent long-run variance estimator on the size and power of the long-run variance ratio test.
APPENDIX: Proofs
Proof of Lemma 1. By using a similar argument as in the derivation of equation (1) of Kiefer and Vogelsang (2002), we have

where 1A is an indicator function that takes one when A is true and zero otherwise. █
Proof of Theorem 1. In the proof, the limits on integrals over the unit interval are omitted. For example,

is written as ∫W2. For the proof of part (a), we first investigate the asymptotic properties of the numerator of the long-run variance ratio. Under Assumption 1, we have

. For the case of the inconsistent rate K = T, applying Lemma 1 to

yields
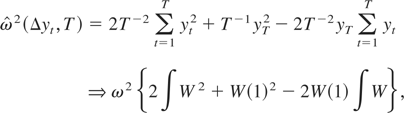
where the joint weak convergence results

follow from Lemma 2.1 of Park and Phillips (1988). For the asymptotic properties of the denominator, first note that

. For

with M/T → 0, we have

where the second equality follows from
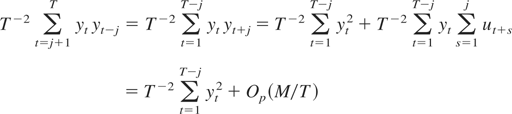
for any j = 1,…,M − 1 because

for any j = 1,…,M − 1. Finally, for

, applying Lemma 1 to

yields
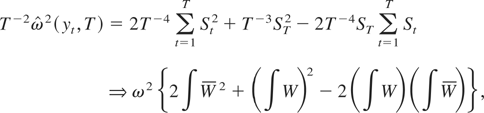
where the joint weak convergence results for the I(2) process

are from Lemma 2.1 of Park and Phillips (1989) and

. The required results for part (a) can be obtained by combining the appropriate results under C0, CC, CI, and II, because the convergence of the numerator and the denominator holds jointly and the nuisance parameter ω2 cancels out for any combination.
For the proof of part (b), let us first note that the numerator of the demeaned test statistic Rμ is identical to that of the standard test statistic R and thus its asymptotic property is already provided in the proof of part (a). For the denominator of Rμ with M = T, the formula in Lemma 1 simplifies to

because ST = 0 for the demeaned series xt = yt − y. The rest of the proof is similar to part (a) with the standard Brownian motion replaced by the demeaned Brownian motion. The proof of (c) is entirely analogous to that of parts (a) and (b) except for the use of the demeaned Brownian bridge. █
Proof of Theorem 2. We show only the consistency of the R test because the results for Rμ and Rτ can be obtained using a similar argument. Let us write

and maintain the assumption on the initial value y0 = 0. Then, under the fixed alternative, the limiting behavior of the numerator for the overdifferenced series when K/T → 0 is given by

where

. For the inconsistent rate with K = T, (A.1) in the proof of Theorem 1 can be also used to obtain

For the denominator, because yt is stationary, we have

. Finally, for the inconsistent rate with M = T, applying Lemma 1 to xt = yt yields
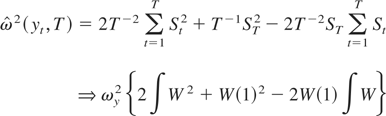
because

is an I(1) process. Combining the all the results yields

Therefore, all the test statistics diverge in the positive direction as required. █
References
REFERENCES
Andrews, D.W.K.
(1991)
Heteroskedasticity and autocorrelation consistent covariance matrix
estimation.
Econometrica
59,
817–858.CrossRefGoogle Scholar
Berk, K.N.
(1974)
Consistent autoregressive spectral estimates.
Annals of Statistics
2,
489–502.CrossRefGoogle Scholar
Bhargava, A.
(1986)
On the theory of testing for unit roots in observed time
series.
Review of Economic Studies
53,
369–384.CrossRefGoogle Scholar
Breitung, J.
(2002)
Nonparametric tests for unit roots and cointegration.
Journal of Econometrics
108,
343–363.CrossRefGoogle Scholar
Elliott, G.,
T. Rothenberg, &
J.H. Stock
(1996)
Efficient tests for an autoregressive unit root.
Econometrica
64,
813–836.CrossRefGoogle Scholar
Harris, D. &
D.S. Poskitt
(2004)
Determination of cointegrating rank in partially non-stationary
processes via a generalised von-Neumann criterion.
Econometrics Journal
7,
191–217.CrossRefGoogle Scholar
Jansson, M.
(2004)
The error in rejection probability of simple autocorrelation robust
tests.
Econometrica
72,
937–946.CrossRefGoogle Scholar
Kiefer, N.M. &
T.J. Vogelsang
(2002)
Heteroskedasticity-autocorrelation robust standard errors using the
Bartlett kernel without truncation.
Econometrica
70,
2093–2095.CrossRefGoogle Scholar
Kiefer, N.M.,
T.J. Vogelsang, &
H. Bunzel
(2000)
Simple robust testing of regression hypotheses.
Econometrica
68,
695–714.CrossRefGoogle Scholar
Müller, U.K.
(2005)
Size and power of tests of stationarity in highly autocorrelated
time series.
Journal of Econometrics
128,
195–213.CrossRefGoogle Scholar
Nabeya, S. &
K. Tanaka
(1990)
Limiting power of unit-root tests in time-series regression.
Journal of Econometrics
46,
247–271.CrossRefGoogle Scholar
Newey, W.K. &
K.D. West
(1987)
A simple, positive semi-definite, heteroskedasticity and
autocorrelation consistent covariance matrix.
Econometrica
55,
703–708.CrossRefGoogle Scholar
Park, J.Y. &
P.C.B. Phillips
(1988)
Statistical inference in regressions with integrated processes: Part
1.
Econometric Theory
4,
468–497.CrossRefGoogle Scholar
Park, J.Y. &
P.C.B. Phillips
(1989)
Statistical inference in regressions with integrated processes: Part
2.
Econometric Theory
5,
95–131.CrossRefGoogle Scholar
Perron, P. &
S. Ng
(1996)
Useful modifications to unit root tests with dependent errors and
their local asymptotic properties.
Review of Economic Studies
63,
435–464.CrossRefGoogle Scholar
Phillips, P.C.B.
(1987)
Time series regression with a unit root.
Econometrica
55,
277–301.CrossRefGoogle Scholar
Phillips, P.C.B. &
S. Ouliaris
(1990)
Asymptotic properties of residual based tests for
cointegration.
Econometrica
58,
165–193.CrossRefGoogle Scholar
Phillips, P.C.B. &
P. Perron
(1988)
Testing for a unit root in time series regression.
Biometrika
75,
335–346.CrossRefGoogle Scholar
Phillips, P.C.B. &
Z. Xiao
(1998)
A primer on unit root testing.
Journal of Economic Surveys
12,
423–469.CrossRefGoogle Scholar
Sargan, J.D. &
A. Bhargava
(1983)
Testing residuals from least squares regression for being generated
by the Gaussian random walk.
Econometrica
51,
153–174.CrossRefGoogle Scholar
Schmidt, P. &
P.C.B. Phillips
(1992)
LM tests for a unit root in the presence of deterministic
trends.
Oxford Bulletin of Economics and Statistics
54,
257–287.CrossRefGoogle Scholar
Schwert, G.W.
(1989)
Tests for unit roots: A Monte Carlo investigation.
Journal of Business & Economic Statistics
7,
147–159.Google Scholar
Shintani, M.
(2001)
A simple cointergrating rank test without vector
autoregression.
Journal of Econometrics
105,
337–362.CrossRefGoogle Scholar
Stock, J.H.
(1994)
Unit roots, structural breaks and trends. In
R.F. Engle &
D. McFadden (eds.),
Handbook of Econometrics,
vol. 4, pp.
2740–2841.
North-Holland.
Stock, J.H.
(1999)
A class of tests for integration and cointegration. In
R.F. Engle &
H. White (eds.),
Cointegration, Causality and Forecasting: A Festschrift for Clive
W.J. Granger, pp.
135–167.
Oxford University Press.
Bandwidth and the long-run variance estimator
Critical values
Empirical size of the standard test with 5% level
Empirical size of the demeaned test with 5% level
Empirical size of the detrended test with 5% level
Asymptotic power functions: standard test.
Asymptotic power functions: demeaned test.
Asymptotic power functions: detrended test.
Size-adjusted power of the standard test with 5% level
Size-adjusted power of the demeaned test with 5% level
Size-adjusted power of the detrended test with 5% level
Size-adjusted power: demeaned test (T = 100).
Cointegrating rank selection using the demeaned test with 5% level
 You have
Access
- 9
- Cited by