

INTRODUCTION
By forming and controlling the length and thickness of myelin wrappings around the axons, oligodendrocytes play a fundamental role in regulating transmission and integration of information among brain regions. During progression through the oligodendroglial lineage, precursor oligodendrocytes lose migratory and proliferative capacities and change morphology by developing highly branched processes directed to other oligodendrocytes and to the neighboring neurons and astrocytes (Mehler, Reference Mehler2002). Moreover, they start expressing specific myelination (MYE) genes such as: myelin basic protein (Mbp), proteolipid protein (Plp), myelin-associated glycoprotein (Mag), cyclic nucleotide phospho-diesterase (Cnp), myelin oligodendrocyte glycoprotein (Mog) and oligodendrocytic myelin paranodal and inner-loop protein (Opalin) (Zhang et al., Reference Zhang, Taveggia, Melendez-Vasquez, Einheber, Raine and Salzer2006; Kippert et al., Reference Kippert, Trajkovic, Fitzner, Opitz and Simons2008; Scherer and Wrabetz, Reference Scherer and Wrabetz2008).
Multiple reciprocal signaling systems likely operate to coordinate axonal electrical impulses with migration, maturation and myelin formation by oligodendrocytes (Trapp and Kidd, Reference Trapp, Kidd and Lazzarini2004; Ishibashi et al., Reference Ishibashi, Dakin, Stevens, Lee, Kozlov, Stewart and Fields2006; Fields, Reference Fields2008), in which astrocytes play critical modulating roles. Neuron- and astrocyte-derived signaling molecules regulate the distribution of axon-attached oligodendroglial processes to fill the unoccupied space and facilitate the formation of mature myelin (Stevens et al., Reference Stevens, Porta, Haak, Gallo and Fields2002; Fields, Reference Fields2004; Simons and Trotter, Reference Simons and Trotter2007). Signaling pathways include various morphogenetic proteins (See and Grinspan, Reference See and Grinspan2009), cytokines (Cxcl1: Omari et al., Reference Omari, Lutz, Santambrogio, Lira and Raine2009; Il10: Yang et al., Reference Yang, Jiang, Fitzgerald, Ma, Yu, Li, Zhao, Li, Ciric, Curtis, Rostami and Zhang2009; Il7: Das Sarma et al., Reference Das Sarma, Ciric, Marek, Sadhukhan, Caruso and Shafagh2009, Lif: Ishibashi et al., Reference Ishibashi, Lee, Baba and Fields2009), growth factors (Bdnf: Linker et al., Reference Linker, Gold and Luhder2009; Pdgf: Finzsch et al., Reference Finzsch, Stolt, Lommes and Wegner2008), histone deacetylases (He et al., Reference He, Sandoval and Casaccia-Bonnefil2007), Mapk/Akt (Marta et al., Reference Marta, Montano, Taylor, Taylor, Bansal and Pfeiffer2005), transcription factors (Olig1: Chen et al., Reference Chen, Wu, Wang, Koito, Li and Ye2009; Sox9, Sox10: Finzsch et al., Reference Finzsch, Stolt, Lommes and Wegner2008; ZONAB, Yy1: He and Casaccia-Bonnefil, Reference He and Casaccia-Bonnefil2008), purinergic receptors (Fields and Burnstock, Reference Fields and Burnstock2006) and oligodendrocyte differentiation inhibitors Id2/4 (Marin-Husstege et al., Reference Marin-Husstege, He, Li, Kondo, Sablitzky and Casaccia-Bonnefil2006; Chen et al., Reference Chen, Wu, Wang, Koito, Li and Ye2009). Since many of the signaling systems mediate their actions via cytosolic [Ca2+] transients, the altered expression of (intercellular) Ca2+-signaling (ICS) genes is central to demyelinating diseases (Butt, Reference Butt2006). Alteration of the otherwise carefully orchestrated balance of myelin synthesis and turnover results in demyelination as in local CNS injury (Reeves et al., Reference Reeves, Phillips and Povlishock2005), multiple sclerosis (MS) and experimental autoimmune encephalomyelitis (EAE), the rodent model of human MS (e.g. Lock et al., Reference Lock, Hermans, Pedotti, Brendolan, Schadt and Garren2002; Brand-Schieber et al., Reference Brand-Schieber, Werner, Iacobas, Iacobas, Beelitz and Lowery2005).
In addition to ATP and adenosine (Stevens et al., Reference Stevens, Porta, Haak, Gallo and Fields2002) that elicit transient increase of cytosolic [Ca2+], cytokines such as Tnfa, Ilb, Tgfb, Ccl2, Ccl5c Cxcl10 (Biancotti et al., Reference Biancotti, Kumar and de Vellis2008), Il4, Il5, Il9, Il10, Il11, Il12, Il23, Ifna/b (Nair et al., Reference Nair, Frederick and Miller2008) and Lif (Ishibashi et al., Reference Ishibashi, Lee, Baba and Fields2009) have been proposed as important tools for timing oligodendrocyte development and function. Astrocyte-released neurotransmitters can induce increase of [Ca2+] in oligodendrocytes through the activation of ionotropic (P2X) and metabotropic (P2Y) purinergic receptors (Butt, Reference Butt2006). Ca2+ is an important second messenger that triggers, modulates and regulates almost all cellular processes, including growth factors and cytokine signaling in oligodendroglial differentiation (Fields and Burnstock, Reference Fields and Burnstock2006).
Gap junction channels are formed by docking two hemichannels composed of six gap junction protein units, the connexins (Cx), contributed by each cell (Spray, Reference Spray2005). There is evidence that oligodendrocytes form functional GJCs among themselves (Cx32/Cx32 and Cx47/Cx47) and with astrocytes (Cx32/Cx30 and Cx47/Cx43) but not with neurons. Connexin expression is likely of critical importance because not only loss of the oligodendrocyte connexins Cx32 and Cx47 (Orthmann-Murphy et al., Reference Orthmann-Murphy, Abrams and Scherer2008) but also of the astrocyte connexins Cx43 and Cx30 results in severe demyelination (Lutz et al., Reference Lutz, Zhao, Gulinello, Lee, Raine and Brosnan2009).
Gene expression during normal development and differentiation of myelinating cells has been widely analyzed (e.g. Gokhan et al., Reference Gokhan, Marin-Husstege, Yung, Fontanez, Casaccia-Bonnefil and Mehler2005; Cahoy et al., Reference Cahoy, Emery, Kaushal, Foo, Zamanian and Christopherson2008; Lauriat et al., Reference Lauriat, Shiue, Haroutunian, Verbitsky, Ares and Ospina2008; White et al., Reference White, Gonsior, Krämer-Albers, Stöhr, Hüttelmaier and Trotter2008). Numerous other studies have described changes induced in the MYE substrate by spinal cord injury (Carmel et al., Reference Carmel, Galante, Soteropoulos, Tolias, Recce and Young2001; Di Giovanni et al., Reference Di Giovanni, Knoblach, Brandoli, Aden, Hoffman and Faden2003), MS (e.g. Arthur et al., Reference Arthur, Armati, Bye, Heard and Stewart2008), EAE (e.g. Iacobas et al., Reference Iacobas, Iacobas, Werner, Scemes and Spray2007a), and a variety of CNS pathologies (e.g. Kumar et al., Reference Kumar, Mattan and de Vellis2006; Haroutunian et al., Reference Haroutunian, Katsel, Dracheva, Stewart and Davis2007; Rowe et al., Reference Rowe, Blalock, Chen, Kadish, Wang and Barrett2007; Desai et al., Reference Desai, Sudol, Janelsins, Mastrangelo, Frazer and Bowers2009). Regulation of MYE genes was reported also in psychiatric disorders such as schizophrenia, chronic depression, bipolar disorder, obsessive–compulsive disorder and post-traumatic stress disorder (Hakak et al., Reference Hakak, Walker, Li, Wong, Davis and Buxbaum2001; McCullumsmith et al., Reference McCullumsmith, Gupta, Beneyto, Kreger, Haroutunian and Davis2007; Lee and Fields, Reference Lee and Fields2009). These studies have had a large impact in delineating essential genomic alterations induced by or predisposing to the disease and in describing transcriptomic differences between various CNS and PNS regions. Although multiple signaling pathways have been implicated in regulating oligodendrocyte differentiation and activity, the integration of these pathways with transcriptional regulatory networks is not yet fully understood.
OBJECTIVE
To determine the role of neighboring astrocytes in modulating the topology of MYE gene fabric in oligodendrocytes through intercellular Ca2+ signaling (ICS) and cytokine receptor (CYR) signaling pathways when the formation of astrocyte–oligodendrocyte gap junction channels is prevented. CYR pathway was studied to determine the transcriptomic effects of the cytokines released by astrocytes (e.g. Fields and Burnstock, Reference Fields and Burnstock2006; Maysami et al., Reference Maysami, Nguyen, Zobel, Pitz, Heine and Höpfner2006). The transcriptomic effects of astrocyte proximity (CAO condition) were compared with those induced by a 10-day differentiating treatment with dibutyryl-cAMP that transforms immortalized oligodendrocyte precursor cells (Oli-neu, CTR condition) into myelin-associated glycoprotein-positive oligodendrocyte-like cells (DIF condition).
MATERIALS AND METHODS
Preparation of Oli-neu cells
The mouse oligodendrocyte precursor cell line Oli-neu was a gift from Dr. J. Trotter (University of Mainz, Germany). This cell line was generated by retroviral transduction of oligodendrocyte precursors with the t-neu oncogene (Jung et al., Reference Jung, Krämer, Grzenkowski, Tang, Blakemore and Aguzz1995). Cells were grown on poly-l-lysine-coated culture dishes maintained at 37°C in 5% CO2 in a humidified incubator. Immature Oli-neu cells were seeded in culture flasks coated with 0.01% poly-l-lysine, cultured in DMEM medium + 1% B27, N2, PSG, SP and horse serum (GIBCO®), and passaged following dissociation with Trypsin-EDTA.
Preparation of primary astrocyte cultures
At E19 stage of pregnancy, caesarean sections were performed on a C57Bl/6j mouse mother and brains from four pups were separately minced in 500 µl of 0.05% trypsin-EDTA, transferred to 1 ml Eppendorf tubes containing 500 µl Dulbecco's Modified Eagle medium supplemented with 10% fetal bovine serum and 1% penicillin–streptomycin and spun down at 2000 rpm for 10 min. Animals were housed in the Einstein Animal Facility and procedures were performed with IACUC approval. Pellets were then resuspended in culture medium and the cells were plated in 100 mm culture dishes and maintained in a humidified 5% CO2 incubator at 37°C. After 2 weeks in culture, primary confluent cell cultures were trypsinized (0.05% trypsin) and replated. About 90% of the cells were immunopositive for glial acidic fibrillary protein (GFAP; Iacobas et al., Reference Iacobas, Iacobas, Urban-Maldonado, Scemes and Spray2008).
Cell treatment
Differentiation of Oli-neu cells into Mag-positive oligodendrocytes was induced by switching the cells for 10 days to a medium containing 1 mM dibutyryl-cAMP (Sigma, St. Louis, MO) following the protocol described in Gokhan et al. (Reference Gokhan, Marin-Husstege, Yung, Fontanez, Casaccia-Bonnefil and Mehler2005). Control Oli-neu cells were also cocultured with mouse cortical astrocytes in FalconTM cell culture 6 well-insert system, with astrocytes in the insert and Oli-neu cells at the bottom of the system. The insert had pores of 0.4 µm allowing the two types of cells to exchange neurotransmitters and other signaling molecules; contact and formation of gap junction channels between the cell types was precluded by small size of the filter pores and location of Oli-neu cells at the bottom of the chamber (about 2 mm below the filter insert).
Microarray protocol
In total, 20 µg RNA extracted from each of the four dishes of control (CTR), differentiated (DIF) or co-cultured with astrocytes (COA) Oli-neu cells was reverse transcribed into cDNA incorporating fluorescent Alexa Fluor®_647 or Alexa Fluor®_555-aha-dUTPs (Invitrogen, CA). Differently labeled cDNAs of biological replicas were co-hybridized (‘multiple yellow’ design) overnight at 50°C on aminosilane-coated Corning glass slides spotted with 30 K (https://www.ncbi.nlm.nih.gov/geo/query/acc.cgi?acc=GPL8938, CTR and DIF samples) or 36 K (https://www.ncbi.nlm.nih.gov/geo/query/acc.cgi?acc=GPL8928, COA samples) mouse oligonucleotide sequences (70-mer Operon mouse 3.0 or 4.0 series) printed by the Microarray Core Facility of Duke University. After washing (0.1% SDS and 1% SSC) to remove the non-hybridized cDNAs, each array was scanned at 750 V (635 nm) and 670 V (532 nm) with GenePix 4100A scanner (Axon Instruments, CA) and images analyzed with GenePixPro 6.0 (Axon Instruments, CA). A gene was considered as expressed only if the foreground fluorescence signal of the probing spot in the array exceeded the background fluorescence by more than 100%. Data were normalized by an iterative method alternating intra- and inter-array normalization until the average absolute expression ratios did not change by more than 5% in subsequent steps as previously described (Iacobas et al., Reference Iacobas, Iacobas, Urban-Maldonado and Spray2005).
Detection of differentially expressed genes
Detection of differentially expressed genes between any two conditions relied on both absolute >1.5-fold-change and P < 0.05 of the heteroscedastic t-test applied to the means of the background subtracted normalized fluorescence values in the four biological replicas of the compared transcriptomes. The P-values (two-samples and unequal variance) were computed with Bonferroni-type corrections applied to each redundancy group (=set of spots probing the same gene, Iacobas et al., Reference Iacobas, Iacobas, Urban-Maldonado and Spray2005). In addition to the significantly up-/down-regulated genes, we have identified also the connexin, MYE, ICS and CYR genes whose expression was switched on or off in CAO and DIF samples with respect to CTR.
Analysis of expression variability and transcription control
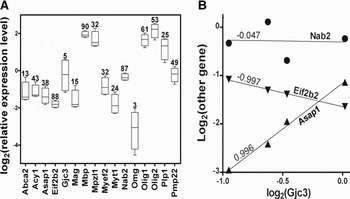
Although similar, local conditions are not identical within biological replicas, giving rise to variability of gene expression levels, or ‘genomic noise’ (Raser and O'Shea, Reference Raser and O'Shea2005). Expression variability is not uniform among the genes, reflecting differences in the control strength of the transcript abundance (examples in Fig. 1A). We view this ‘noise’ as a fine transcriptomic tuning, with tight control indicating key genes for cell survival, phenotype preservation and integration in multicellular structures, and wide variability of others favoring environmental adaptation. We determined the Gene Expression Stability (GES; Iacobas et al., Reference Iacobas, Urban, Iacobas, Scemes and Spray2003) with GES = 100 indicating the most highly controlled gene (reflecting the least expression variability) and GES = 1 the least controlled one (exhibiting the largest expression variability).
Expression variability and coordination of MYE genes. (A) Expression variability of some myelination genes. Genes: Abca2 = ATP-binding cassette, sub-family A (ABC1), member 2; Acy1 = aminoacylase 1; Asap1 = ArfGAP with SH# domain, ankyrin repeat and PH domain1; Eif2b2 = eukaryotic translation initiation factor 2B, subunit 2 beta; Gjc2 = gap junction membrane channel protein gamma3 (Cx29); Mpzl1 = myelin protein zero-like 1; Myef2 = myelin basic protein expression factor 2, repressor; Myt1 = myelin transcription factor 1; Nab2 = Ngfi-A binding protein 2; Olig1/2 = oligodendrocyte transcription factor 1/2; Omg = oligodendrocyte myelin glycoprotein; Plp1 = proteolipid protein (myelin) 1; Pmp22 = peripheral myelin protein. The rectangles are the 95% confidence intervals of the logarithmic expression level, while numbers above are the GES scores. Note the non-uniform variability among the genes. (B) Examples of synergistically (Asap1), antagonistically (Eif2b2) or independently (Nab2) expressed with Gjc3 (encoding the gap junction protein connexin29).

Analysis of expression coordination and connectivity
Transcription variability allows calculation of Pearson correlation coefficients between sets of expression levels of gene pairs in biological replicas and identification of synergistically, antagonistically and independently expressed partners (examples in Fig. 1B). In the case of four biological replicas, the P < 0.05 cut-offs are ρ > 0.90 for synergism, ρ < −0.90 for antagonism and |ρ| < 0.05 for independence. In previous studies, we have found that the expression of each gene is tied to that of numerous other genes of the same functional pathway, therefore satisfying a kind of ‘transcriptomic stoichiometry’ of the biological processes (Iacobas et al., Reference Iacobas, Iacobas and Spray2007c).
For each MYE as well as each connexin, ICS and CYR gene i, we have identified all synergistically, antagonistically and independently expressed MYE partners within MYE gene fabric composed of {w} unigenes expressed in the sample type β (=CTR, DIF, COA).
Analysis of gene prominence
The prominent gene analysis (PGA; Iacobas et al., Reference Iacobas, Iacobas and Haddad2010a, Reference Iacobas, Iacobas, Thomas and Sprayb) was developed as an alternative to the principal component analysis (PCA; Wu and Lin, Reference Wu and Lin2009) to refine the functional gene webs. Both PCA and PGA transform the massive expression data set through an orthogonal linear transformation into an alternative data set of smaller size associated with the most ‘informative’ genes. PGA differs from PCA by considering as ‘centroids’ the most connected and stably expressed instead of the most alterable gen. When applied to a functional gene fabric, PGA selects the genes whose expression is the most influential on those of the other fabric genes, while being the least affected by the variability of the local conditions Therefore, Bonferroni-type corrected, α-significant chi-square estimate of the gene (i) prominence GPSi;W(β) within web w in sample type β (=CTR, DIF, COA) was defined as the percentile locating the score:

where R i is the number of spots probing redundantly gene i, VAR(x i) is the variance of its expression level within biological replicas and COVAR(x i, x j) is the covariance with the expression level of gene j. GP takes values from 0 to 100, with GP = 0 indicating the most prominent and GP = 100 the least prominent gene. In this report α = 0.05.
RESULTS
Data complying with the ‘Minimum Information About Microarray Experiments’ were deposited in the National Center for Biotechnology Information Gene Expression Omnibus database (http://www.ncbi.nlm.nih.gov/geo) as GSE18726. The 13121 unigenes quantified in this experiment were assigned to various gene ontology categories by the software SOURCE (http://smd.stanford.edu/cgi-bin/source/sourceSearch). The assignment to MYE, ICS and CYR cohorts was further refined by using our Gene Prominence Analysis. Finally, 114 genes were considered for MYE cohort, 77 to ICS and 71 to CYR, out of which 94 MYE, 32 ICS and 31 CYR genes were quantified in all samples and conditions. Remarkably, genes such are: Adam10 and Adam17 (Kieseier et al., Reference Kieseier, Pischel, Neuen-Jacob, Tourtellotte and Hartung2003), Adam19 (Chesneau et al., Reference Chesneau, Becherer, Zheng, Erdjument-Bromage, Tempst and Blobel2003), Cxcl1 (Omari et al., Reference Omari, Lutz, Santambrogio, Lira and Raine2009), Ezh2 (Sher et al., Reference Sher, Rössler, Brouwer, Balasubramaniyan, Boddeke and Copray2008), Gjc2 (encoding Cx47; Parenti et al., Reference Parenti, Cicirata, Zappalà, Catania, La Delia and Cicirata2010), Id4 (Marin-Husstege et al., Reference Marin-Husstege, He, Li, Kondo, Sablitzky and Casaccia-Bonnefil2006), Lifr, Notch1 (Seifert et al., Reference Seifert, Bauer, Weissert, Fazekas and Storch2007; Brosnan and John, Reference Brosnan and John2009a, Reference Brosnan and Johnb; Zhang et al., Reference Zhang, Argaw, Gurfein, Zameer, Snyder and Ge2009), Opalin (Kippert et al., Reference Kippert, Trajkovic, Fitzner, Opitz and Simons2008) and Yy1 (He and Casaccia-Bonnefil, Reference He and Casaccia-Bonnefil2008), not identified by SOURCE as related to MYE were selected by PGA. The relevance of the added genes for MYE not only is in agreement with results of other authors but constitutes also a proof of the capabilities of the PGA method to refine the functional pathways.
Switched on/off genes
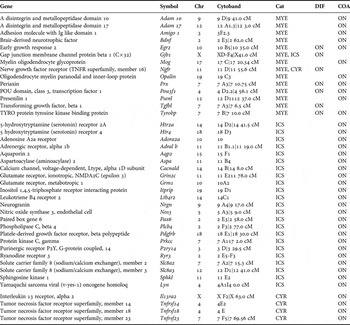
Table 1 presents the MYE, ICS and CYR genes that were switched on/off by the differentiating treatment or/and astrocyte proximity. Progression of the Oli-neu cell toward mature oligodendrocyte-like cells was indicated by switching on the marker gene Mog in both DIF and COA and Opalin in COA. Of note is the ‘explosion’ of MYE, ICS and tumor necrosis factor genes activated by the proximity of astrocytes. Interstingly, genes activated in DIF included the Gjb1 gene encoding Cx32, one of the connexins critical for normal MYE in CNS (Mennichella et al., Reference Menichella, Goodenough, Sirkowski, Scherer and Paul2003).
Myelination (Cat = MYE), Ca2+-signaling (ICS) and cytokine receptor (CYR) genes that were switched ON or OFF by differentiating treatment (DIF) or non-touching astrocyte proximity (COA). Note the ‘explosion’ of ICS and tumor necrosis factor genes in COA.

Expression variability and transcript abundance control of MYE genes
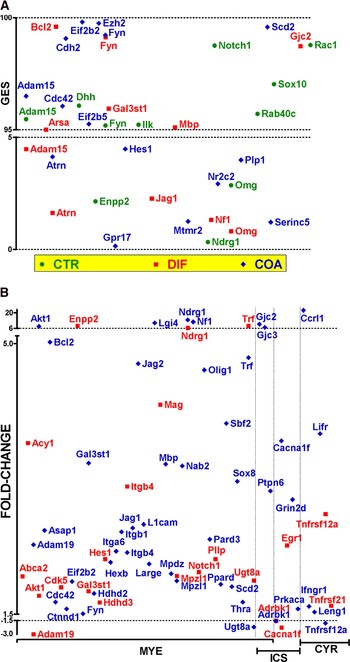
Figure 2A presents the most stably (GES > 95) and the most unstably (GES < 5) expressed MYE genes in all three conditions. While the control strength of some genes was not affected by the treatment or astrocyte proximity (e.g. Fyn = fyn proto-oncogene with GES = 95 in CTR, 99 in DIF and 98 in COA) for others this control was switched between being very strict and very relaxed. For instance, Adam15 (a disintegrin and metallopeptidase domain 15) was very stably expressed in CTR and COA and very unstably expressed in DIF. Among, ICS and CYR genes, Grind2d (glutamate receptor, ionotropic, NMDA2D, epsilon 4) in CTR and Gjc2 and Egr1 (early growth response 1) in DIF were very stably expressed (GES > 95), while P2ry2 (purinergic receptor P2Y, G-protein coupled 2) in CTR and Ifnar1 (interferon alpha and beta receptor 1), Tnfrsf1a (tumor necrosis factor receptor superfamily, member 1a) and P2ry1 (purinergic receptor P2Y, G-protein coupled 1) in COA were very unstably expressed (GES < 5). REV analysis indicated a significant decrease of the overall expression variability in COA with respect to both CTR and DIF, although no significant difference in variability was detected between DIF and CTR cells. Interestingly, the linear regression analysis revealed significant (P < 0.0001) proportionality of the GES score change in DIF and COA with respect to CTR (r 2 = 0.487), suggesting that similar control mechanisms of MYE genes were activated in both DIF and COA conditions.
Expression control and regulation. (A) The most stably and unstably expressed MYE gene. Genes: Arsa = arylsulfatase A; Atrn = attractin; Bcl2 = B-cell leukemia/lymphoma 2; Cdc42 =cell division cycle 42 homolog (S. cerevisiae); Cdh2 = cadherin 2; Dhh = desert hedgehog; Eif2b5 = eukaryotic translation initiation factor 2B, subunit 5 epsilon; Enpp2 = ectonucleotide pyrophosphatase/phosphodiesterase 2; Ezh2 = enhancer of zeste homolog 2 (Drosophila); Gpr17 = G protein-coupled receptor 17; Hes1 = hairy and enhancer of split 1 (Drosophila); Ilk = integrin-linked kinase; Jag1 = jagged 1; Mtmr2 = myotubularin-related protein 2; Ndrg1 = N-myc downstream-regulated gene 1; Nf1 = neurofibromatosis 1; Notch1 = notch gene homolog 1 (Drosophila); Nr2c2 = nuclear receptor subfamily 2, group C, member 2; Rab40c = Rab40c, member RAS oncogene family; Rac1 = RAS-related C3 botulinum substrate 1; Scd2 = stearoyl-coenzyme A desaturase 2; Serinc5 = serine incorporator 5; Sox8/10 = SRY-box containing gene 8/10. The rectangles are the 95% confidence intervals of the logarithmic expression level while numbers above are the GES scores. Note the non-uniform variability among the genes. (B) Significantly up- and down- (negative values) regulated MYE, ICS and CYR genes in DIF and COA with respect to CTR Oli-neu cells. Mye genes: Cdk5 = cyclin-dependent kinase 5; Ctnnd1 = catenin (cadherin associated protein), delta 1; Hdhd2/3 = haloacid dehalogenase-like hydrolase domain containing 2/3; Hexb = hexosaminidase B; Itga6 = integrin alpha 6; Itgb1 = integrin beta 1; Jag2 = jagged 2; L1cam = L1 cell adhesion molecule; Large = like-glycosyltransferase; Lgi4 = leucine-rich repeat LGI family, member 4; Mpdz = multiple PDZ domain protein; Pard3 = Par-3 (partitioning defective 3) homolog (C. elegans); Pllp = plasma membrane proteolipid; Ppard = peroxisome proliferator activator receptor delta; Sbf2 = SET binding factor 2; Thra = thyroid hormone receptor alpha; Ptpn6 = protein tyrosine phosphatase, non-receptor type 6. ICS genes: Prkaca = protein kinase, cAMP-dependent, catalytic, alpha. CYR genes: Ccrl1 = chemokine (C–C motif) receptor-like 1; Ifngr1 = interferon gamma receptor 1; Leng1 = leukocyte receptor cluster (LRC) member 1; Lifr = leukemia inhibitory factor receptor; Tnfrsf21 = tumor necrosis factor receptor superfamily, member 21.

Expression regulation
Figure 2B presents the regulated MYE, ICS and CYR genes in DIF and COA conditions with respect to CTR. Note the up-regulation of the oligodendrocyte maturation indicator genes Cnp and Mag in DIF and of Mbp in COA, and that astrocyte proximity up-regulated larger numbers of genes than differentiating treatment in each category (37 versus 17 in MYE, 6 versus 1 in ICS and 4 versus 2 in CYR). Genes such are: Akt1 (thymoma viral proto-oncogene 1), Gal3st1 (galactose-3-O-sulfotransferase 1), Itgb4 (integrin beta 4), Mpzl1, Ndrg1 and Trf (transferrin) are up-regulated, and Adrbk1 (adrenergic receptor kinase, beta 1) down-regulated in both conditions. However, while Adam19 (a disintegrin and metallopeptidase domain 19 (meltrin beta)) and Cacna1f (Calcium channel, voltage-dependent, alpha 1F subunit) are up-regulated in COA and down-regulated in DIF, Ugt8a (UDP galactosyltransferase 8A) and Tnfrsf12a (tumor necrosis factor receptor superfamily, member 12a) are up-regulated in DIF and down-regulated in COA. Notably, astrocyte proximity up-regulated the connexin genes Gjc2 and Gjc3 (Cx29), respectively, by 9.7× and 6.9×, while the differentiating treatment had no significant effect on the expression of these genes.
Expression coordination of MYE and connexin genes
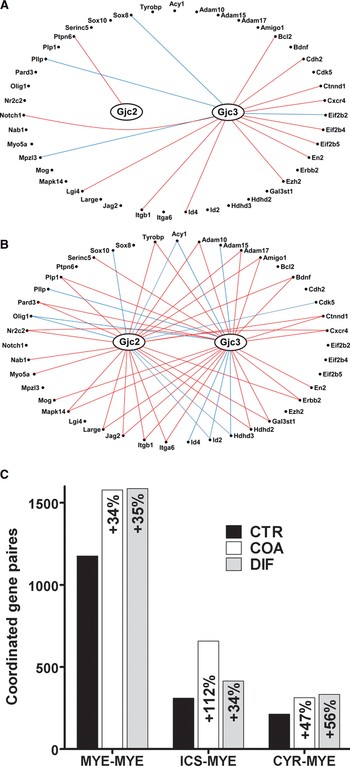
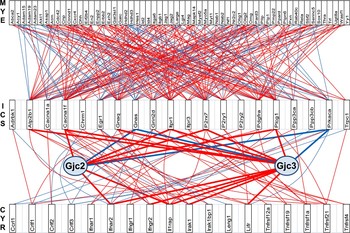
Figure 3 presents the MYE genes directly controlled by the expressed connexins in CTR and COA cells and the numbers of the coordinately expressed MYE genes among themselves and with ICS and CYR genes. The numbers of the synergistically or antagonistically co-expressed MYE gene partners of the two connexins increased from 1 for Gjc2 and 16 for Gjc3 in CTR to 27 for Gjc2 and 29 for Gjc3 in COA. In the case of DIF cells (not shown) the coordinations are: 21 for Gjb1, 20 for Gjc2 and 28 for Gjc3. While both DIF and COA conditions increased similarly the numbers of the coordinated MYE-MYE and CYR-MYE pairs, astrocyte proximity (COA) more than doubled the coordinations between MYE and ICS genes, emphasizing the importance of Ca2+-signaling in the presence of astrocytes. Supplementary Fig. 1 presents the entire coordination network of the 97 MYE genes in CTR and COA cells, indicating that the surprisingly highly networked MYE gene fabric is profoundly remodeled by astrocyte proximity. The MYE genes with the largest percentage of significantly coordinately expressed partners were: Sbf2 (25%) in CTR, Eif2b2 (33%), Asap1 and Olig1 (29%), Itgb1 (28%), Braf (Braf transforming gene) and Myef2 (27%), Cnp, Enpp2, L1cam and Mpdz (25%) in DIF, and Hdhd2 and Serinc5 (27%), Cxcr4 (chemokine (C-X-C motif) receptor 4), Hdhd3 and Itgb1 (25%) in COA.
Change in expression coordination. (A,B) Synergistically (red lines) and antagonistically (blue lines) expressed MYE partners of Cx47 (Gjc2) and Cx29 (Gjc3) in CTR (A) and COA (B) cells. Genes: Adam10/17 = a disintegrin and metallopeptidase domain 10/17; Amigo1 = adhesion molecule with Ig-like domain 1; Bdnf = brain derived neurotrophic factor; Cxcr4 = chemokine (C-X-C motif) receptor 4; Eif2b4 = eukaryotic translation initiation factor 2B, subunit 4 delta; En2 = engrailed 2; Erbb2 = v-erb-b2 erythroblastic leukemia viral oncogene homolog 2, neuro/glioblastoma derived oncogene homolog (avian); Id2/4 = inhibitor of DNA binding 2/4; Mapk14 = mitogen-activated protein kinase 14; Mpzl3 = myelin protein zero-like 3; Myo5a = myosin VA; Nab1 = Ngfi-A binding protein 1; Tyrobp = TYRO protein tyrosine kinase binding protein. (C) Change in the number of coordinately expressed gene pairs induced by differentiating treatment (DIF) and proximity of non-touching astrocytes (COA). Note the substantial increases in all categories and the ‘explosion’ of ICS-MYE coordinations in COA. The percentages refer to 4371 MYE-MYE, 3008 ICS-MYE and 2914 CYR-MYE pairs that can be formed with the quantified genes in each category and all samples.

Regulatory CYR-modulated ICS networks in controlling the MYE gene web
Figure 4 presents part of the regulatory transcriptomic networks by which CYR genes modulate MYE genes through ICS contributors in the Oli-neu cells cultured in the proximity of non-touching astrocytes, while Supplementary Fig. 2 presents the same networks in all three conditions. ICS and CYR genes directly controlled by the expressed connexins are also indicated. Of note is the substantial increase of coordination between CYR and ICS genes (24% in DIF and 16% in COA versus 11% in CTR) and between ICS and MYE genes (21% in DIF and 17% in COA versus 15% in CTR), induced by both differentiating treatment and astrocyte proximity. Together with Supplementary Fig. 2, these findings indicate the remarkable plasticity of the MYE gene fabric and regulatory networks that are remodeled in response to change in environmental conditions.
Part of the regulatory CYR-modulated ICS networks that control the MYE gene web in COA cells. MYE genes: Adam23 = a disintegrin and metallopeptidase domain 23; Galc = galactosylceramidase; Pxn = paxillin; Rela = v-rel reticuloendotheliosis viral oncogene homolog A (avian); Yy1 = YY1 transcription factor. ICS genes: Atp2b1 = ATPase, Ca ++ transporting, plasma membrane 1; Cacna1a = calcium channel, voltage-dependent, P/Q type, alpha 1A subunit; Chrm1 = cholinergic receptor, muscarinic 1; CNS; Gnaq = guanine nucleotide-binding protein, alpha q polypeptide; Gnas = GNAS (guanine nucleotide-binding protein, alpha stimulating) complex locus; Itpr1/3 = inositol 1,4,5-triphosphate receptor 1/3; P2rx7 = purinergic receptor P2X, ligand-gated ion channel 7; Pdgfra = platelet-derived growth factor receptor, alpha polypeptide; Plcg1 = phospholipase C, gamma 1; Ppp3ca/b = protein phosphatase 3, catalytic subunit, alpha/beta isoform; Trpc = transient receptor potential cation channel, subfamily C, member 1. CYR genes: Crlf1/2/3 = cytokine receptor-like factor 1/2/3; Ifnar2 = interferon (alpha and beta) receptor 2; Ifngr2 = interferon gamma receptor 2; Ill1rap = interleukin 1 receptor accessory protein; Irak1 = interleukin-1 receptor-associated kinase 1; Irak1bp1 = interleukin-1 receptor-associated kinase 1 binding protein 1; Tnfrsf19/4 = tumor necrosis factor receptor superfamily, member 19/4.

Lif-activated MYE pathway
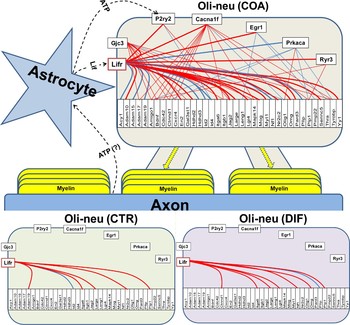
Figure 5 presents the regulatory network by which the receptor of the leukemia inhibitory factor (Lifr) controls MYE genes as revealed from the expression coordination analysis in all three conditions. In COA, the control is exerted either directly (on: Acy1, Adam10/15/19, En2, Hdhd2/3, Id2/4, Itga6, Jag2, Large, Lgi4, Mog, Myt1, Nf1, Nr2c2, Omg, Pard3, Pllp, Serinc5, Yy1) or through the partner genes: Gjc3 (Adam17, Amigo1, Bdnf, Ctnnd1, Cxcr4, Erbb2, Gals3st1, Itgb1, Mapk14, Olig1, Plp1, Tyrobp), Cacna1f (Adam17, Amigo1, Bdnf, Cdc42, Ctnnd1, Cxcr4, Erbb2, Itgb1, Mapk14, Olig1, Plp1, Tyrobp), Egr1 (Leng1, Pmp22, Thra), P2ry2 (Id4, Jag2), Prcaka (Amigo1, Ctnnd1, Olig1, Plp1, Tyrobp) and Ryr3 (Amigo1, Plp1). In the absence of astrocytes, expression of substantially fewer MYE genes (6 in CTR and 8 in DIF versus 22 in COA is directly modulated by Lifr and none through the ICS partners of Lifr that are active in COA.
Regulatory network by which leukemia inhibitory factor receptor (Lifr) controls the MYE substrate either directly (thicker lines) or through its ICS coordination partners (Cacna1f, Egr1, P2y2r, Prkaca) and Gjc3 in Oli-neu cells cultured in the proximity of non-touching astrocytes. Genes: Ryr3 = ryanodine receptor 3.

DIF and COA change the prominence hierarchy of the MYE genes
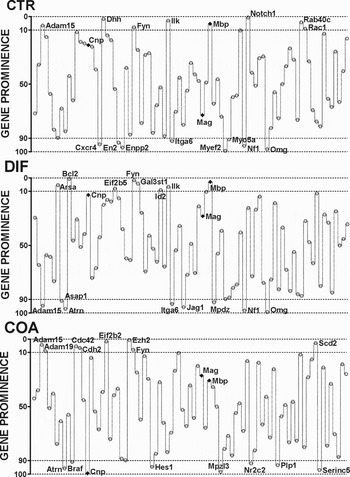
Figure 6 presents the most and the least prominent MYE genes in the three conditions, with Notch1, Bcl2 and Ezh2 in the top positions. We found that the hierarchy of MYE genes was significantly modified in both DIF and COA conditions, indicating profound reconfiguration of the MYE genomic fabric. Interestingly, while Mbp appears as prominent in all three conditions, the prominence of Mag increases significantly in both DIF and COA, and that of Cnp decreases significantly in COA. These findings suggest that Mag should be considered as the main marker gene for the differentiation of the immortalized precursor oligodendrocytes.
The most (GP < 10) and the least (GP > 90) prominent MYE genes in all three conditions. Note the prominences of the marker genes Cnp, Mag and Mbp (diamond).

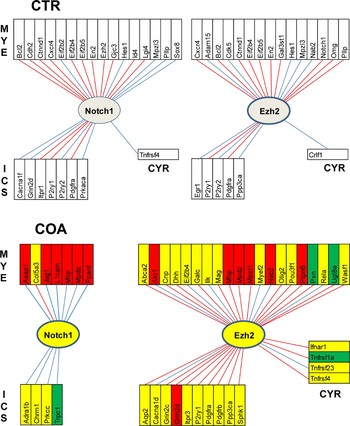
Figure 7 presents the MYE, ICS and CYR genes significantly coordinated with the most prominent genes in CTR (Notch1) and COA (Ezh2) cells. There are substantial increases in the number of coordinated partners in all three gene cohorts for the most prominent MYE gene in COA (20 MYE + 10 ICS + 4 CYR) with respect to those of the most prominent MYE gene in CTR (16 MYE + 7 ICS + 1 CYR). Owing to the totally different partnerships of the illustrated genes, this figure illustrates again the profound remodeling of the gene fabric induced by the astrocyte proximity.
Coordinately expressed partners of the most prominent MYE genes in Oli-neu cells when cultured alone (CTR) and cocultured with non-touching astrocytes (COA). Red/blue lines indicate synergistic/antagonistic co-expression of the linked partner genes. Red/green/yellow background of the gene symbols in COA indicates whether the expression level of that gene was up-/down-/not regulated in COA with respect to CTR. Note that in COA Ezh2 has more coordinated partners in each category than had Notch1 in CTR and that both Notch1 and Ezh2 changed completely their partners in the proximity of astrocytes. Genes: Col5a3 = collagen, type V, alpha 3; Pou3f1 = POU domain, class 3, transcription factor 1; Wasf1 = WASP family 1.

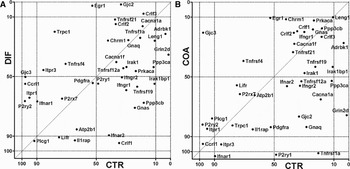
In order to find whether certain ICS and CYR genes may qualify for being included in the MYE gene fabric, we plotted in Fig. 8 the GP scores with respect to the initial set of MYE genes of connexins, CYR and ICS genes in DIF and COA against those in CTR cells. Remarkably, from this perspective Adrbk1 (GP = 3.4) and Grin2d (GP = 1.4) in CTR, and Crlf3 (cytokine receptor-like factor 3; GP = 7.8), Egr1 (2.4) in addition to Gjc2 (1.6) deserve to be included within MYE fabric in DIF. Of note is that, with the exception of Ifnar1, Tnfrsf1a and P2ry1 in COA, all other CYR, ICS and connexin genes were ranked above the least prominent MYE genes in each condition (Myef2 in CTR, Omg in DIF and Cnp in COA.
Prominences of connexins, CYR and ICS genes with respect to MYE gene fabric in DIF and COA conditions plotted against those in CTR. Points close to the diagonal indicate genes that preserved their CTR prominence when the cells were subjected to the differentiating treatment (DIF) or cocultured in the proximity of non-touching astrocytes.

CONCLUSION
• Proximity of astrocytes enhances and remodels the MYE substrate of the neighboring oligodendrocytes even in the absence of astrocyte–oligodendrocyte gap junction channels.
• The high sensitivity of Oli-neu transcriptome to the astrocyte proximity indicates the risks to extrapolate in vivo results from studies on primary cultures of individual cell types.
DISCUSSION
A major finding of this study is that enhancement of MYE substrate by astrocyte proximity is more profound than that induced by 10d differentiating treatment with 1 mM db-cAMP converting Oli-neu cells into myelin-associated glycoprotein-positive oligodendrocytes. In addition to switching on (Table 1) or regulating (Fig. 3) MYE genes and their ICS and CYR partners, astrocyte proximity significantly increases the overall transcription control (Fig. 2B) and interlinkage (Fig. 5) of genes responsible for MYE. Moreover, this astrocyte vicinity changes MYE gene hierarchy (Fig. 8), remodels the transcriptomic networks that control the MYE substrate through Ca2+-signaling modulated by activated CYRs (Fig. 6) and promotes new signaling pathways, including that activated by leukemia inhibitory factor (Fig. 7).
One of many interesting observations is that presenilin 1 was switched on in CAO and presenilin 2 was up-regulated in both DIF (2.79x) and CAO (2.55x). Mutations in these two presenilins are known causes of Alzheimer's disease (Bartzokis, Reference Bartzokis2009; Desai et al., Reference Desai, Sudol, Janelsins, Mastrangelo, Frazer and Bowers2009; Jayadev et al., Reference Jayadev, Leverenz, Steinbar, Stahl, Klunk and Yu2010; Veeraraghavalu et al., Reference Veeraraghavalu, Choi, Zhang and Sisodia2010).
In previous papers, we reported that disrupted expression of Gja1 (encoding Cx43), Gjb1 (Cx32) or Gjd2 (Cx36) regulates large numbers of genes in mouse brain that are located on all chromosomes and encode proteins from all major functional categories (Iacobas et al., Reference Iacobas, Iacobas, Werner, Scemes and Spray2007a). These findings implicate connexin expressions as transcriptomic hubs extending to pathways beyond those that might be expected to depend on junctional communication (Iacobas et al., Reference Iacobas, Iacobas, Urban-Maldonado and Spray2005, Reference Iacobas, Iacobas and Spray2007c). More importantly, transcriptomic alterations in Cx32 and Cx43 null brains were very similar to each other but different with respect to those in Cx36 null brain (Iacobas et al., Reference Iacobas, Iacobas and Spray2007b). Since in brain these three connexins are expressed in different cell types (Cx43 in astrocytes, Cx32 in oligodendrocytes and Cx36 in neurons) and because astrocytes and oligodendrocytes may form syncytia coupled by gap junction channels, these observations suggest transcellular connexin-dependent panglial transcriptomic networks (Spray and Iacobas, Reference Spray and Iacobas2007). Such networks, where linkage partners are rearranged and strengths modified in brains of knockouts, may explain downstream and parallel ‘ripples’ of phenotypic change resulting from single-gene manipulations as illustrated by alterations in transcription factor networks resulting from deletion of any of the three connexins. Moreover, the highly significant overlap between transcriptomic alterations in Cx43 KO and Cx43 siRNA treated (KD) astrocytes suggests that the widespread changes more likely reflect connexin-dependent gene regulatory networks rather than developmental compensation for the missing gene (Iacobas et al., Reference Iacobas, Iacobas, Urban-Maldonado, Scemes and Spray2008). This report shows that connexin genes also modulate the MYE substrate either directly (Fig. 3) or through the regulatory ICS and CYR networks (Fig. 4, and see supplementary Fig. 2). Moreover, our data indicate that pan-glial regulatory transcriptomic networks may work also in the absence of gap junctional coupling, possibly through interglial Ca2+ and cytokine signaling.
Astrocyte proximity elevated Ezh2 to the most prominent MYE gene, replacing Notch1 (most prominent in control Oli-neu cells). This result is important because it confirms and quantifies the role of Ezh2 in the proliferation and differentiation of oligodendrocytes (Sher et al., Reference Sher, Rössler, Brouwer, Balasubramaniyan, Boddeke and Copray2008). However, by preserving its high MYE profile ( ) even in the vicinity of astrocytes, Notch1 receptor signaling remains a key factor in regulating oligodendrocyte progenitor differentiation and myelin formation in development, and during remyelination in the adult CNS (Zhang et al., Reference Zhang, Argaw, Gurfein, Zameer, Snyder and Ge2009).
The Prominence Analysis revealed that many genes related to the Ca2+- and cytokine signaling may have a significant impact on MYE. Therefore, we consider that any ICS and CYR gene exhibiting GP < 50 with MYE fabric should be considered as a node of MYE fabric. Thus, MYE gene fabric in oligodendrocytes located in the proximity of astrocytes should include also Cacna1f, Chrm1, Crlf1/2/3, Egr1, Gnas, Ifngr1, Irak1, Irak1bp1, Leng1, Ppp3cb, Tnfrsf4/19/21 (Fig. 8B). By the same argument, MYE fabric in DIF oligodendrocytes may include: Adrbk1, Cacna1f, Chrm1, Crlf2, Egr1, Gnaq, Grin2d, Irak1, Itpr3, Leng1, Ppp3ca, Prkaca, Tnfrsf1a/4/12a/21, Trpc1 (Fig. 8A).
ACKNOWLEDGEMENTS
S.I. performed the microarray and D.A.I. made the analyses and wrote the manuscript. This work was supported in part by the Ruth L. Kirschtein National Research Service Award to perform research on pangalial transcriptomics (SI) and by NS041282 to Dr. David C. Spray (Einstein), whose comments on biological interpretation are gratefully acknowledged.
Statement of interests
None.
Supplementary material
The supplementary material referred to in this article can be found online at journals.cambridge.org/ngb.