Nomenclature
Acronyms
- AGTF30
-
advanced geared turbofan 30,000 lbf
- GTE
-
gas turbine engine
- ISA
-
international standard atmosphere
- LPV
-
linear parameter varying
- LMI
-
linear matrix inequality
- LS
-
least-squares
- SLS
-
sea level static
Units
-
 ${{\rm{\;}}^ \circ }$
R
-
Degrees Rankine
- lbf
-
pound force
- Pa
-
pascals
- pps
-
pounds per second
- rpm
-
revolutions per minute

Symbols
-
$I$
-
identity matrix
-
$\alpha $
-
scheduling parameter for the LPV model
-
$u$
-
system input
-
$x$
-
system state
-
$y$
-
system output
-
${S_{{u_{(\phi)}}}},{S_{{\alpha _{(\phi)}}}},{S_{{x_{(\phi)}}}},{S_{{{\dot x}_{(\phi)}}}},{S_{{y_{(\phi)}}}}$
-
scaling matrices for referred transformation, for the input, scheduling parameter, state, and state derivative respectively; all functions of the inlet conditions
$\phi $
-
${J_{(\alpha)}},{A_{(\alpha)}},{B_{(\alpha)}},{C_{(\alpha)}},{D_{(\alpha)}}$
-
scheduled system matrices, functions of
$\alpha $
-
${\mathcal{u}_{(\alpha)}},{\mathcal{x}_{(\alpha)}},{\mathcal{y}_{(\alpha)}}$
-
values of the inputs and states respectively at the lineraisation points, functions of
$\alpha $
-
$\delta $
-
inlet pressure correction coefficient
-
$\theta $
-
inlet temperature correction coefficient
-
$\phi $
-
engine inlet conditions
-
$p_{(\alpha)}^m$
-
array containing the monomials powers of
$\alpha $
up to order
$m$
-
${\rm{HPC}}$
-
high-pressure compressor
-
${\rm{NH}}$
-
high-pressure shaft speed
-
${\rm{Ma}}$
-
mach number
-
${{\rm{P}}_{\rm{i}}}$
-
pressure at station i
-
${{\rm{T}}_{\rm{i}}}$
-
temperature at station i
-
${\rm{TGT}}$
-
temperature of the gas turbine
-
${{\rm{W}}_{\rm{i}}}$
-
mass flow at station i
-
${{\rm{W}}_{\rm{f}}}$
-
fuel flow


1.0 Introduction
Gas turbines have a non-linear relationship between the actuator inputs and the system behaviour over the thrust and operating envelope. While non-dimensional techniques can be used to lessen the non-linear effects of the variations related to changes in altitude and Mach number [Reference Walsh and Fletcher1], the engine behaviour still remains non-linear across the power range.
These non-linearities lead to known challenges in gas turbine control design, leading to complex designs using min-max protections [Reference Imani and Montazeri-Gh2, Reference Imani and Montazeri-Gh3], and the use of multi-dimensional look-up tables [Reference Austin Spang and Brown4], which complicates the design task and the maintenance/update of parameters. Optimal control methods promise to deliver improved engine performance and efficiency, as well as systematic constraints handling [Reference Montazeri-Gh, Rasti, Jafari and Ehteshami5], but this must be achieved with an implementation that is simple and interpretable if the control solution is to achieve airworthiness certification [Reference Henderson, Harbour and Cohen6].
There are two classical approaches that can be taken when identifying models [Reference Van Overschee and De Moor7]: first-principles, and black-box. The former can be time-consuming and, depending on the system, even unattainable in practice, requiring intimate knowledge of the system being modelled, but that offers interpretable dynamics retaining the physical meaning of variables and coefficients. On the other hand, black-box modelling is a purely data-driven process that provides a potentially highly accurate model, but with no interpretable states, thus losing the relation between the physical process and the model parameters. A third branch of approaches arises by incorporating some knowledge of the plant to the identification process: grey-box modeling [Reference Sohlberg and Jacobsen8].
These differences become even more pronounced when the system contains non-linearities, as the first-principles modelling turns more complex, and deeper knowledge of the system is required, while black-box structures increase in complexity, ranging from the simpler polynomial models with regressors (NARMAX) to the most complex neural networks [Reference Pearson9].
The linear-parameter-varying (LPV) modelling methodology can be used as a grey-box method to model engine dynamics, by incorporating engineering knowledge, i.e. acknowledging that the dynamics are mainly driven by the shafts [Reference Jaw and Mattingly10], and the rest of variables change in a faster time-span. Hence preserving the interpretability of the state, the coefficients become the Jacobians of the true dynamics, and no deeper knowledge is required, as the coefficients will be identified using data.
This approach offers a flexible and powerful framework that enables the use of well-established linear control techniques for non-linear systems [Reference Shamma11]. This is typically achieved via approximating the non-linear dynamics by a set of linear models, obtained at certain operating points, and interpolating the model parameters in order to build a piecewise-linear model. The interpolation strategy is a design choice, and it is usually chosen so the resulting model is a convex function of the scheduling variable. Designing controllers when using an LPV model, together with robust control techniques, allows guaranteeing stability while enabling performance tuning [Reference Shamma11].
The non-linearities in the system dynamics are typically accommodated in LPV models by using one, or more, scheduling variables. These scheduling variables define the operating points at which the system behaviour was linearised (e.g. the engine presents a linear behaviour at a fixed thrust setting, when introducing sufficiently small variations to all actuation and disturbances).
Examples in the literature of using this paradigm for the modelling and control of jet engines include, among others, the modelling of stall and surge using a polynomial LPV approach by Bamieh et al. [Reference Bamieh, Giarré, Raimondi, Bauso, Lodato and Rosa12], where the authors first derive the non-linear model from available first-principles equations and then identify an LPV representation following an intensive simulation-based procedure. The motivation to build the LPV representation, though of similar complexity to the original physics-based model, is to enable the design of a gain-scheduled controller. The method used to fit a pre-specified number of coefficients to the data consists in the authors’ recursive least-squares algorithm [Reference Bamieh and Giarré13], which collects data as the analytical non-linear model is perturbed, and solves the problem of minimising the prediction error. The method relies on previous knowledge of the non-linear equations of the system dynamics in order to support the selection of the scheduling variable and the order of the polynomials, and no considerations about stability preservation are made.
Other work shows the design of a gain-scheduled controller from an LPV model by Balas [Reference Balas14], in order to drive the core engine parameters. An in-depth review of LPV is offered, as well as linear matrix inequality (LMI) methods to perform stability analysis, and to tune and synthesise controllers for such systems. However, it is assumed in the example provided, a Pratt & Whitney turbofan, that the Jacobians are available to generate the constant matrices that form the polynomials, i.e., again full knowledge of the non-linear system equations is presumed, as well as the ability to derive the Jacobians.
A polynomial LPV framework is also proposed by Jia et al. [Reference Jia, Shi, Li, Han and Xiao15], in order to support the design of a robust controller. The paper serves as a motivational example for LPV models with application to control design, providing details on how to synthesise robust controllers, and how to place the closed-loop eigenvalues using LMI methods via the definition of stability regions. The fan relative speed is used as the only scheduling parameter. The same assumption about the Jacobians than in Balas [Reference Balas14] is made, and the authors do not consider changes in the environmental conditions, i.e. altitude and Mach.
All these applications depend on the availability of a non-linear model of the engine, or at least on the possibility of obtaining the Jacobians by means of numerical calculations. When neither of these options are available, or when obtaining them is not possible, a data-driven identification process will be required. This paper addresses the modelling of an engine purely based on data, while imposing desired properties, such as interpretability, smoothness and stability.
Potential areas of applicability include onboard digital twins, monitoring and engine health estimation, non-linear control design by dynamic inversion, or fast Monte-Carlo studies.
1.1 Linear-parameter-varying modelling challenges
The main practical challenges when linearising the behaviour of non-linear systems is the calculation of the Jacobian. This may lead to complex expressions (when attempting a derivation from first-principles), and/or to high-order systems (if trying to fit a black-box model to experimental data), making it difficult to use such models for control design or optimisation purposes.
Identification of non-linear systems following an LPV representation presents in itself a different set of challenges:
-
• Validity of the model: Identification of the linear coefficients can only be done by introducing small variations to the system input at each operating point [Reference Bamieh and Giarré16]. This might not be problematic when the operating conditions only depend on environmental variables (i.e., external scheduling parameters), that can be kept constant during each identification experiment. However, if the operating conditions are defined by the system state (i.e., internal scheduling parameters), these will change during the experiment as a result of the perturbations. Therefore the linear parameters identified will not be strictly correct, yielding an inaccurate linear representation at each operating point.
-
• Coherency and interpretability of the models: Black-box identification techniques often render a state-space representation of the system with no direct physical meaning, hence identification at different operating points may result in abstract system states that are incompatible from one condition to the next [Reference Zhang and Ljung17]. Ensuring that the states maintain their physical meaning is key to preserve interpretability of the models, as well as coherency across all operating conditions.
-
• Bumpless transitions between operating points: Since the identification is performed at each operating point, usually in an isolated manner, the coefficients do not necessarily vary smoothly with the scheduling. This contrasts with the physical system, and may lead to abrupt changes in the dynamics, in the neighbourhood of each operating point. Abrupt changes in dynamics lead to oscillatory behaviour when under feedback control. In addition, the non-smoothness complicates a possible optimal control implementation with the presence of non-differentiable functions.
-
• Stability enforcement for inherently stable systems: Performing numerical identification may yield unstable representations of stable systems, if this condition is not enforced explicitly as part of the process [Reference Lacy and Bernstein18]. Gas turbine engines are inherently stable systems, and therefore this is an additional challenge to address during the identification.
All these challenges motivate the design of an interpretable polynomial LPV identification framework with differentiability of the system parameters.
1.2 Proposed linear-parameter-varying framework for GTE modelling
In order to capture both the effects of the changes introduced in the dynamics by the external conditions (inlet pressure and temperature), as well as by the variations in the internal conditions (power rating), a polynomial quasi-LPV paradigm with referred engine parameters is proposed in this paper to model gas turbine engines (GTEs).
The model will account for the changes in the inlet conditions (altitude, Mach number and temperature variation) by referring the inputs to sea-level-static (SLS) before performing any computations. The use of referred parameter groups simplifies the modelling task, reducing the sources of non-linearities to only one: the power rating. Then, if the model captures correctly the dynamics at SLS, the dynamics in the rest of the operating envelope can be extrapolated by introducing these corrections, as all engine parameters are well represented by these referred relationships [Reference Walsh and Fletcher1].
Once the dynamic calculations are performed, which also need the inlet conditions to refer the time constant of the system, the outputs obtained will be referred back to the current operating conditions, thus obtaining the behaviour of the engine at all points in the envelope as a function of its behaviour at SLS. The process is illustrated in Fig. 1.
LPV model concept diagram.

1.3 Notation
Throughout the paper, the standard mathematical notation is used, with lowercase letters representing array variables, e.g.
 $x$
, and uppercase letters representing matrix variables, e.g.
 $A$
. The symbol
 $\mathbb{R}$
is the set of real numbers, while
 $\mathbb{S}$
and
 $\mathbb{D}$
are the sets of symmetric and diagonal matrices respectively.
The dimensions of the sets are specified as exponents, and any restrictions as subscripts, e.g.
 $\mathbb{S}_{ + + }^{{n_x}}$
(
 $\mathbb{S}_ + ^{{n_x}}$
) is the set of positive definite (positive semi-definite) symmetric matrices of order
 ${n_x}$
.
The definiteness and semi-definiteness of a matrix are represented by the mathematical symbols
 $ \prec $
and ≼. The symbol
 $I$
represents the identity matrix of appropriate dimensions. The operator
 $ \otimes $
is the Kronecker product of two matrices.
The dependency with time of any variable is indicated with the suffix
 $(t)$
.
1.4 Aim and contribution of this paper
This paper aims at developing a modelling framework for gas turbine engines, yielding a linear-parameter-varying representation of the dynamics of the system that preserves the interpretability of the state, while keeping the coefficients smooth as functions of the scheduling variable, and guarantees stability of the engine model.
The model architecture is described in detail in section 2, and section 3 provides the description of the identification algorithm to obtain each of the elements that constitute the model. The main contribution of this paper is presented here, as a formal method to identify the coefficients of a polynomial quasi-LPV representation that maintains the input-to-state stability inherent to gas turbine engines.
Finally, the approach described in this paper is applied to identify the open-source engine model AGTF30 developed by NASA [Reference Chapman and Litt19]. The resulting model shows a high degree of accuracy in the predictions of the engine behaviour at SLS and during a take-off manoeuvre.
2.0 Smooth linear-parameter-varying modelling framework for gas turbine engines
The LPV model proposed in this paper is shown in detail in Fig. 2, where the steps from Fig. 1 have been expanded.
LPV model diagram.

As the inputs
 ${\bar u_{(t)}}$
are received, these are referred to SLS coordinates in the Input transformation step, by using the inlet conditions
 ${\phi _{(t)}}$
. The referred inputs
 ${u_{(t)}}$
are then used in the Scheduling and state transition step to calculate the derivatives of the referred scheduling variable
 ${\alpha _{(t)}}$
, and the referred state
 ${x_{(t)}}$
, together with the current values of these variables. The derivatives are then referred back to the current operating conditions using
 ${\phi _{(t)}}$
in the Derivatives and back-transformation step, before the Integration step. The scheduling variable and state are referred to SLS in the Scheduling and state transformation step, so these can be used in the derivatives and the output calculation. Back-referring the derivatives to the current operating conditions before integration is a key step in order to preserve the time constant of the dynamics in the current operating conditions
The referred output
 ${y_{(t)}}$
is finally obtained in the Output equation step using the referred versions of input, scheduling variable and state. The output is referred back to the current operating conditions using
 ${\phi _{(t)}}$
in the Output back-transformation step.
2.1 Elements of the linear-parameter-varying engine model
The model from Fig. 2 consists of the following elements: inlet conditions, input to the system, scheduling variables, system states, system outputs, transformation gains, offset maps and dynamic maps. These are described in the following subsections.
2.1.1 Inlet conditions and the transformation gains
The external operating conditions, i.e. altitude, Mach number and temperature variations, define the conditions of the air at the engine inlet, and have a considerable impact on how the engine behaves. Nevertheless, it is possible to account for the variations in these conditions by using referred corrections [Reference Walsh and Fletcher1]. These corrections are typically performed with coefficients that are function of the inlet temperature and pressure, and depending on which variable is being referred, a different parameter is used. For example, the shaft speed is corrected by the square root of the parameter
 $\theta $
, while the shaft acceleration is referred by using the parameter
 $\delta $
. Let us recall here the definition [Reference Walsh and Fletcher1] of these two coefficients:
 \begin{align} \delta = \frac{{{P_{inlet}}}}{{{P_{SLS}}}},{\rm{\;\;\;\;\;\;\;\;}}\theta = \frac{{{T_{inlet}}}}{{{T_{SLS}}}}, \end{align}
where the subscript inlet refers to the inlet total conditions of the engine, which are variable in time, and the subscript SLS refers to sea-level-static conditions, which are constant.
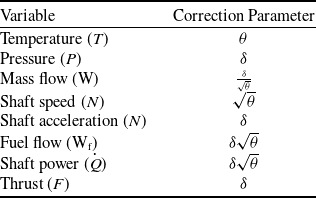
A table with the common engine variables and their respective correction coefficients can be seen in Appendix A. The inlet conditions are therefore defined as in the following equation:
 \begin{align} {\phi _{(t)}} = \left[ {\begin{array}{c}{{\delta _{(t)}}}\\{{\theta _{(t)}}}\end{array}} \right]. \end{align}
Using the inlet conditions, the transformation matrices
 ${S_{{u_{(\phi)}}}} \in {\mathbb{D}^{{n_u}}}$
for the input,
 ${S_{{\alpha _{(\phi)}}}} \in {\mathbb{D}^{{n_\alpha }}}$
and
 ${S_{{{\dot \alpha }_{(\phi)}}}} \in {\mathbb{D}^{{n_\alpha }}}$
for the scheduling variable and its derivative,
 ${S_{{x_{(\phi)}}}} \in {\mathbb{D}^{{n_x}}}$
and
 ${S_{{{\dot x}_{(\phi)}}}} \in {\mathbb{D}^{{n_x}}}$
for the state and its derivative, and
 ${S_{{y_{(\phi)}}}} \in {\mathbb{D}^{{n_y}}}$
for the output are defined, containing in their diagonal the correction coefficients corresponding to each signal. For example, if the state of the system consists of a vector with two shaft speeds, the transformation matrix
 ${S_{{x_{(\phi)}}}}$
would be a square matrix of size two, with the coefficient for the shaft speeds in both its diagonal elements, as per:
 \begin{align} {S_{{x_{(\phi)}}}} = \left[ {\begin{array}{c@{\quad}c}{\sqrt \theta } & 0 \\ 0 & {\sqrt \theta }\end{array}} \right]. \end{align}
2.1.2 Input to the system
The signal
 ${\bar u_{(t)}} \in {\mathbb{R}^{{n_u}}}$
represents all the inputs to the system, i.e. fuel flow, geometry variation, and offtakes. This input is referred to its SLS equivalent
 ${u_{(t)}} \in {\mathbb{R}^{{n_u}}}$
via left-multiplying it by the inverse of the input correction matrix
 ${S_{{u_{(\phi)}}}}$
, as per
 \begin{align} {u_{(t)}} = S_{{u_{(\phi)}}}^{ - 1}{\bar u_{(t)}}. \end{align}
2.1.3 Scheduling variable
The internal scheduling variable
 ${\bar \alpha _{(t)}} \in {\mathbb{R}^{{n_\alpha }}}$
is an abstraction of the level of power at which the engine is operating. It can be one, or several, of the variables relevant to the power rating, e.g. fan speed, engine pressure ratio or thrust [Reference Samar and Postlethwaite20], or even a combination of them. In this paper however, we are proposing to use only one scheduling variable, as it has been shown in the literature [Reference Jia, Shi, Li, Han and Xiao15, Reference Mahmood, Griffin, Fleming and Shutler21], as well as our testing in section 4, to be sufficient to represent the changes in engine behaviour.
Inspired by the work in the design of a feedback linearising engine controller using inversion of dynamics [Reference Mahmood, Griffin, Fleming and Shutler21], the scheduling variable will be chosen as a normalised version of the high-pressure shaft speed, in the absence of changes in the geometry or offtakes, i.e. it will be an idealised version of the high-pressure shaft speed, that only takes into account the changes in the fuel flow. The geometry will be assumed to follow its nominal values, as per the performance engineers have prescribed, and with no offtake (or with a constant one).
The derivative of the scheduling variable is calculated in referred coordinates following the expression:
 \begin{align} {\dot \alpha _{(t)}} = {J_{(\alpha)}}\big( {{u_{(t)}} - {\mathcal{u}_{(\alpha)}}} \big), \end{align}
where the matrix
 ${J_{(\alpha)}} \in {\mathbb{R}^{{n_\alpha } \times {n_u}}}$
is the transition matrix that governs the scheduling dynamics at SLS, and
 ${\mathcal{u}_{(\alpha)}} \in {\mathbb{R}^{{n_u}}}$
is the input offset at the linearisation point.
Before integration, the scheduling variable is returned to the current operating conditions by multiplication with the correction matrix
 ${S_{{{\dot \alpha }_{(\phi)}}}}$
, and then referred to SLS with the matrix
 ${S_{{\alpha _{(\phi)}}}}$
, as in the following expressions:
 \begin{align} {\dot {\bar \alpha} _{(t)}} = {S_{{{\dot \alpha }_{(\phi)}}}}{\dot \alpha _{(t)}}, \\[-25pt] \notag \end{align}
 \begin{align} {\bar \alpha _{(t)}} = {\bar \alpha _{\left( 0 \right)}} + \mathop \smallint \nolimits_0^t {\dot{ \bar \alpha} _{\left( \tau \right)}}{\rm{\;}}d\tau , \\[-25pt] \notag \end{align}
 \begin{align} {\alpha _{(t)}} = S_{{\alpha _{(\phi)}}}^{ - 1}{\bar \alpha _{(t)}}. \\[-25pt] \notag \end{align}
2.1.4 System state
The variables that capture the dynamic behaviour of the engine are represented by the state vector
 ${\bar x_{(t)}} \in {\mathbb{R}^{{n_x}}}$
, which in this paper are considered to be the shaft speeds, as it is common practice when modelling gas turbine engines [Reference Jaw and Mattingly10, Reference Chapman and Litt19]. The state derivative is calculated in referred coordinates following the expression:
 \begin{align} {\dot x_{(t)}} = {A_{(\alpha)}}\left( {{x_{(t)}} - {\mathcal{x}_{(\alpha)}}} \right) + {B_{(\alpha)}}\left( {{u_{(t)}} - {\mathcal{u}_{(\alpha)}}} \right), \end{align}
where the matrices
 ${A_{(\alpha)}} \in {\mathbb{R}^{{n_x} \times {n_x}}}$
and
 ${B_{(\alpha)}} \in {\mathbb{R}^{{n_x} \times {n_u}}}$
are respectively the state transition matrix and the input matrix, and
 ${\mathcal{x}_{(\alpha)}} \in {\mathbb{R}^{{n_x}}}$
is the state offset, all evaluated at the linearisation point given by the value of
 $\alpha $
at time
 $t$
.
As with the scheduling variable, the state is returned to the current operating conditions before integration, by multiplication with the correction matrix
 ${S_{{{\dot x}_{(\phi)}}}}$
, and then referred back to SLS with the matrix
 ${S_{x(\phi)}}$
, as in:
 \begin{align} {\dot {\bar x}_{(t)}} = {S_{{{\dot x}_{(\phi)}}}}{\dot x_{(t)}}, \\[-25pt] \notag \end{align}
 \begin{align} {x_{(t)}} = S_{x(\phi)}^{ - 1}{\bar x_{(t)}}. \end{align}
2.1.5 System output
The variables of interest, i.e. those variables required in the application that will use this model, are the system outputs in
 ${\bar y_{(t)}} \in {\mathbb{R}^{{n_y}}}$
. These may be a set of pressures, temperatures, mass flows, shaft speeds or even thrust.
The output is calculated in referred coordinates as per the expression:
 \begin{align} {y_{(t)}} = {\mathcal{y}_{(\alpha)}} + {C_{(\alpha)}}\left( {{x_{(t)}} - {\mathcal{x}_{(\alpha)}}} \right) + {D_{(\alpha)}}\left( {{u_{(t)}} - {\mathcal{u}_{(\alpha)}}} \right),\end{align}
where the matrices
 ${C_{(\alpha)}} \in {\mathbb{R}^{{n_y} \times {n_x}}}$
and
 ${D_{(\alpha)}} \in {\mathbb{R}^{{n_y} \times {n_u}}}$
are respectively the output matrix and the feedthrough matrix, and
 ${\mathcal{y}_{(\alpha)}} \in {\mathbb{R}^{{n_y}}}$
is the output offset, all evaluated at the linearisation point given by the value of
 $\alpha $
at time
 $t$
.
The output is referred back to the current operating conditions by multiplication with the correction matrix
 ${S_{{y_{(\phi)}}}}$
, as in:
 \begin{align} {\bar y _{(t)}} = {S_{{y_{(\phi)}}}}{y_{(t)}}. \\[-25pt] \notag \end{align}
2.1.6 Offset maps
The offset functions
 ${\mathcal{u}_{(\alpha)}} \in {\mathbb{R}^{{n_u}}}$
,
 ${\mathcal{x}_{(\alpha )}} \in {\mathbb{R}^{{n_x}}}$
, and
 ${\mathcal{y}_{(\alpha)}} \in {\mathbb{R}^{{n_y}}}$
are the static non-linear maps that relate the scheduling variable with the input, system state, and output respectively, at each linearisation point. These maps are obtained by experimentation, in steady-state, after driving the system to each operating point.
The system is taken to each linearisation point with prior knowledge of the combinations of the actuation variables (typically fuel flow and geometry position) and disturbances (e.g. power offtakes) that follow the conditions prescribed by the engine design engineers, for nominal operation of the system.
2.1.7 Dynamics maps
The dynamic maps
 ${J_{(\alpha)}} \in {\mathbb{R}^{{n_\alpha } \times {n_u}}}$
,
 ${A_{(\alpha)}} \in {\mathbb{R}^{{n_x} \times {n_x}}}$
,
 ${B_{(\alpha)}} \in {\mathbb{R}^{{n_x} \times {n_u}}}$
,
 ${C_{(\alpha)}} \in {\mathbb{R}^{{n_y} \times {n_x}}}$
, and
 ${D_{(\alpha)}} \in {\mathbb{R}^{{n_y} \times {n_u}}}$
describe the system trajectory in time as functions of the scheduling variable.
These maps, in a traditional LPV framework [Reference Shamma11] would be constant at each operating point, and then interpolated when between operating points in order to reconstruct the dynamic matrix, however, this approach can yield abrupt changes in the dynamics when operating close to the linearisation points at which the coefficients have been obtained, depending on the interpolation strategy, making the maps non-differentiable.
The use of a polynomial structure in the maps provides smoothness, as well as reduces the number of coefficients matrices to be identified. As a caveat, this structure needs to be explicitly considered during the identification of all the dynamics, and the formulation to guarantee stability becomes more challenging.
2.2 The structure of the dynamics maps
When identifying a system using an LPV representation, the approach to be considered could consist in interpolating between different models running in parallel, with the computational burden that running a large number of models in parallel would entail, or interpolating the coefficients used in one single model. The latter takes typically the form of a piece-wise representation of the system matrices, simpler to identify using local experiments, in contrast to more complex forms, like the one chosen here: the polynomial representation.
2.2.1 Piece-wise representation
The standard representation of LPV matrices, for example in the case of
 ${A_{(\alpha)}}$
, would follow Equation (14), where the weights
 ${\mu _{{j_{(\alpha)}}}} \in {\mathbb{R}^1}$
are the interpolation coefficients.
 \begin{align} {A_{(\alpha)}} = \mathop \sum \limits_{j = 1}^N {\mu _{{j_{(\alpha)}}}}{A_j}. \end{align}
Each matrix
 ${A_j}$
is typically obtained experimentally at each operating point [Reference Zhang and Ljung17], in isolation from the rest of operating points. This may lead to artificial abrupt changes in the dynamics, making the matrices non-differentiable with respect to the scheduling variable.
2.2.2 Polynomial representation
Constructing the dynamic matrices as in Equation (14) is only possible if the state-space linearisation points are coherent, i.e. if the states have the same meaning at the different linearisation points. This is not necessarily the case when the models are identified from data, at different operating conditions, using black-box identification tools [Reference Zhang and Ljung17].
To address these challenges, we are proposing to use prior knowledge of the structure of the system, fixing the states to known mechanical variables: the shaft speeds of the engine. This provides coherency and interpretability of the models.
Furthermore, in order to preserve the smoothness of the true functions, we are aiming at representing the system dynamic matrices using m-order polynomial functions, as in:
 \begin{align} {A_{(\alpha)}} = {A_0} + \alpha {A_1} + {\alpha ^2}{A_2} + \ldots + {\alpha ^m}{A_m},{\rm{\;\;\;\;\;\;\;\;}}{A_{(\alpha)}} = \mathop \sum \limits_{j = 0}^m {\alpha ^j}{A_j}, \end{align}
where the matrices
 ${A_j}$
have the same dimensions of
 ${A_{(\alpha)}}$
, and the scheduling variable is a scalar
 $\alpha \in {\mathbb{R}^1}$
.
3.0 Model identification process
This section details the identification process when using a high-fidelity engine model to execute the experiments.
The identification process is outlined in Fig. 3, and detailed in the following subsections.
Summary of steps in the identification process.

The steps of the process are:
-
1. Identification experiments: The system will be exercised with a first experiment changing only the main input to move between operating points, and then with a second set of experiments changing all inputs randomly at each operating point. The aim is to collect sufficient data to identify the offsets and dynamics throughout the power operating range of the engine.
-
2. Static maps: The offset are identified first, as the static conditions reached when the system is at rest at each operating point. This ensures that the model converges to the true points when the inputs are static.
-
3. Scheduling dynamics: The coefficients of the model are scheduled based on an internal parameter that represents power. This step identifies how this parameter changes in time as a function of the main input.
-
4. State dynamics: The main contribution of the paper is found here, as the states are modelled following the dynamics of the shaft speeds for interpretability and coherency, instead of using a black-box approach, while enforcing stability via means of solving a constrained least-squares problem with LMIs. The importance of this contribution is evidenced by the results, in section 4, where an unconstrained least-squares identification yields an unstable system.
-
5. Output equation: All the variables of interest are identified as combinations of the scheduled coefficients, the states and the inputs.
-
6. Validation: Finally, the model is validated using additional experiments. This is shown in the results in section 4.
3.1 Identification experiments
Two sets of experiments are needed in order to identify the engine as proposed here, both executed at SLS:
-
• Staircase in fuel flow. The experiment consists in setting all disturbances to their nominal constant value, all the geometry to their design schedule, and introduce a staircase signal in fuel flow to the engine, leaving enough simulation time between steps to allow the system to settle. From this experiment, the offset maps and the scheduling dynamics will be identified. To design the steps magnitude, the fuel flow range is discretised to
$n$
operating points, so each step moves the fuel flow from one operating point to the next. -
• Random perturbations at each operating point. A series of experiments will first take the engine to each operating point and then introduce a random sequence of perturbation to all the inputs, to guarantee sufficient excitation [Reference Bamieh and Giarré16]. The matrices defining the state dynamics and the output equation will be identified from these
${n_e}$
experiments.


The number of operating points should be as low as possible to keep the amount of data to a minimum, but high enough to accurately capture the changes in all system variables throughout the power range.
3.2 Static maps and the scheduling variable
The static maps are obtained as the values of all the variables involved, i.e. inputs, states and outputs, when the system is at rest. The data from the first experiment are used here.
The values of the scheduling variable are taken here as the values of the high-pressure shaft speedFootnote 1 , normalised by its maximum value, i.e. the array of values of the scheduling variable is defined by:
 \begin{align} {\alpha _{ss}} = N{H_{ss}}{\rm{\;\;}}{\left( {NH_{ss}^{\, max}} \right)^{ - 1}}. \end{align}
where
 $NH_{ss} \in \mathbb{R}_ + ^{n_{ss}}$
is an array with the static values of the high-pressure shaft speed at each operating point, and
 $NH_{ss}^{max}$
 $ \in \mathbb{R}_ + ^1$
is the maximum value of that array.
Using this vector, and the data from each of the variables being modelled, the static maps are built as interpolation functions. By way of example, Equation (17) shows the static map definition corresponding to the first input, using linear interpolation between data points.
 \begin{align} {\mathcal{u}_1}:{\rm{\;}}{\mathcal{u}_1}_{(\alpha)} = \frac{{\left( {{\alpha _{ss,j}} - \alpha } \right){{\rm{W}}_{\rm{f}}}_{ss,j - 1} + \left( {\alpha - {\alpha _{ss,j - 1}}} \right){{\rm{W}}_{\rm{f}}}_{ss,j}}}{{{\alpha _{ss,j}} - {\alpha _{ss,j - 1}}}}{\rm{\;\;}};{\rm{\;\;}}{\alpha _{ss,j - 1}} \le \alpha \le {\alpha _{ss,j}},{\rm{\;\;}}\forall j = \left[ {2{\rm{\;}} \ldots {\rm{\;}}n_{ss}} \right], \end{align}
where
 ${\mathcal{u}_1}$
is the first input, chosen as the fuel flow (
 ${{\rm{W}}_{\rm{f}}}$
), and the symbol
 ${{\rm{W}}_{\rm{f}}}_{ss,j}$
refers to the value of the fuel flow in steady-state, in the data point
 $j$
.
3.3 Dynamics of the scheduling variable
In order to model how the scheduling variable changes in time as a function of the input, the entire dataset from the first experiment will be used, including the parts consisting of system dynamics.
Even though the dynamics are defined in continuous time in Equation (5), the data is assumed to be recorded in discrete-time, at a constant sampling period
 ${{\rm{\Delta }}_t}$
. Discretisation of Equation (5) by forward Euler [Reference Biswas, Chatterjee, Mukherjee and Pal22] for sufficiently small
 ${{\rm{\Delta }}_t}$
yields:
 \begin{align} {\dot \alpha _{(t)}} = \mathop {{\rm{lim}}}\limits_{{{\rm{\Delta }}_t} \to {\rm{\;}}0} \frac{{{\alpha _{\left( {t + {{\rm{\Delta }}_t}} \right)}} - {\alpha _{(t)}}}}{{{{\rm{\Delta }}_t}}}, \end{align}
 \begin{align} {\alpha _{\left( {t + {{\rm{\Delta }}_t}} \right)}} \approx {\alpha _{(t)}} + {{\rm{\Delta }}_t}{\rm{\;}}{J_{(\alpha)}}{\rm{\;}}\left( {{u_{(t)}} - {\mathcal{u}_{(\alpha)}}} \right). \\[5pt] \notag\end{align}
Renaming the time variable by its discrete sample equivalent, and rearranging Equation (19) leads to:
 \begin{align} {\alpha _{\left( {k + 1} \right)}} - {\alpha _{\left( k \right)}} = \left[ {{\rm{\;}}{J_0}{\rm{\;\;}}{J_1}{\rm{\;\;}}{J_2}{\rm{\;}} \cdots {\rm{\;}}{J_{{m_J}}}{\rm{\;}}} \right]\left( {{\rm{\;\;}}\left[ {\begin{array}{c}1\\{\alpha_{\left( k \right)}}\\[3pt]{\alpha _{\left( k \right)}^2}\\[3pt] \vdots \\[3pt] {\alpha _{\left( k \right)}^{{m_J}}}\end{array}} \right] \otimes \left[ {{\rm{\;}}1{\rm{\;}}0{\rm{\;}} \cdots {\rm{\;}}0{\rm{\;}}} \right]{\rm{\;\;}}} \right)\left( {{u_{\left( k \right)}} - {\mathcal{u}_{\left( {\alpha ,k} \right)}}} \right){{\rm{\Delta }}_t}, \end{align}
where
 ${m_J}$
is the order of the polynomial, the variables
 ${J_j} \in {\mathbb{R}^1};\forall j \in \left[ {0 \ldots {m_J}} \right]$
, are the coefficients of the polynomial representation of
 ${J_{(\alpha)}}$
, and the matrix
 $\left[ {{\rm{\;}}1{\rm{\;}}0{\rm{\;}} \cdots {\rm{\;}}0{\rm{\;}}} \right]$
is used to select only the first input among the signals in
 ${u_{\left( k \right)}}$
. A more compact representation of Equation (20) follows:
 \begin{align} {\tilde \alpha _{\left( k \right)}} = \skew4\bar J {\rm{\;}}\left( {{\rm{\;}}p_{\left( {\alpha ,k} \right)}^{{m_J}} \quad \otimes \quad \left[ {{\rm{\;}}1{\rm{\;}}0{\rm{\;}} \cdots {\rm{\;}}0{\rm{\;}}} \right]{\rm{\;}}} \right){\rm{\;\;}}{\tilde u_{\left( {\alpha ,k} \right)}}{\rm{\;\;}}{{\rm{\Delta }}_t},{\rm{\;\;\;\;\;\;\;\;}}{\tilde \alpha _{\left( k \right)}} = \skew4\bar J {\rm{\;\;}}{v_{\left( {\alpha ,k} \right)}},\end{align}
where
 $\skew4\bar J \in {\mathbb{R}^{1 \times \left( {{m_J} + 1} \right)}}$
is the matrix containing the constant coefficients to be identified,
 $p_{\left( {\alpha ,k} \right)}^{{m_J}} = {[{\rm{\;}}1{\rm{\;\;}}{\alpha _{\left( k \right)}} \cdots \alpha _{\left( k \right)}^{{m_J}}{\rm{\;}}]^T}$
is the array containing the monomials of the polynomial representation,
 ${\tilde \alpha _{\left( k \right)}}$
is the difference between the values of the scheduling variable at the current and the next samples,
 ${\tilde u_{\left( {\alpha ,k} \right)}}$
is the difference from the input to the offset as a function of the scheduling variable in the current sample, and
 ${v_{\left( {\alpha ,k} \right)}}$
is an auxiliary variable that captures the multiplication of the polynomial with the input difference and the sampling period.
The equation is now ready for least-squares identification [Reference Söderström23], by grouping the data from the experiment in array form as per:
 \begin{align} \left[ {{\rm{\;}}{{\tilde \alpha }_{\left( 1 \right)}}{\rm{\;\;}}{{\tilde \alpha }_{\left( 2 \right)}}{\rm{\;}} \cdots {\rm{\;}}{{\tilde \alpha }_{\left( {l - 1} \right)}}{\rm{\;}}} \right] = {\bar{J} ^{\rm{*}}}\left[ {{\rm{\;}}{v_{\left( 1 \right)}}{\rm{\;\;}}{v_{\left( 2 \right)}}{\rm{\;}} \cdots {\rm{\;}}{v_{\left( {l - 1} \right)}}{\rm{\;}}} \right],{\rm{\;\;\;\;\Lambda }} = {\skew4\bar J ^{\rm{*}}}V, \end{align}
where
 $l$
is the number of data points. The solution to the least-squares problem isFootnote
2
 $\skew4\bar J = {\rm{\Lambda }}{V^T}{\left( {V{V^T}} \right)^{ - 1}}$
. The proof can be found in Appendix B.1.
3.4 Dynamics of the system state
In order to identify the matrices
 ${A_{(\alpha)}}$
and
 ${B_{(\alpha)}}$
from the state equation defined by Equation (9), the second set of experiments is used, containing random excitations of the inputs at different operating points.
First, the behaviour of the scheduling variable during each of the experiments has to be obtained. The scheduling variable is not readily available from the data of these experiments because it is a construct that represents the behaviour of the high-pressure shaft when the system is excited exclusively by the fuel flow. Instead, the scheduling variable will be calculated by iterating Equation (19), i.e., iterating the expression:
 \begin{align} {\alpha _{\left( {t + {{\rm{\Delta }}_t},i} \right)}} = {\alpha _{\left( {t,i} \right)}} + {{\rm{\Delta }}_t}{\rm{\;}}{J_{\left( {\alpha ,i} \right)}}{\rm{\;}}\left( {{u_{\left( {t,i} \right)}} - {\mathcal{u}_{\left( {\alpha ,i} \right)}}} \right). \end{align}
The initial value for this calculation, i.e.
 ${\alpha _{\left( {0,i} \right)}}$
, will be taken as equal to the initial value of the high-pressure shaft speed in each experiment, before any changes are introduced to the inputs, and normalised by the same factor that was used in Equation (16), i.e. the scheduling variable for each experiment
 $i$
starts at:
 \begin{align} {\alpha _{\left( {t = 0,i} \right)}} = N{H_{\left( {t = 0,i} \right)}}{\rm{\;}}{\left( {NH_{ss}^{max}} \right)^{ - 1}}, \end{align}
Once the sequence of values of the scheduling variables is built for each experiment using Equation (23), and following the same discretisation approach for the state transition defined in Equation (9), the state dynamics of each experiment
 $i$
can be formulated as:
 \begin{align} {x_{\left( {t + {{\rm{\Delta }}_t},i} \right)}} \approx {x_{\left( {t,i} \right)}} + {{\rm{\Delta }}_t}{\rm{\;}}{A_{\left( {\alpha ,i} \right)}}{\rm{\;}}\left( {{x_{\left( {t,i} \right)}} - {\mathcal{x}_{\left( {\alpha ,i} \right)}}} \right) + {{\rm{\Delta }}_t}{\rm{\;}}{B_{\left( {\alpha ,i} \right)}}{\rm{\;}}\left( {{u_{\left( {t,i} \right)}} - {\mathcal{u}_{\left( {\alpha ,i} \right)}}} \right). \end{align}
The state-transition equation can now be formulated in discrete-time explicitly, with the coefficients and monomials, as per:
 \begin{align*} {x_{\left( {k + 1,i} \right)}} - {x_{\left( {k,i} \right)}} = \left[ {{\rm{\;}}{A_0}{\rm{\;\;}}{A_1}{\rm{\;\;}}{A_2}{\rm{\;}} \cdots {\rm{\;}}{A_{{m_A}}}{\rm{\;}}} \right]\left( {{\rm{\;\;}}\left[ {\begin{array}{c}1\\[3pt]{{\alpha _{\left( {k,i} \right)}}}\\[3pt]{\alpha _{\left( {k,i} \right)}^2}\\[3pt] \vdots \\ {_{\left( {k,i} \right)}^{{m_A}}}\end{array}} \right] \otimes {I_{{n_x}}}{\rm{\;\;}}} \right)\left( {{x_{\left( {k,i} \right)}} - {\mathcal{x}_{\left( {\alpha ,k,i} \right)}}} \right){{\rm{\Delta }}_t}{\rm{\;}} + \end{align*}
 \begin{align} \left[ {{\rm{\;}}{B_0}{\rm{\;\;}}{B_1}{\rm{\;\;}}{B_2}{\rm{\;}} \cdots {\rm{\;}}{B_{{m_B}}}{\rm{\;}}} \right]\left( {{\rm{\;\;}}\left[ {\begin{array}{c}1\\{{\alpha _{\left( {k,i} \right)}}}\\{\alpha _{\left( {k,i} \right)}^2}\\ \vdots \\{\alpha _{\left( {k,i} \right)}^{{m_B}}}\end{array}} \right] \otimes {I_{{n_u}}}{\rm{\;\;}}} \right)\left( {{u_{\left( {k,i} \right)}} - {\mathcal{u}_{\left( {\alpha ,k,i} \right)}}} \right){{\rm{\Delta }}_t}, \end{align}
where
 $k$
represents the discrete time step, the variables
 ${A_j} \in {\mathbb{R}^{{n_x} \times {n_x}}},{\rm{\;}}\forall j \in \left[ {0,{m_A}} \right]$
, and
 ${B_j} \in {\mathbb{R}^{{n_x} \times {n_u}}},$
 $\forall j \in \left[ {0,{m_B}} \right]$
, are the constant coefficients of the polynomial representations of the matrices
 ${A_{(\alpha)}}$
and
 ${B_{(\alpha)}}$
, and
 ${m_A}$
and
 ${m_B}$
are the order of the polynomials used to model the state transition dynamicsFootnote
3
. A more compact representation of Equation (26) follows:
 \begin{align} {\xi _{\left( {k,i} \right)}} = \bar A \left( {{\rm{\;}}p_{\left( {\alpha ,k,i} \right)}^{{m_A}} \otimes {I_{{n_x}}}{\rm{\;}}} \right){\rm{\;}}{\tilde x_{\left( {\alpha ,k,i} \right)}}{\rm{\;}}{{\rm{\Delta }}_t} + \bar B {\rm{\;}}\left( {{\rm{\;}}p_{\left( {\alpha ,k,i} \right)}^{{m_B}} \otimes {I_{{n_u}}}{\rm{\;}}} \right){\rm{\;}}{\tilde u_{\left( {\alpha ,k,i} \right)}}{\rm{\;}}{{\rm{\Delta }}_t},{\rm{\;\;\;\;\;\;\;\;}}{\xi _{\left( {k,i} \right)}} = {{\rm{\Phi }}^{\rm{*}}}{\rm{\;}}{\eta _{\left( {k,i} \right)}} \end{align}
where
 ${{\rm{\Phi }}^{\rm{*}}} = \left[ {{\rm{\;}}\bar A {\rm{\;\;}}\bar B {\rm{\;}}} \right]$
is the matrix with the coefficients to be identified,
 $p_{\left( {\alpha ,k,i} \right)}^m = {[{\rm{\;}}1{\rm{\;\;}}{\alpha _{\left( {k,i} \right)}} \cdots \alpha _{\left( {k,i} \right)}^m{\rm{\;}}]^T}$
is the array containing the monomials up to order
 $m$
,
 ${\xi _{\left( {k,i} \right)}}$
is the difference between the values of the state at the current and the next samples,
 ${\tilde x_{\left( {\alpha ,k,i} \right)}}$
is the difference from the state to the offset,
 ${\tilde u_{\left( {\alpha ,k} \right)}}$
is the difference from the input to the offset, and
 ${\eta _{\left( {k,i} \right)}}$
is an auxiliary variable defined by Equation (28). All in the current sample
 $k$
during experiment
 $i$
.
 \begin{align} {\eta _{\left( {k,i} \right)}} = \left[ {{\rm{\;}}\begin{array}{c}{\left( {{\rm{\;}}p_{\left( {\alpha ,k,i} \right)}^{{m_A}} \otimes {I_{{n_x}}}{\rm{\;}}} \right){\rm{\;}}{{\tilde x}_{\left( {\alpha ,k,i} \right)}}}\\{\left( {{\rm{\;}}p_{\left( {\alpha ,k,i} \right)}^{{m_B}} \otimes {I_{{n_u}}}{\rm{\;}}} \right){\rm{\;}}{{\tilde u}_{\left( {\alpha ,k,i} \right)}}}\end{array}{\rm{\;}}} \right]{\rm{\;}}{{\rm{\Delta }}_t}. \end{align}
The equation can now be defined in array form, following the same approach than in Equation (22), which yields:
 \begin{align} \left[ {{\rm{\;}}{\xi _{\left( {1,i} \right)}}{\rm{\;}}{{\rm{\;}}\xi_{\left( {2,i} \right)}}{\rm{\;}} \cdots {\rm{\;}}{\xi _{\left( {{l_i} - 1,i} \right)}}{\rm{\;}}} \right] = {{\rm{\Phi }}^{\rm{*}}}\left[ {{\rm{\;}}{\eta _{\left( {1,i} \right)}}{\rm{\;\;}}{\eta _{\left( {2,i} \right)}}{\rm{\;}} \cdots {\rm{\;}}{\eta _{\left( {{l_i} - 1,i} \right)}}{\rm{\;}}} \right],{\rm{\;\;\;\;}}{F_{\left( i \right)}} = {{\rm{\Phi }}^{\rm{*}}}{\rm{\;}}{H_{\left( i \right)}}, \end{align}
where
 ${l_i}$
is the number of samples available from experiment
 $i$
, and new matrices
 ${F_{\left( i \right)}} \in {\mathbb{R}^{{n_x} \times \left( {{l_i} - 1} \right)}}$
and
 ${H_{\left( i \right)}} \in {\mathbb{R}^{\left( {{n_x}\left( {{m_A} + 1} \right) + {n_u}\left( {{m_B} + 1} \right)} \right) \times \left( {{l_i} - 1} \right)}}$
contain all the data from each experiment
 $i$
.
We are now ready to formally introduce the main result of this paper:
Lemma 1.
The solution
 $\left( {{\rm{\Phi }},P} \right)$
to the optimisation problem posed in Equation (30) provides the best fit to the system dynamics in the least squares sense, while ensuring the stability of the system, when using polynomials of orders
 ${m_J}$
,
 ${m_A}$
and
 ${m_B}$
.
 \begin{align} \mathop {{\rm{min}}}\limits_{{\rm{\Phi }},P}\quad \frac{1}{{2{\rm{\;}}\left( {\mathop \sum \nolimits_{i = 1}^{{n_e}} \left( {{l_i} - 1} \right)} \right)}}tr\left( {\mathop \sum \limits_{i = 1}^{{n_e}} W_\xi ^{ - 1}\left( {{F_{\left( i \right)}} - {\rm{\Phi }}{H_{\left( i \right)}}} \right){{\left( {{F_{\left( i \right)}} - {\rm{\Phi }}{H_{\left( i \right)}}} \right)}^T}W_\xi ^{ - 1}} \right), \end{align}
 \begin{align} {\rm{s}}{\rm{.t}}{\rm{.}}\quad\;\;\;{({\rm{\Phi }}{M_j})^T}P + P\left( {{\rm{\Phi }}{M_j}} \right) \prec 0;{\rm{\;\;\;\;}}\forall j \in \left[ {1 \ldots {n_{ss}}} \right],{\rm{\;}} \end{align}
 \begin{align} P \succ 0, \end{align}
where
 ${n_e}$
is the number of experiments,
 ${n_{ss}}$
is the number of points in the static maps obtained in section 3.2,
 $P \in \mathbb{S}_{ + + }^{{n_x}}$
is the Lyapunov variable, the matrix
 ${W_\xi } \in {\mathbb{D}^{{n_x}}}$
contains that maximum values found in the data for each component of the vector
 $\xi $
in its diagonal, and the matrices
 ${M_j}$
are defined using the values of the scheduling variable at each point
 $j$
from the static maps, i.e.
 ${\alpha _{ss,j}}$
, as per:
 \begin{align} {M_j} = \left[ {{\rm{\;}}\begin{array}{c}{{\rm{\;}}p_{\left( {{\alpha _{ss,j}}} \right)}^{{m_A}} \otimes {I_{{n_x}}}}\\{{0_{{n_u}\left( {n + 1} \right) \times {n_x}}}}\end{array}{\rm{\;}}} \right]. \end{align}
The proof is straightforward, and is discussed here briefly:
Proof of Lemma 1.
First, since the cost function being optimised is the same as the multi-experiment least squares problem, defined in Appendix B.2, it follows that the resulting solution will be also optimal in the least squares sense. Second, multiplication of
 ${\rm{\Phi }}$
by
 ${M_j}$
results in the state transition matrix
 ${A_{\left( {\alpha = {\alpha _{ss,j}}} \right)}}$
, hence, the addition of the
 ${n_{ss}}$
constraints in Equation (30b) with a common Lyapunov variable provides stability guarantees throughout the schedule, as per the Lyapunov Shaping Paradigm [Reference Scherer, Gahinet and Chilali24].
Conversely, the optimisation problem defined in Equation (30) is not implementable as is, and therefore, in order to solve the problem in practice, we will solve an alternative optimisation. We introduce here the following:
Lemma 2.
The solution
 $\left( {{\rm{\Phi }},Q,P,Y,Z} \right)$
to the optimisation problem posed in Equation (32) also solves the problem posed in Equation (30) using the duple
 $\left( {{\rm{\Phi }},P} \right)$
obtained.
 \begin{align} \mathop {{\rm{min}}}\limits_{{\rm{\Phi }},Q,P,Y,Z}\quad \frac{1}{{2{\rm{\;}}\left( {\mathop \sum \nolimits_{i = 1}^{{n_e}} \left( {{l_i} - 1} \right)} \right)}}tr\left( Q \right), \\[-10pt] \notag \end{align}
 \begin{align} \!\!\!\!\!{\rm{s}}{\rm{.t}}{\rm{.}}\quad \;\;\;\;\left[ {\begin{array}{c@{\quad}c}{\skew4\bar F {{\skew4\bar F }^T} - \skew4\bar F {{\skew4\bar H }^T}{{\rm{\Phi }}^T} - {\rm{\Phi }}\skew4\bar H {{\skew4\bar F }^T} - {W_\xi }Q{W_\xi }} & {{\rm{\Phi }}\skew4\bar H {{\skew4\bar H }^T}} \\[5pt]{\skew4\bar H {{\skew4\bar H }^T}{\rm{\Phi }}} & { - \skew4\bar H {{\skew4\bar H }^T}}\end{array}} \right] &\prec 0{\rm{\;,}} \\[-10pt] \notag\end{align}
 \begin{align} \left[ {\begin{array}{c@{\quad}c}{PY + {Y^T}P} & {{{\left( {{\rm{\Phi }}{M_j}} \right)}^T} + PZ - {Y^T}}\\[5pt ]{\left( {{\rm{\Phi }}{M_j}} \right) + {Z^T}P - Y} & { - Z - {Z^T}}\end{array}} \right] &\prec 0;{\rm{\;\;\;\;}}\forall j \in \left[ {1,{n_{ss}}} \right], \\[-10pt] \notag\end{align}
 \begin{align} P &\succ 0, \\[8pt] \nonumber\end{align}
where
 $\skew4\bar F = \left[ {{\rm{\;\;}}{F_{\left( 1 \right)}}{\rm{\;}} \cdots {\rm{\;}}{F_{\left( {{n_e}} \right)}}{\rm{\;\;}}} \right]$
and
 $\skew4\bar H = \left[ {{\rm{\;\;}}{H_{\left( 1 \right)}}{\rm{\;}} \cdots {\rm{\;}}{H_{\left( {{n_e}} \right)}}{\rm{\;\;}}} \right]$
are augmented matrices containing the data from all the experiments. The proof follows from application of the procedure described in Appendix B.4.
3.5 Output equation
The final step consists in the identification of the coefficients to build the polynomial matrices
 ${C_{(\alpha)}}$
and
 ${D_{(\alpha)}}$
from Equation (12). The process in this case is simpler than the state transition equation as there are no dynamics involved, and hence, only the multi-experiment nature is to be considered. The data from the same set of experiments as in the previous section are used here.
Once the sequence of values of the scheduling parameter is obtained for each experiment, as described by Equation (23), and following the same manipulation that was performed from Equation (25) to Equation (27), but for the output equation, the following expression is reached:
 \begin{align} {\tilde y_{\left( {k,i} \right)}} = \bar C \left( {p_{\left( {p,k,i} \right)}^{{m_C}} \otimes {I_{{n_x}}}} \right){\tilde x_{\left( {k,i} \right)}} + \bar D \left( {p_{\left( {p,k,i} \right)}^{{m_D}} \otimes {I_{{n_u}}}} \right){\tilde u_{\left( {k,i} \right)}},{\rm{\;\;\;\;\;\;\;\;}}{\tilde y_{\left( {k,i} \right)}} = {{\rm{\Omega }}^{\rm{*}}}{\rm{\;}}{\gamma _{\left( {k,i} \right)}} \end{align}
where
 ${\tilde y_{\left( {k,i} \right)}} = {y_{\left( {k,i} \right)}} - {\mathcal{y} _{\left( {k,i} \right)}}$
is the difference from each output to the corresponding offset,
 ${{\rm{\Omega }}^{\rm{*}}} = \left[ {{\rm{\;\;}}\bar C {\rm{\;\;}}\bar D {\rm{\;\;}}} \right]$
is the matrix to be identified, with
 $\bar C = \left[ {{\rm{\;\;}}{C_1}{\rm{\;}} \cdots {\rm{\;}}{C_{{m_C}}}{\rm{\;\;}}} \right]$
and
 $\bar D = \left[ {{\rm{\;\;}}{D_1}{\rm{\;}} \cdots {\rm{\;}}{D_{{m_D}}}{\rm{\;\;}}} \right]$
containing all the coefficients, while the monomial arrays
 $p_{\left( {p,k,i} \right)}^{{m_C}}$
and
 $p_{\left( {p,k,i} \right)}^{{m_D}}$
follow the same structure than the monomials in Equation (27), but with the orders
 ${m_C}$
and
 ${m_D}$
. These are grouped together with the state and input deviations in a new variable
 ${\gamma _{\left( {k,i} \right)}}$
, defined as:
 \begin{align} {\gamma _{\left( {k,i} \right)}} = \left[ {{\rm{\;}}\begin{array}{c}{\left( {{\rm{\;}}p_{\left( {\alpha ,k,i} \right)}^{{m_C}} \otimes {I_{{n_x}}}{\rm{\;}}} \right){\rm{\;}}{{\tilde x}_{\left( {\alpha ,k,i} \right)}}}\\[4pt]{\left( {{\rm{\;}}p_{\left( {\alpha ,k,i} \right)}^{{m_D}} \otimes {I_{{n_u}}}{\rm{\;}}} \right){\rm{\;}}{{\tilde u}_{\left( {\alpha ,k,i} \right)}}}\end{array}{\rm{\;}}} \right]. \end{align}
Following the same approach as in Equation (29), the following array form is reached:
 \begin{align} \left[ {{\rm{\;}}{{\tilde y}_{\left( {1,i} \right)}}{\rm{\;\;}}{{\tilde y}_{\left( {2,i} \right)}}{\rm{\;}} \cdots {\rm{\;}}{{\tilde y}_{\left( {{l_i},i} \right)}}{\rm{\;}}} \right] = {{\rm{\Omega }}^{\rm{*}}}\left[ {{\rm{\;}}{\gamma _{\left( {1,i} \right)}}{\rm{\;\;}}{\gamma _{\left( {2,i} \right)}}{\rm{\;}} \cdots {\rm{\;}}{\gamma _{\left( {{l_i},i} \right)}}{\rm{\;}}} \right],{\rm{\;\;\;\;}}{E_{\left( i \right)}} = {{\rm{\Omega }}^{\rm{*}}}{\rm{\;}}{G_{\left( i \right)}}, \end{align}
where, in contrast to the state equation, the full set of data points
 ${l_i}$
of each experiment can be used, since it is a static equation, and the new matrices
 ${E_{\left( i \right)}} \in {\mathbb{R}^{{n_y} \times {l_i}}}$
and
 ${G_{\left( i \right)}} \in {\mathbb{R}^{\left( {{n_x}\left( {{m_C} + 1} \right) + {n_u}\left( {{m_D} + 1} \right)} \right) \times {l_i}}}$
gather all the data from each experiment.
The identification problem in this case can be posed as the following unconstrained multi-experiment least-squares optimisation:
 \begin{align} \mathop {{\rm{min}}}\limits_{\rm{\Omega }} \frac{1}{{2{\rm{\;}}\left( {\mathop \sum \nolimits_{i = 1}^{{n_e}} {l_i}} \right)}}\mathop \sum \limits_{i = 1}^{{n_e}} tr\left( {W_{\tilde y}^{ - 1}\left( {{E_{\left( i \right)}} - {\rm{\Omega }}{G_{\left( i \right)}}} \right){{\left( {{E_{\left( i \right)}} - {\rm{\Omega }}{G_{\left( i \right)}}} \right)}^T}W_{\tilde y}^{ - 1}} \right). \end{align}
where the matrix
 ${W_{\tilde y}} \in {\mathbb{D}^{{n_y}}}$
contains, in its diagonal, the maximum values found in the data of the array
 $\tilde y$
.
The solution to this problem is given by the following expression, as shown in Appendix B.2:
 \begin{align} {\rm{\Omega }} = \left( {\mathop \sum \limits_{i = 1}^{{n_e}} {E_{\left( i \right)}}G_{\left( i \right)}^T} \right){\left( {\mathop \sum \limits_{i = 1}^{{n_e}} {G_{\left( i \right)}}G_{\left( i \right)}^T} \right)^{ - 1}}. \end{align}
4.0 Modelling of the advanced geared turbofan
In order to apply and test the method proposed in this paper, the open-source engine model AGTF30 [Reference Chapman and Litt19] (advanced geared turbofan 30,000 lbf) is used in this section. This model consists of two shafts: the high-pressure shaft, connecting the high-pressure turbine and compressor, and the low-pressure shaft, connecting the low-pressure turbine and compressor. The low pressure shaft also drives the front fan through a gearbox. The actuation variables for this engine are: fuel flow (
 ${{\rm{W}}_{\rm{f}}}$
), low-pressure variable bleed valve (LPVBV), and variable area fan nozzle (VAFN), while the disturbances are: high-pressure offtake (HPX) and low-pressure offtake (LPX).
To illustrate the proposed modelling methodology, the scheduling variable is selected as the high-pressure shaft speed, normalised and in nominal conditions as discussed in section 3, while the dynamic states are selected as both shaft speeds, and the outputs as the high-pressure compressor mass flow, and the temperature of the gas turbine (TGT), two of the most relevant parameters for control purposes, along with the shaft speeds.
4.1 Identification of the turbofan engine
Following the process outlined in section 3, first an identification experiment changing only the fuel flow is executed, letting the system to reach steady state in between steps. Then the static maps are extracted from these steady-state conditions. Fig. 4 shows the experiment with the selected operating conditions, while Fig. 5 shows the static maps for two of the variables to be identified: the mass flow in the high-pressure compressor, taken at station 36 (
 ${\text{W}_{36}}$
), and the temperature of the gas turbine.
Fuel flow (left) and high-pressure shaft speed (right) during the first identification experiment. The operating points are selected once steady-state is reached, right before the next step is introduced.

Static maps of HPC mass flow (left) and turbine temperature (right).

Once the static maps are built, the data from the same experiment are used to identify the scheduling dynamics, i.e. the dynamics of the high-pressure shaft normalised speed at SLS using the least-squares approach from section 3.3. The results are shown in Fig. 6 for three different levels of power, and when using orders 0, 1 and 2 for the polynomial representation of matrix
 ${J_{(\alpha)}}$
. It can be observed that order 2 provides the best fit to the data in all operating conditions. The sampling period for the data identification was chosen as
 ${{\rm{\Delta }}_t} = 0.1$
s.
Modelling of the scheduling variable. The steps at three operating conditions from Fig. 4 are shown: idle (left), medium thrust (centre), and full thrust (right). The polynomial of order 2 fits better the data at all operating conditions.

Next, the state dynamics are identified, as prescribed in section 3.4. For this, one experiment with random inputs is executed starting at each one of the 17 operating points identified in Fig. 4. The behaviour of the shaft speeds during the experiment at the first operating point is shown in Fig. 8.
Optimisation cost of the state dynamics identification when using unconstrained LS, in comparison to LMI-constrained LS, when choosing polynomial orders 1 to 3.

State simulation using unconstrained and LMI-constrained LS during experiment 1.

The algorithm from section 3.4 was executed using orders 1 to 3 for the polynomials of matrices
 ${A_{(\alpha)}}$
and
 ${B_{(\alpha)}}$
. In addition, an unconstrained multi-experiment least-squares identification was also run for the same orders, to understand better the impact of introducing the stability constraints. Fig. 7 shows the cost of each experiment (trace of the square error, as defined in Equation 43).
 \begin{align} {Q_i} = \frac{1}{{{n_{{d_i}}}}}W_\xi ^{ - 1}\left( {{F_{\left( i \right)}} - {\rm{\Phi }}{H_{\left( i \right)}}} \right){\left( {{F_{\left( i \right)}} - {\rm{\Phi }}{H_{\left( i \right)}}} \right)^T}W_\xi ^{ - 1}, \end{align}
where
 ${n_{{d_i}}}$
is the number of data points of experiment
 $i$
,
 ${W_\xi } \in {\mathbb{D}^{{n_x}}}$
is a diagonal matrix containing the maximum values of the states (i.e. the values at full thrust), and the matrices
 ${E_{\left( i \right)}}$
,
 ${F_{\left( i \right)}}$
, and
 ${\rm{\Phi }}$
are as defined in section 3.4.
The LMI method, when using orders 1 and 2, produces the same result than the unconstrained method, indicating that the constraints are not active, and therefore, the optimum solution yields also a stable system. However, when increasing to order 3, the solution differs: the total cost in the constrained case is
 $1.517 \times {10^{ - 8}}$
, in comparison with
 $1.516 \times {10^{ - 8}}$
in the unconstrained case. This is the numerical price of adding stability to the model. It is indeed well-known [Reference g26] that increasing the order of a polynomial to fit a curve risks over-fitting, obtaining lower errors in the cost function, but may result in models unrepresentative of the underlying physical process. The importance of the stability constraint is visible in Fig. 8, where the model identified via unconstrained least-squares with order 3 becomes unstable, while the model identified using the proposed method preserves stability. This is also noticeable in the behaviour of the eigenvalues of the state matrix, shown in Fig. 9, on page 17, where we see how the first eigenvalue, in the unconstrained LS case, becomes positive for a large proportion of the simulation.
Eigenvalues using unconstrained and LMI-constrained LS during experiment 1.

Finally, the output equation is identified following the method in section 3.5 using the same experiments as for the state dynamics. Figure 10, on page 17, shows the values of the cost function for the two outputs selected:
 ${\text{W}_{36}}$
and TGT. The order for the state transition matrices is chosen as 3, while in order to illustrate the benefits of increasing the order of the polynomials, both orders 2 and 3 will be used in the results.
Optimisation cost of the output equation identification when using orders 1 to 3 in the polynomials.

4.2 Model validation at sea-level-static and take-off conditions
In order to validate the model obtained in the previous section, two experiments at different operating conditions show how the model behaves in comparison with the data.
First, the validation is executed at SLS, to purely assess the behaviour of the polynomial matrices. Then, a second experiment is executed at a different operating point, to also assess the modelling framework, including the referred parameters correction.
The first experiment consists in a slam at SLS, changing the thrust reference from minimum to maximum, and back, all while keeping altitude and Mach number unchanged. The results are shown in Fig. 11, on page 18, where the model outputs are compared to the experiment data during the slam manoeuvre. The differences in the signals are barely noticeable, with errors around 1% for the two orders selected for the output equation, being the maximum deviation in the case of polynomial order 3 of 0.906%, whereas the maximum deviation of polynomial order 2 reaches 1.321%.
Comparison between the model outputs and experiment data during the slam manoeuvre.

To test the referred corrections, a second experiment is run, consisting in a take-off manoeuvre. In this case the thrust reference changes from idle to maximum, and the Mach number is allowed to increase until it reaches 0.8, while the altitude remains at sea level, mimicking a real take-off. The results are shown in Fig. 12, on page 18, where again the model outputs are compared to the data. The differences in this case grow as the Mach number increases, but keeping the error below 4% for both outputs and polynomial orders. The higher error when changing the Mach number can be explained by the inaccuracies of the referred parameter corrections when the geometry varies considerably [Reference Walsh and Fletcher1].
Comparison between the model outputs and experiment data during the take-off manoeuvre.

5.0 Conclusions
This paper presents a modelling framework for gas turbine engines consisting of: static maps to capture the non-linearities in the operating points, a polynomial LPV structure to obtain smooth coefficients in the model matrices, an explicit least-squares process preserving the meaning of the states as shaft speeds, with the addition of constraints using LMIs to guarantee the inherent stability of the system, and extrapolating in the operating envelope via means of referred parameters corrections.
The process to identify the engine requires a number of experiments, where the system is excited at sea-level-static throughout the entire power range. These can be executed using a high-fidelity model of the engine, typically available during the design phases of the engine.
The designer needs to decide on the number of operating points to be explored, trading data generation and processing time versus accuracy in the maps, as well as the orders of the polynomials that will represent the system matrices, trading complexity in the matrices versus accuracy in the dynamics and output predictions.
The method has been applied to an open-source engine developed by NASA [Reference Chapman and Litt19], obtaining maximum prediction deviations of 1.32% (when using polynomial order 2 in the output equation) for core mass flow (0.24 pps at the start of the acceleration) and of 0.88% for turbine temperature (19.28
 ${{\rm{\;}}^ \circ }$
R during the deceleration) when simulating a slam manoeuvre at SLS. The referred parameter correction was also tested using a take-off profile, obtaining maximum deviations of 3.31% for core mass flow (2.51 pps at 0.8 Mach) and of −3.55% for turbine temperature (116.88
 ${{\rm{\;}}^ \circ }$
R at Mach 0.8), when compared to the engine data.
The accuracy achieved, together with the simplicity of the structure, and the smoothness of the coefficients, make the model obtained amenable to be utilised in complex optimal control strategies, as well as for advanced designs of synthetic sensors, in order to estimate unmeasurable variables such as thrust or mass flow. This would not be possible without the explicit enforcement of the inherent stability of the system, as demonstrated in the example in section 4, where it was seen that if the order of the polynomial is increased to 3 in order to fit the state transition equation, and no constraints are applied to the least-squares problem, the solution can render an unstable model. Enforcing stability enables the use of higher-order polynomials, which increase the accuracy of the models.
Further work could for example look into improving the accuracy of the estimation when at high Mach number, perhaps by including it as an external scheduling variable, or it could look into developing an optimal control strategy, which would take advantage of this model representation to find the best actuation throughout the flight, in order to achieve a certain business goal (e.g. minimum fuel consumption) subject to a set of operability and safety constraints.
Acknowledgements
The Authors wish to acknowledge funding from Innovate UK under project PINES (113263), and for the purpose of open access, the author has applied a Creative Commons Attribution (CC BY) licence to any Author Accepted Manuscript version arising.
Appendix
A. Referred parameters
This appendix contains the correction coefficients to refer the most common engine variables to sea-level-static. All the parameters in the table are function of either
 $\delta $
or
 $\theta $
, which are defined [Reference Walsh and Fletcher1] as per:
 \begin{align} \delta = \frac{{{P_{inlet}}}}{{{P_{SLS}}}}, \\[-10pt] \notag \end{align}
 \begin{align} \theta = \frac{{{T_{inlet}}}}{{{T_{SLS}}}},\\[8pt] \notag \end{align}
where
 ${P_{inlet}}$
and
 ${T_{inlet}}$
are respectively the pressure and temperature at the inlet of the engine, and
 ${P_{SLS}}$
and
 ${T_{SLS}}$
are the pressure and temperature at sea-level-static according to the International Standard Atmosphere [Reference Walsh and Fletcher1] (ISA), with values of
 ${P_{SLS}} = 101.325{\rm{\;}}kPa$
and
 ${T_{SLS}} = 288.15{\rm{\;}}K$
.
The correction parameters obtained with combinations of
 $\delta $
and
 $\theta $
are shown in Table 1 for the most common engine variables.
Using the coefficients from the table to build the correction matrices is straightforward. For example, the correction matrix for the input, when the inputs are the fuel flow, the variations in the various geometry actuators, and the power offtake in one of the shafts, will be as per the following equation:
 \begin{align} {S_{{u_{(\phi)}}}} = \left[ {\begin{array}{c@{\quad}c@{\quad}c}{\delta \sqrt \theta } &0 &0 \\ 0 &I &0 \\ 0 &0 &{\delta \sqrt \theta }\end{array}} \right], \end{align}
where the coefficients for the fuel flow and shaft power have been set to those from Table 1, and the coefficients for correcting all geometric variations have been set to
 $I$
(identity matrix of dimension equal to the number of geometry variables), as these variables are not corrected when referred to SLS [Reference Walsh and Fletcher1]. For simplicity of notation, the variable
 $\phi $
encapsulates both
 $\delta $
and
 $\theta $
.
B. Least-squares identification
This appendix contains the formulation of the least-squares identification problems from section 3. This appendix builds in complexity, with a first problem using unconstrained least-squares, a second problem with multi-experiment data, and a third one with the addition of constrains, the appendix concludes with the formulation of the constrained least-squares for identification of polynomial models. The name of the variables used in this appendix is generic, and unrelated with the rest of the paper.
B.1 Unconstrained least-squares identification
Given a dependent variable
 $y \in {\mathbb{R}^{{n_y}}}$
, and an independent variable
 $u \in {\mathbb{R}^{{n_u}}}$
, it is desired to obtain a matrix
 ${\rm{\Phi }}$
that relates both as per:
 \begin{align} \left[ {{\rm{\;}}\begin{array}{c}{{y_1}}\\{{y_2}}\\ \vdots \\{y_{{n_y}}}\end{array}{\rm{\;}}} \right] = \left[ {{\rm{\;}}\begin{array}{c}{{{\rm{\Phi }}_1}}\\{{{\rm{\Phi }}_2}}\\ \vdots \\{{{\rm{\Phi }}_{{n_y}}}}\end{array}{\rm{\;}}} \right]\left[ {{\rm{\;}}\begin{array}{c}{{u_1}}\\{{u_2}}\\ \vdots \\{{u_{{n_u}}}}\end{array}{\rm{\;}}} \right],{\rm{\;\;\;\;\;\;\;\;}}y = {\rm{\Phi }}u, \end{align}
where each
 ${y_i}$
is a scalar, every
 ${u_i}$
is a scalar, and
 ${{\rm{\Phi }}_i} \in {\mathbb{R}^{1 \times {n_u}}}$
is a vector with the coefficients of each equation
 ${y_i} = {{\rm{\Phi }}_i}{\rm{\;}}u$
.
Coefficients for referred parameter corrections for most common engine variables

Let us now assume that
 ${n_d}$
data points have been collected from an experiment. The least-squares identification problem is then formulated as a minimisation of the squared error when relating each dependent variable
 ${y_i}$
with all the independent variables
 $u$
through the coefficients in
 ${{\rm{\Phi }}_i}$
, as per:
 \begin{align} \mathop {{\rm{min}}}\limits_{\rm{\Phi }}\quad \frac{1}{{{n_d}{\rm{\;}}{n_y}}}\mathop \sum \limits_{k = 1}^{{n_d}} \mathop \sum \limits_{i = 1}^{{n_y}} \frac{1}{2}{\left( {\frac{{{y_{{i_{\left( k \right)}}}} - {{\rm{\Phi }}_i}{\rm{\;}}{u_{\left( k \right)}}}}{{\left| {{\rm{\;}}y_i^{max}{\rm{\;}}} \right|}}} \right)^2}. \end{align}
where each
 $y_i^{max}$
is the maximum available value of each variable
 ${y_i}$
, used to normalise the error.
This problem can be reformulated using the
 $trace$
operator to yield a simplified matrix form:
 \begin{align} \mathop {{\rm{min}}}\limits_{\rm{\Phi }}\quad \frac{1}{{{n_d}{\rm{\;}}{n_y}}}\mathop \sum \limits_{k = 1}^{{n_d}} \frac{1}{2}tr\left( {{W^{ - 1}}\left( {{y_{\left( k \right)}} - {\rm{\Phi \;}}u} \right){{\left( {{y_{\left( k \right)}} - {\rm{\Phi \;}}u} \right)}^T}{W^{ - 1}}} \right). \end{align}
where the matrix
 $W \in {\mathbb{D}^{{n_y}}}$
contains the maximum values of variables
 ${y_i}$
in its diagonal, as per:
 \begin{align} W = \left[ {\begin{array}{c@{\quad}c@{\quad}c@{\quad}c}{\big| y_1^{max}\big|}&0& \cdots &0 \\0&{\big| y_2^{max} \big|} & \cdots &0 \\ \vdots & \vdots & \ddots & \vdots \\ 0 &0 & \cdots & {\big| y_{{n_y}}^{max}\big|} \end{array}} \right]. \end{align}
The data can now be arranged, following the structure from Equation (42), into the following form:
 \begin{align} \left[ {{\rm{\;}}{{\left[ {\begin{array}{c}{{y_1}}\\{{y_2}}\\ \vdots \\{{y_{{n_y}}}}\end{array}} \right]}_{\left( {k = 1} \right)}} \cdots {\rm{\;\;\;\;}}{{\left[ {\begin{array}{c}{{y_1}}\\{{y_2}}\\ \vdots \\{{y_{{n_y}}}}\end{array}} \right]}_{\left( {k = {n_d}} \right)}}{\rm{\;}}} \right] = {\rm{\Phi }}\left[ {{\rm{\;}}{{\left[ {\begin{array}{c}{{u_1}}\\{{u_2}}\\ \vdots \\{{u_{{n_u}}}}\end{array}} \right]}_{\left( {k = 1} \right)}} \cdots {\rm{\;\;\;\;}}{{\left[ {\begin{array}{c}{{u_1}}\\{{u_2}}\\ \vdots \\{{u_{{n_u}}}}\end{array}} \right]}_{\left( {k = {n_d}} \right)}}{\rm{\;}}} \right],{\rm{\;\;\;\;}}Y = {\rm{\Phi }}U, \end{align}
where matrices
 $Y \in {\mathbb{R}^{{n_y} \times {n_d}}}$
and
 $U \in {\mathbb{R}^{{n_u} \times {n_d}}}$
contain all the data from the dependent and independent variables respectively, with each row representing one variable, and each column representing one data point. The unconstrained least-squares identification problem can then be re-formulated as:
 \begin{align} \mathop {{\rm{min}}}\limits_{{\rm{\Phi }},P}\quad \frac{1}{{2{\rm{\;}}{n_d}{\rm{\;}}{n_y}}}tr\left( {{W^{ - 1}}\left( {Y - {\rm{\Phi }}U} \right){{\left( {Y - {\rm{\Phi }}U} \right)}^T}{W^{ - 1}}} \right). \end{align}
To solve this problem, and using the properties of the
 $trace$
operator [Reference Petersen and Pedersen25], the gradient of the cost function, with respect to
 ${\rm{\Phi }}$
is defined as:
 \begin{align} {\nabla _{\rm{\Phi }}}\left( {\frac{1}{{2{\rm{\;}}{n_d}{\rm{\;}}{n_y}}}tr\left( {{W^{ - 1}}\left( {Y - {\rm{\Phi }}U} \right){{\left( {Y - {\rm{\Phi }}U} \right)}^T}{W^{ - 1}}} \right)} \right) = - \frac{1}{{{n_d}{\rm{\;}}{n_y}}}{W^{ - 2}}\left( {Y - {\rm{\Phi }}U} \right){U^T}, \end{align}
where it is clear that the Hessian is positive definite as long as the matrix product
 $U{U^T}$
is full rank, i.e. the result from Equation (49) is a global minimum for the problem defined in Equation (43) if the product
 $U{U^T}$
is non-singular.
 \begin{align} {\rm{\Phi }} = Y{U^T}{\left( {U{U^T}} \right)^{ - 1}}. \end{align}
Remark 1. The solution to the least squares problem is independent from the normalisation factors in the cost function.
B.2 Multi-experiment least-squares identification
Let us now consider the availability of
 ${n_e}$
experiments in the same setting than the previous section, then, the minimisation problem will need to consider the square error across all the experiments, as in:
 \begin{align} \mathop {{\rm{min}}}\limits_{\rm{\Phi }}\quad \frac{1}{{2{\rm{\;}}\left( {\mathop \sum \nolimits_{q = 1}^{{n_e}} {n_{{d_q}}}} \right)}}\mathop \sum \limits_{q = 1}^{{n_e}} tr\left( {{W^{ - 1}}\left( {{Y_q} - {\rm{\Phi }}{U_q}} \right){{\left( {{Y_q} - {\rm{\Phi }}{U_q}} \right)}^T}{W^{ - 1}}} \right), \end{align}
where
 ${Y_q}$
and
 ${U_q}$
are the matrices containing the data from the dependent and independent variables respectively, for each experiment
 $q$
.
The gradient of the cost function is now defined as:
 \begin{align} {\nabla _{\rm{\Phi }}}\left( {\frac{1}{{2{\rm{\;}}\left( {\mathop \sum \nolimits_{q = 1}^{{n_e}} {n_{{d_q}}}} \right)}}\mathop \sum \limits_{q = 1}^{{n_e}} tr\left( {{W^{ - 1}}\left( {{Y_q} - {\rm{\Phi }}{U_q}} \right){{\left( {{Y_q} - {\rm{\Phi }}{U_q}} \right)}^T}{W^{ - 1}}} \right)} \right) \\ \notag = - \frac{1}{{\left( {\mathop \sum \nolimits_{q = 1}^{{n_e}} {n_{{d_q}}}} \right)}}\mathop \sum \limits_{q = 1}^{{n_e}} {W^{ - 2}}\left( {{Y_q} - {\rm{\Phi }}{U_q}} \right)U_q^T, \end{align}
where the condition for the existence of the global minimum is for the matrix resulting from
 $\mathop \sum \nolimits_{q = 1}^{{n_e}} {U_q}U_q^T$
to be full rank. If that is the case, the minimum when setting the gradient to
 $0$
is given by:
 \begin{align} {\rm{\Phi }} = \left( {\mathop \sum \limits_{q = 1}^{{n_e}} {Y_q}U_q^T} \right){\left( {\mathop \sum \limits_{q = 1}^{{n_e}} {U_q}U_q^T} \right)^{ - 1}}. \end{align}
B.3 Constrained least-squares for identification of stable systems
As an additional consideration when a dynamical system is identified, we might want to impose constrains so that, for example, the resulting model is stable.
The open-loop stability of a continuous-time linear system
 $\dot x = Ax$
is guaranteed if there exist a positive definite matrix
 $P$
such that the following LMI is feasible. This is known as the Lyapunov stability condition for linear systems [Reference Bamieh and Giarré16]:
 \begin{align} {A^T}P + PA \prec 0, \end{align}
where
 $P \in \mathbb{S}_{ + + }^{{n_x}}$
is the Lyapunov variable. Let us then set the state derivative
 $\dot x$
as the dependent variable in Equation (42), and
 $x$
as the independent variable. Let us also define
 $\dot X$
and
 $X$
as the matrices containing the
 ${n_d}$
data points from one experiment, for all the state derivatives, and states, respectively. The least-squares identification problem for a stable system can then be defined as in:
 \begin{align} \mathop {{\rm{min}}}\limits_{A,P}\quad &\frac{1}{{2{\rm{\;}}{n_d}}}tr\left( {{W^{ - 1}}\left( {\dot X - AX} \right){{\left( {\dot X - AX} \right)}^T}{W^{ - 1}}} \right),\\[-10pt] \notag \end{align}
 \begin{align} {\rm{s}}{\rm{.t}}{\rm{.}}\quad &{A^T}P + PA \prec 0,{\rm{\;}} \\[-10pt] \notag \end{align}
 \begin{align} &P \succ 0,\\[8pt] \notag \end{align}
where the inequality (54c) is required to ensure that the Lyapunov matrix is positive definite.
Both the cost function and the constraints are non-linear in the decision variables
 $A$
and
 $P$
, and so the problem cannot be solved by existing linear solvers. Therefore, a non-linear solver implementing matrix inequalities is required. Alternatively, in order to avoid the high-computational burden of these solvers, the problem can be linearised as follows.
Let us redefine the optimisation as per:
 \begin{align} \mathop {{\rm{min}}}\limits_{A,Q,P} \quad\frac{1}{{2{\rm{\;}}{n_d}}}tr\left( Q \right), \\[-10pt] \notag \end{align}
 \begin{align} {\rm{s}}{\rm{.t }}\quad \left( {\dot X - AX} \right){\left( {\dot X - AX} \right)^T} &\le WQW,{\rm{\;}} \\[-10pt] \notag\end{align}
 \begin{align} {A^T}P + PA &\prec 0, \\[-10pt] \notag \end{align}
 \begin{align} P &\succ 0, \\[8pt] \notag\end{align}
where the matrix
 $Q \in \mathbb{S}_{ + + }^{{n_x}}$
is an auxiliary variable introduced to obtain a linear cost function. This new formulation does not change the original problem. Next, constraint (55c) is rearranged as in:
 \begin{align} {\left[ {{\rm{\;}}\begin{array}{c}I \\ P\end{array}{\rm{\;}}} \right]^T}\left[ {{\rm{\;}}\begin{array}{c@{\quad}c} 0 &{{A^T}} \\ A & 0 \end{array}{\rm{\;}}} \right]\left[ {{\rm{\;}}\begin{array}{c}I \\ P \end{array}{\rm{\;}}} \right] \prec 0. \end{align}
This inequality can be dilated, without introducing any additional conservatism [Reference Ebihara, Peaucelle and Arzelier27], into the following alternative inequality:
 \begin{align} \left[ {{\rm{\;}}\begin{array}{c@{\quad}c}0&{{A^T}} \\ A &0\end{array}{\rm{\;}}} \right] + \left[ {{\rm{\;}}\begin{array}{c}P\\{ - I}\end{array}{\rm{\;}}} \right]\left[ {{\rm{\;}}\begin{array}{c@{\quad}c}Y &Z\end{array}{\rm{\;}}} \right] + \left[ {{\rm{\;}}\begin{array}{c}{{Y^T}} \\{{Z^T}}\end{array}{\rm{\;}}} \right]\left[ {{\rm{\;}}\begin{array}{c@{\quad}c}P &{ - I}\end{array}{\rm{\;}}} \right] \prec 0, \end{align}
where
 $Y \in {\mathbb{R}^{{n_x} \times {n_x}}}$
and
 $Z \in {\mathbb{R}^{{n_x} \times {n_x}}}$
are two new slack variables that enable the separation of
 $P$
and
 $A$
. It is well known [Reference Ebihara, Peaucelle and Arzelier27] that compliance with (57) implies compliance with (55c). Hence, the new optimisation problem becomes:
 \begin{align} \mathop {{\rm{min}}}\limits_{A,Q,P,Y,Z} \quad \frac{1}{{2{\rm{\;}}{n_d}}}tr\left( Q \right), \\[-10pt] \notag\end{align}
 \begin{align} \!\!\!\!{\rm{s}}{\rm{.t}}{\rm{.}}\quad\;\;\;\left[ {\begin{array}{c@{\quad}c}{\dot X{{\dot X}^T} - A\left( {X{{\dot X}^T}} \right) - \left( {\dot X{X^T}} \right){A^T} - WQW} &{A\left( {X{X^T}} \right)}\\{\left( {X{X^T}} \right){A^T}} &{ - \left( {X{X^T}} \right)}\end{array}} \right] &\le 0{\rm{\;}} \\[-10pt] \notag \end{align}
 \begin{align} \left[ {\begin{array}{c@{\quad}c}{PY + {Y^T}P} & {{A^T} + PZ - {Y^T}}\\{A + {Z^T}P - Y} & { - Z - {Z^T}}\end{array}} \right] &\prec 0, \\[-10pt] \notag \end{align}
 \begin{align} P &\succ 0, \\[8pt] \notag \end{align}
where the constraint (58) has been linearised by virtue of the Schur complement [Reference Petersen and Pedersen25].
The resulting problem formulation can be now solved iteratively with an LMI solver; a first step solving for
 $\left( {A,Q,P} \right)$
with fixed
 $\left( {Y,Z} \right)$
, followed by a second step solving for
 $\left( {A,Q,Y,Z} \right)$
with fixed
 $\left( P \right)$
. This formulation allows having the same cost function in both steps, while simultaneously changing the key variables
 $A$
and
 $Q$
that define the error also in both steps. Solving the optimisation problem using this procedure preserves convexity in the decision variables [Reference Ebihara, Peaucelle and Arzelier27]. This algorithm needs a feasible initial condition for
 $Y$
and
 $Z$
, in order to perform the first step. It is proposed here to use
 ${Y_{initial}} = - I$
and
 ${Z_{initial}} = I$
.
The solution
 $\left( {A,Q,P,Y,Z} \right)$
that solves Equation (58), also solves Equation (54). The proof follows from the implications of the dilation applied from Equation (56) to Equation (57).
B.4 Robust constrained least-squares for stable linear-parameter-varying system identification
Finally, in this paper we need to identify an LPV dynamical system with polynomial structure. This is done using data from a number of experiments, and a known set of operating points.
The polynomials defining the system state transition matrices from Equation (9) are described by:
 \begin{align} {A_{(\alpha)}} = \mathop \sum \limits_{i = 0}^{{m_A}} {\alpha ^i}{A_i},{\rm{\;\;\;\;\;\;\;\;}}{B_{(\alpha)}} = \mathop \sum \limits_{i = 0}^{{m_B}} {\alpha ^{i}}{B_i}, \end{align}
where
 ${m_A}$
and
 ${m_B}$
are the orders of the polynomials,
 $\alpha $
is the scheduling parameter, and matrices
 ${A_i} \in {\mathbb{R}^{{n_x} \times {n_x}}}$
and
 ${B_i} \in {\mathbb{R}^{{n_x} \times {n_u}}}$
are the sets of constant matrices to be identified.
Considering that the scheduling parameter
 $\alpha $
changes in time, this means that the matrices are also time-variant. In order to isolate the constant coefficients from the time-varying scheduling polynomial, the state-transition matrix from Equation (9) can be reformulated as:
 \begin{align} {\dot x_{(t)}} = \left[ {\begin{array}{c@{\quad}c}{\bar A } & {\bar B }\end{array}} \right]\left[ {\begin{array}{c}{\left( {p_{\left( {\alpha ,t} \right)}^{{m_A}} \otimes {I_{{n_x}}}} \right){x_{(t)}}}\\[5pt]{\left( {p_{\left( {\alpha ,t} \right)}^{{m_B}} \otimes {I_{{n_u}}}} \right){u_{(t)}}}\end{array}} \right],{\rm{\;\;\;\;\;\;\;\;}}{\dot x_{(t)}} = \left[ {\begin{array}{c@{\quad}c}{\bar A } & {\bar B }\end{array}} \right]{\eta _{(t)}} \end{align}
where
 $\bar A = \left[ {{\rm{\;\;}}{A_0}{\rm{\;\;}}{A_1}{\rm{\;}} \cdots {\rm{\;}}{A_{{m_A}}}{\rm{\;\;}}} \right]$
and
 $\bar B = \left[ {{\rm{\;\;}}{B_0}{\rm{\;\;}}{B_1}{\rm{\;}} \cdots {\rm{\;}}{B_{{m_B}}}{\rm{\;\;}}} \right]$
are augmented matrices containing all the coefficients to be identified,
 $p_{\left( {\alpha ,t} \right)}^{{m_A}} = {[{\rm{\;\;}}1{\rm{\;\;}}{\alpha _{(t)}}{\rm{\;}} \cdots {\rm{\;}}\alpha _{(t)}^{{m_A}}{\rm{\;\;}}]^T}$
and
 $p_{\left( {\alpha ,t} \right)}^{{m_B}} = {[{\rm{\;\;}}1{\rm{\;\;}}{\alpha _{(t)}}{\rm{\;}} \cdots {\rm{\;}}\alpha _{(t)}^{{m_B}}{\rm{\;\;}}]^T}$
are the arrays of monomials that, together with the coefficients, constitute the polynomial matrices, and
 ${\eta _{(t)}}$
is an auxiliary variable that contains the combined information of the polynomials, the state, and the input. Grouping all the data points of the variables in Equation (60) as described in Equation (46), from each experiment
 $i$
, yields:
 \begin{align} {F_i} = {\rm{\Phi }}{H_i},{\rm{\;\;\;\;}}\forall i = \left[ {1 \ldots {n_e}} \right], \end{align}
where
 ${\rm{\Phi }} = \left[ {{\rm{\;\;}}\bar A {\rm{\;\;}}\bar B {\rm{\;\;}}} \right]$
,
 ${F_i} = \left[ {{\rm{\;\;}}{{\dot x}_{\left( {1,i} \right)}}{\rm{\;\;}}{{\dot x}_{\left( {2,i} \right)}}{\rm{\;}} \cdots {\rm{\;}}{{\dot x}_{\left( {{n_{{d_i}}},i} \right)}}{\rm{\;\;}}} \right]$
,
 ${H_i} = \left[ {{\rm{\;\;}}{\eta _{\left( {1,i} \right)}}{\rm{\;\;}}{\eta _{\left( {2,i} \right)}}{\rm{\;}} \cdots {\rm{\;}}{\eta _{\left( {{n_{{d_i}}},i} \right)}}{\rm{\;\;}}} \right]$
,
 ${n_e}$
is the number of experiments, and
 ${n_{{d_i}}}$
is the number of data points in each experiment
 $i$
.
Combining the multi-experiment least-squares cost function from Equation (50), and the addition of stability constrains from Equation (55), with the set of data defined by Equation (61), the following optimisation problem is posed:
 \begin{align} \mathop {{\rm{min}}}\limits_{{\rm{\Phi }},Q,P}\quad \frac{1}{{2{\rm{\;}}\left( {\mathop \sum \nolimits_{i = 1}^{{n_e}} {n_{{d_i}}}} \right)}}tr\left( Q \right), \\[-10pt] \notag\end{align}
 \begin{align} \!\!{\rm{s}}{\rm{.t}}{\rm{.}}\quad \mathop \sum \limits_{i = 1}^{{n_e}} \left( {{F_i} - {\rm{\Phi }}{H_i}} \right){\left( {{F_i} - {\rm{\Phi }}{H_i}} \right)^T} &\le WQW{\rm{\;}} \\[-10pt] \notag \end{align}
 \begin{align} A_{(\alpha)}^TP + P{A_{(\alpha)}} &\prec 0;{\rm{\;\;\;\;}}\forall \alpha \in \left[ {{\alpha _{min}},{\alpha _{max}}} \right]{\rm{\;}} \\[-10pt] \notag\end{align}
 \begin{align} P &\succ 0, \\[8pt] \notag\end{align}
where the constraints are defined as non-linear, and hence difficult to solve with readily available solvers. In addition, the constraint in Equation (62c) is a function of
 $\alpha $
, which can take values in the defined range.
In order to alleviate this constraint, the Lyapunov shaping paradigm [Reference Scherer, Gahinet and Chilali24] will be used here. If a set of
 ${n_p}$
points is selected within the interval
 $\left[ {{\alpha _{min}},{\alpha _{max}}} \right]$
, and constraint (62c) is replaced by a set of
 ${n_p}$
constraints, then by virtue of the Lyapunov shaping paradigm, the system will be guaranteed to be stable not only at the selected points, but also at any point within the range. The numbers of points will depend on the order of the polynomial that models the matrix
 ${A_{(\alpha)}}$
, the higher the polynomial, the higher the number of points will be needed, so as to have effectively linear interpolation in between each pair of points.
Additionally, two new matrices are defined, in order to group the experiment data:
 \begin{align} \skew4\bar F = \left[ {\begin{array}{c@{\quad}c@{\quad}c@{\quad}c}{{F_1}} &{{F_2}} & \cdots &{{F_{ne}}}\end{array}} \right]{\rm{\;\;\;\;}},{\rm{\;\;\;\;}}\skew4\bar H = \left[ {\begin{array}{c@{\quad}c@{\quad}c@{\quad}c}{{H_1}} &{{H_2}} & \cdots &{{H_{ne}}}\end{array}} \right], \end{align}
Using these matrices, and applying the same previous reasoning, the problem from Equation (62) is now reformulated as:
 \begin{align} \mathop {{\rm{min}}}\limits_{{\rm{\Phi }},Q,P}\quad \frac{1}{{2{\rm{\;}}\left( {\mathop \sum \nolimits_{i = 1}^{{n_e}} {n_{{d_i}}}} \right)}}tr\left( Q \right), \\[-10pt] \notag \end{align}
 \begin{align} {\rm{s}}{\rm{.t}}{\rm{. }}\quad \left( {\skew4\bar F - {\rm{\Phi }}\skew4\bar H } \right){\left( {\skew4\bar F - {\rm{\Phi }}\skew4\bar H } \right)^T} &\le WQW,{\rm{\;}} \\[-10pt] \notag \end{align}
 \begin{align} {\left( {{\rm{\Phi }}{M_j}} \right)^T}P + P\left( {{\rm{\Phi }}{M_j}} \right) &\prec 0;{\rm{\;\;\;\;}}\forall j \in \left[ {1,2, \ldots ,{n_p}} \right]{\rm{\;}} \\[-10pt] \notag \end{align}
 \begin{align} P &\succ 0, \\[8pt] \notag\end{align}
where the matrix
 ${M_j}$
is defined as the matrix by which we need to multiply
 ${\rm{\Phi }}$
in order to obtain the value of the state matrix when the scheduling variable is equal to the selected operating condition
 $j$
, i.e.
 ${A_{\left( {\alpha = {\alpha _j}} \right)}} = {\rm{\Phi }}{M_j}$
:
 \begin{align} {M_j} = \left[ {\begin{array}{c}{p_{\left( {{\alpha _j}} \right)}^{{m_A}} \otimes {I_{{n_x}}}}\\{{0_{{n_u}\left( {{m_B} + 1} \right) \times {n_x}}}}\end{array}} \right]. \end{align}
This set of constraints can be simplified by means of the dilation explained in the previous section, in Equation (58).
Finally the constraint in Equation (64b) can be linearised by using the Schur complement [Reference Petersen and Pedersen25]. Applying these changes to the optimisation problem yields:
 \begin{align} \mathop {{\rm{min}}}\limits_{{\rm{\Phi }},Q,P,Y,Z}\quad \frac{1}{{2{\rm{\;}}\left( {\mathop \sum \nolimits_{i = 1}^{{n_e}} {n_{{d_i}}}} \right)}}tr\left( Q \right), \\[-10pt] \notag \end{align}
 \begin{align} \!\!\!\!{\rm{s}}{\rm{.t}}{\rm{.}}\quad\;\;\;\left[ {\begin{array}{c@{\quad}c}{\skew4\bar F {{\skew4\bar F }^T} - \skew4\bar F {{\skew4\bar H }^T}{{\rm{\Phi }}^T} - {\rm{\Phi }}\skew4\bar H {{\skew4\bar F }^T} - WQW} & {{\rm{\Phi }}\skew4\bar H {{\skew4\bar H }^T}}\\[4pt]{\skew4\bar H {{\skew4\bar H }^T}{\rm{\Phi }}} & { - \skew4\bar H {{\skew4\bar H }^T}}\end{array}} \right] &\prec 0,{\rm{\;}} \\[-10pt] \notag\end{align}
 \begin{align} \left[ {\begin{array}{c@{\quad}c}{PY + {Y^T}P} &{{{\left( {{\rm{\Phi }}{M_j}} \right)}^T} + PZ - {Y^T}}\\[4pt]{\left( {{\rm{\Phi }}{M_j}} \right) + {Z^T}P - Y} &{ - Z - {Z^T}}\end{array}} \right] &\prec 0;{\rm{\;\;\;\;}}\forall j \in \left[ {1,{n_p}} \right]{\rm{\;}} \\[-10pt] \notag\end{align}
 \begin{align} P &\succ 0, \\[8pt] \notag \end{align}
It follows that the set
 $\left( {{\rm{\Phi }},Q,P,Y,Z} \right)$
that solves Equation (66) also solves Equation (62) with
 $\left( {{\rm{\Phi }},Q,P} \right)$
, thus providing a practical way of solving the identification problem of stable dynamical systems governed by LPV matrices with polynomial structure.