Introduction
The mechanical properties of any material are highly correlated with its defect structure. Starting in the late 1950s,Reference Wilsdorf1in situ straining stages for use in transmission electron microscopes that could provide dynamic observations of dislocation motion in metals were developed. In the following years, research teams fabricated various transmission electron microscopy (TEM) straining holders, including some that could operate at low or high temperature. Since then, in situ TEM straining tests have been performed to study the behavior of dislocations and their interactions with other defects such as twins, grain boundaries (GBs), and interfaces.
After early load sensor integration developments,Reference Takeuchi, Ikeda, Ikeno and Furubayashi2,Reference Imura, Yukawa, Saka, Nohara, Harris and Sykes3 in situ TEM mechanical testing with quantitative load measurement expanded toward commercialization in the beginning of this century, including mechanical probing modes such as nanoindentation.Reference Warren, Shan, Asif, Stach, Morris and Minor4 These developments are particularly useful for studying size effects in materials, whereby mechanical properties and microstructure can be tuned by the physical dimensions (internal such as grain size or external such as film thickness) of materials.Reference Kraft, Gruber, Mönig and Weygand5–Reference Shan, Adesso, Cabot, Sherburne, Asif, Warren, Chrzan, Minor and Alivisatos7 At the micrometer or nanometer scale, the sample dimensions can be of the same order as the defects that carry the deformation, such as the length of a dislocation line or the thickness or spacing of twins. When this occurs, strong size effects can change the deformation mechanisms and the corresponding mechanical properties. Quantitative in situ TEM mechanical testing is therefore an ideal tool for studying the origin and principles of these size effects. This review provides an overview of available in situ TEM techniques and recent studies performed on dislocation behavior, dislocation/boundary interactions, deformation twinning, and GB-mediated plasticity. We also provide a critical discussion of the effects of size on different deformation mechanisms and the correlated mechanical properties of materials. Some of these mechanisms are summarized in Figure 1.
Schematic of various deformation mechanisms that can be studied by in situ transmission electron microscopy mechanical testing.

In situ TEM straining techniques
Various tools for mechanical testing by a transmission electron microscope that exist todayReference Legros8 are briefly detailed in this section. They span from simple motorized grips to elaborate mechanical testing units capable of returning values for load and displacement.
In classical tensile holders for TEM, samples are attached to a pair of jaws, and one side is slowly pulled by an electric motor located in a housing unit outside the TEM instrument. A rigid shaft ensures strain transmission at speeds ranging from 10 nm/s to 10 µm/s. This simple techniqueReference Couret, Crestou, Farenc, Molenat, Clément, Coujou and Caillard9 has various advantages because of its high versatility. Virtually any thin or thinned sample can be strained as soon as it is attached to a stretchable grid.Reference Castany and Legros10 Options for heating (up to 1200°C with a miniaturized furnace as shown in Figure 2a) or cooling (down to liquid He or, more often, liquid N2 temperatures) can be easily added. The very rigid strain transmission allows for the deformation of thin filmsReference Mompiou, Legros, Boé, Coulombier, Raskin and Pardoen12,Reference Gianola, Van Petegem, Legros, Brandstetter, Van Swygenhoven and Hemker13 or brittle alloys.Reference Molenat and Caillard14,Reference Guo, Yan, Wang, Tan, Zhang, Sui and Ma15 Incorporating a load cellReference M16 or double-tilt capabilityReference Pelissier and Debrenne17 can soften strain transmission and therefore be detrimental for controlling crack propagation in samples whose brittleness can be increased by smaller dimensions.
Examples of in situ transmission electron microscopy mechanical testing techniques: (a) Tip of a classical straining holder with high-temperature option, (b) sketch of the various types of straining configurations used in nanoindentation holders, (c) theta (θ) geometry for a push-to-pull microelectromechanical systems (MEMS) device, and (d) an electrically driven MEMS device for in situ measurement of load and strain. Adapted from Reference 11. © 2011 American Institute of Physics.
Other custom-made holders based on tensile actuation such as bendingReference Legros, Cabié and Gianola18 and pure shearReference Kubin, Lépinoux, Rabier, Veyssière, Fourdeux and Gikins19,Reference Lepinoux and Kubin20 holders can be found in the literature (for full reviews, see References Reference Legros8 and Reference Messerschmidt21). Heating holders can also be used to strain metallic films on hard substrates provided that the difference in coefficient of thermal expansion between the two materials is sufficiently high.Reference Legros, Cabié and Gianola18 Both plan-view and cross-sectional configurations have enabled insights into observations of metal–interface deformation mechanisms.Reference Legros, Hemker, Gouldstone, Suresh, Keller-Flaig and Arzt22,Reference Legros, Dehm, Arzt and Balk23
Nanoindentation holders are derived from the instrumented indentation technique that consists of measuring the force and displacement of a hard tip forced into a flat surface. This technique is used for measuring the hardness; the elastic modulus; and under certain conditions, the yield stress of a material.Reference Tsui, Oliver and Pharr24 The force and displacement are usually measured through a change in capacitance between a reference and a movable electrostatic plate attached to the tip.Reference Oliver and Pharr25–Reference Loubet, Georges, Marchesini and Meille27 In the 1990s, several holders were developed based on the accurate positioning capabilities of piezoelectric stacks and tubes,Reference Ohnishi, Kondo and Takayanagi28–Reference Wang, Poncharal and de Heer32 followed by nanoindentation tips holders initially used to deform metalsReference Stach, Freeman, Minor, Owen, Cumings, Wall, Chraska, Hull, Morris and Zettl33–Reference Minor, Morris and Stach38 and access plasticity mechanisms.Reference Minor, Lilleodden, Stach and Morris39,Reference Minor, Lilleodden, Jin, Stach, Chrzan and Morris40 A few companies (e.g., Hysitron and Nanofactory Instruments AB, although the latter ceased commercial activities in 2013 and was purchased by FEI) further implemented these holders with sensors to read applied forces.Reference Gianola and Eberl41–Reference Nafari, Danilov, Rödjegård, Enoksson, Olin and French43 Maximum loads accessible with such instruments are typically lower than 10 mN, and the noise floor is typically below 0.5 µN. Atomic force microscopy holders have also been developed for smaller force ranges.Reference Casillas, Ponce, Velázquez-Salazar and José-Yacamán44
To be indented, a TEM sample must have a specific geometry,Reference Minor, Morris and Stach45 such as a free half-space (Figure 2b) in front of the electron-transparent zone. The use of cylindrical nanopillars with a constant section deformed by flat punch tips is the easiest way to measure stress from load values.Reference Uchic, Dimiduk, Florando and Nix46–Reference Shan, Mishra, Asif, Warren and Minor48 Standard samples are currently shaped as nanopillars, wedges, or H-bars, as shown in Figure 2b.
Other tests are neither pure compression nor real indentation tests for which known approximations can apply.Reference Oliver and Pharr25 Finite element calculations therefore are needed to quantitatively determine the stress transmitted to the sampleReference Calvié, Joly-Pottuz, Esnouf, Clément, Garnier, Chevalier, Jorand, Malchère, Epicier and Masenelli-Varlot49–Reference De Knoop and Legros51 in tests such as wedge/wedge indentations (wedge indenters facilitate contact and prevent slipping). The contact of the tip with the sample generates strain gradients that also disrupt imaging conditions during the deformation. These disruptions can be partly overcome by capturing dynamic sequences in dark field,Reference Kiener and Minor47 by correcting the bending as the test progresses, or by using a damping region.Reference De Knoop and Legros51
Some holders are based on microelectromechanical systems (MEMS) that can be either passive (mounted on straining or nanoindenter holders) or active (with electrical input and output). Push-to-pull (or PtP) devices are passive MEMS devices that consist of a microfabricated Si platform that is elastically deformable in compression (using nanoindentation holders) and a pair of facing pads to which the sample to be pulled is attached. In Figure 2c, for the θ- shaped example (derived from References Reference Lu, Ganesan and Lou52 and Reference Lu, Peng, Ganesan, Huang and Lou53), the sample is located in the middle of the MEMS device, and compression on the outside of the structure provides tension in the central gap. In addition to the θ shape, other PtP geometriesReference Guo, Chen, Oh, Wang, Dejoie, Syed Asif, Warren, Shan, Wu and Minor54 can also maintain stable fields of view during actuation.
Stress–strain curves obtained with these techniques need to be corrected by removing the stiffness of the empty PtP. The dimensions and corresponding stiffness of the PtP can be adapted to the load range investigated, depending on the type of sample tested (fibers, nanowires, films). To avoid micromanipulation (harvesting, welding) of fragile samples,Reference Sharon, Zhang, Mompiou, Legros and Hemker55 the co-fabrication of self-supported nanocrystalline films with an elastic testing frame is also possible, either on simple structuresReference Mompiou, Legros, Boé, Coulombier, Raskin and Pardoen12 or on elaborate MEMS devices (Figure 2d), where the relative displacement of Si beams with known stiffness serves to calculate the applied load.Reference Pant, Allen, Zhu, Gall and Pierron11,Reference Han and Saif56,Reference Haque and Saif57 Relative displacements in the MEMS structure can be measured by TEM, but capacitance readouts can allow for direct access to the displacement of Si combs and, thus, to strain and load. Joining of linear actuators based on the thermal expansion of Si completes the design of these micromechanical testing machines that can be plugged into an electrical holder to perform monotonic or fatigue testing.Reference Pant, Allen, Zhu, Gall and Pierron11,Reference Espinosa, Bernal and Filleter58–Reference Espinosa, Zhu and Moldovan60 Finally, electrostatically actuated MEMS devices working in very low force ranges (1–100 nN) can be used to study nanojunctions or friction near the atomic level.Reference Ishida, Nakajima, Kakushima, Mita, Toshiyoshi and Fujita61–Reference Sato, Jalabert and Fujita63
Observations of grain boundary behavior
Grain boundary and dislocation interactions
Preventing dislocation motion by grain refinement has long been a practical way to engineer mechanical properties.Reference Hall64–Reference Nieh and Wadsworth66 Therefore, understanding the interactions of dislocations with GBs is of fundamental importance in tailoring the strength of polycrystalline materials. GBs and interfaces serve not only as barriers for dislocation motion, but also as sources for generating multiple dislocations or even as dislocation sinks.Reference Mompiou, Caillard, Legros and Mughrabi67 Traditional ex situ structure and property characterization gives only an ensemble viewpoint of the interaction between dislocations and GBs. On the contrary, in situ TEM mechanical testing offers a tool that can visualize the individual dynamic interactions between dislocations and other defects.
Observations of GBs acting as dislocation sources have been reported for various materials, including molybdenum and copper.Reference Robertson, Ferreira, Dehm, Hull and Stach68–Reference Hsiung, Schwartz and Nieh70 It has also been observed that the incorporation of dislocations into the boundary is highly related to misorientation between adjacent grains.Reference Kwiecinski and Wyrzykowski71,Reference Biyikli, Canadinc, Maier, Niendorf and Top72 As an example of the use of in situ TEM to study dislocation interactions with different grain misorientations, Ohmura et al.Reference Ohmura, Minor, Stach and Morris73 performed in situ TEM nanoindentation on Fe–0.4 wt% C tempered martensitic steel and studied the dynamic evolution of the dislocation pileup structure with both a high-angle GB and a low-angle GB (Figure 3). They observed that in the case of a low-angle GB, the dislocations induced by the indenter piled up against the boundary, as shown in Figure 3a (right side). A high density of dislocations was then suddenly emitted on the far side of the GB into the adjacent grain as a critical stress was reached during nanoindentation. Figure 3b shows the case of the high-angle GB, for which numerous dislocations were simply absorbed into the boundary, with no indication of pileup or strain transmission.
Interactions of a dislocation with (a) low-angle and (b) high-angle grain boundaries. A dislocation pileup was observed in the case of a low-angle grain boundary. The high-angle grain boundary absorbed dislocations. Reproduced with permission from Reference 73. © 1953 Elsevier.
As illustrated by the preceding examples, in situ TEM experiments provide a window into the dynamic interactions between dislocations and GBs with known structural features. Taken together, dislocation–GB interactions are complex processes, and the before and after conditions for a given interaction provides valuable insights into dislocation plasticity mechanisms. Evaluating the strength of a GB as an obstacle requires careful analysis of grain orientations and dislocation character.Reference Kacher, Liu and Robertson74 Simple criteria for dislocation crossing can be found in ideal cases such as dislocation–nanotwin interactions,Reference Chassagne, Legros and Rodney75 but they can be difficult to predict a priori for any general boundary. The interaction between dislocations and GBs is also sensitive to the chemical composition, which not only changes the boundary energy, but also increases barriers to dislocation motion.Reference Hosson, Soer, Minor, Shan, Stach, Syed Asif and Warren76 Because most earlier in situ TEM studies on this subject were largely phenomenological, more systematic in situ TEM tests with quantitative stress measurements are required to investigate the details of dislocation–boundary interactions.
Grain boundary motion
When the mean free path of dislocations is further impeded by GBs, which occurs in nanocrystals, a very large increase in mechanical resistance is observed.Reference Meyers, Mishra and Benson77 At the smallest scales (usually in the range of several to tens of nanometers), in situ TEM has shown that metallic polycrystals deform through alternative, GB-based plasticity mechanisms that can occur at lower temperatures and more rapidly than anticipated from macroscopic values. This is the case for stress-assisted grain growthReference Rupert, Gianola, Gan and Hemker78 and rotation,Reference Gianola, Van Petegem, Legros, Brandstetter, Van Swygenhoven and Hemker13,Reference Legros, Gianola and Hemker79 for which diffusion coefficients seem to be close to those of the liquid phase, even at room or moderate temperatures.Reference Casillas, Ponce, Velázquez-Salazar and José-Yacamán44
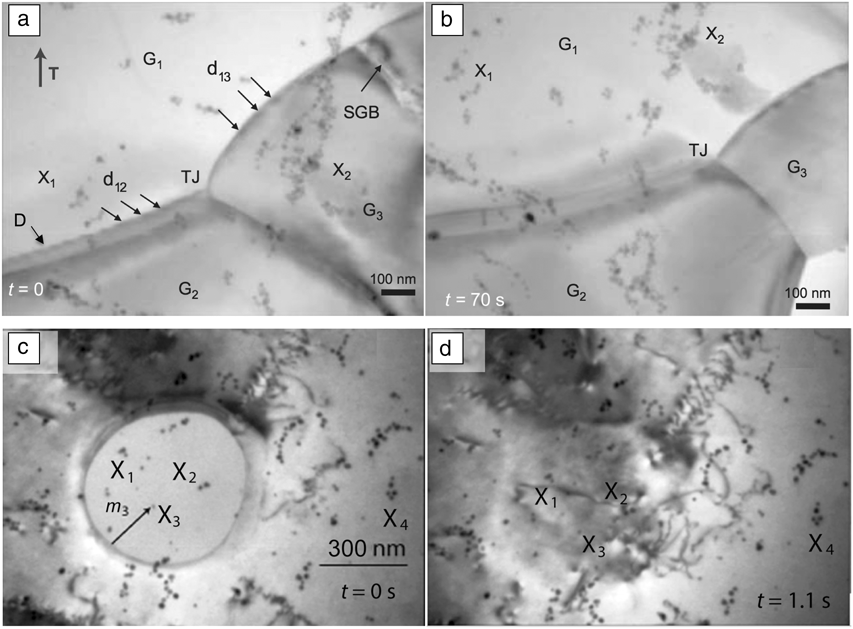
Among these mechanisms, shear-migration coupling has recently been the focus of many theoretical and experimental studies. In contrast to dislocation-based plasticity, the shear produced by a moving GB can result in different values, characterized by a coupling factor parameter called β. Recent results obtained by in situ TEM of ultrafine-grained aluminum show that many deformation modes are activated, including shear-migration coupling.Reference Mompiou, Legros and Caillard80,Reference Cahn, Mishin and Suzuki81 The coupling factor β can be measured experimentally using image correlation analysis, as in Figure 4a–b, where nanoparticles on the surface serve as fixed references. The returned values can be compared with the predictions of models such as that of Cahn and Mishin,Reference Cahn, Mishin and Suzuki81 and although numerous statistical data are still missing, β sometimes appears smaller than predicted. One reason for this discrepancy could lie in the atomic-scale mechanisms that guide the migration of GBs. The Cahn and Mishin model assumes the motion of intrinsic GB dislocations (therefore directly related to the GB misorientation), whereas Rae and Smith insist on the role of step propagation.Reference Rae and Smith82 When no stress is involved, GBs can move without inducing any strain (β = 0), as in Figure 4c–d. High-resolution imaging of bicrystals shows that steps decorate GBs and that the motion of imperfect steps could result in the shear-associated migration of GBs.Reference Rajabzadeh, Legros, Combe, Mompiou and Molodov83 Recent simulations showed that step dislocations (disconnections) are probably the basic mechanism leading to GB migration.Reference Rajabzadeh, Mompiou, Legros and Combe84 These disconnections (marked D in Figure 4a) are found in non-ideal, far-from-equilibrium GBs, largely present in nanocrystals, and can be created from interactions between lattice dislocations and GBs.Reference Rajabzadeh, Legros, Combe, Mompiou and Molodov83,Reference Rajabzadeh, Mompiou, Lartigue-Korinek, Combe, Legros and Molodov85 They are also evidenced in grain rotation.Reference Mompiou, Legros, Radetic, Dahmen, Gianola and Hemker86
Stress-related grain boundary (GB) motion. X1–4 represent fixed markers (surface nanoparticles). (a–b) Stress-induced GB motion in ultrafine Al at 350°C. GBs denoted d12 and d13 move toward the lower right of the image. (c–d) Grain annihilation in Au at 300°C. In the absence of stress, this GB motion does not engender any strain. (a–b) Reproduced with permission from Reference 83. © 2013 Taylor & Francis. (c–d) Reproduced with permission from Reference 86. © 2012 Elsevier. Note: D, step dislocations (disconnections); G1, grain 1; G2, grain 2; G3, grain 3; TJ, triple junction; SGB, subgrain boundary; t, time; m 3, migration distance to X3; T, straining axis.
Observations of size-related dislocation slip
Intrinsically, the mechanical properties of a metal can be directly related to the physical dimensions of a single defect. For instance, the yield strength of a single crystal is correlated with the critical resolved shear stress τCRSS = Gb/L, where L is the length of the dislocation, G the shear modulus and b the Burgers vector. This phenomenon becomes quite important as the physical dimensions of the material decrease to the same order as the size of the dislocations. By combining nanofabrication techniques and quantitative in situ TEM nanomechanical testing, the effect of size on dislocation behavior and its corresponding impact on the mechanical properties of small samples have been broadly studied in fcc-, bcc-, and hcp-structured materials.Reference Wang, Teng, Liu, Hirata, Ma and Zhang87,Reference Yu, Sun, Morris and Minor88
In fcc materials, such as Ni and Cu, both in situ TEM nanocompression and nanotension experimental results suggest that dislocation multiplication can be constrained by crystal size; dislocations can easily slip out of the sample through the crystal surfaces without any multiplication events. Shan et al. obtained direct evidence for such exhaustion phenomena in Ni nanopillars.Reference Shan, Mishra, Syed Asif, Warren and Minor89 Kiener and MinorReference Kiener and Minor90 carried out quantitative in situ TEM tension experiments on Cu and showed that a decrease in dislocation density was associated with hardening of the material, as shown in Figure 5a. They also emphasized the role of sources to control the flow stress and, in some cases, to balance the loss of dislocations.Reference Kiener and Minor47,Reference Oh, Legros, Kiener and Dehm91
Dislocation behaviors in fcc, bcc, and hcp materials studied through in situ transmission electron microscopy mechanical testing. Dislocation starvation was observed in both (a) fccReference Kiener and Minor90 and (b) bcc materials. Generally speaking, dislocation starvation refers to the phenomenon in which the dislocation density dramatically decreases to an extremely low value. (a) The dislocation density (defects can be seen as bright features in the upper row of dark-field images), as denoted by the white diamond symbols, and the values on the right-hand axis of the graph reduce by an order of magnitude. Correspondingly, the deformation characteristics become more stochastic as the defect density decreases. (b) (i–vii) Representation of the trend of decreasing dislocation density in a bcc Mo fiber during tension. Dislocation multiplication was also observed in the bcc material before the escape of dislocations from the surface.Reference Yu, Qi, Mishra, Li and Minor92 (c) Multiple slip has occurred in smaller hcp Mg samples, resulting in better ductility. Note: g, diffraction vector.
In bcc materials, observations of dynamic dislocation activities were achieved by straining Mo fibers in situ in tension using a PtP MEMS device. As shown in Figure 5b, dislocation multiplication was observed before the dislocations were annihilated at the surface. The linear elastic stage of the mechanical curve is not affected until the annihilation of the dislocation source and the subsequent occurrence of a dramatic plastic instability. Similar to fcc materials, multiple slip systems might have been activated after the primary slip system was exhausted.
The activation of multiple slip systems in small samples facilitates arbitrary changes in shape. In materials with high deformation anisotropy such as hcp-structured materials, this effect was found, by in situ TEM nanomechanical testing, to be enabled through size reduction. For example, in single-crystal Mg, it was observed that multiple dislocation slip systems were activated once a critical crystal size (and hence a critical strength) was reached. As shown in Figure 5c, even in orientations where basal slip would dominate the deformation at a larger scale,Reference Yu, Qi, Mishra, Li and Minor92 smaller crystals deformed at higher stresses, where the interaction between different slip systems significantly enhanced the strain hardening and the ductility of the material.
Observations of deformation twinning
Twinning deformation can involve the cooperation of different types of dislocations. Therefore, compared with perfect dislocation glide, plasticity based on twinning is more difficult to study, because it occurs as a collective mechanism, and its origin and evolution in space and time remain puzzling.Reference Kraft93In situ TEM nanomechanical testing has recently provided new insights into deformation twinning by revealing the nucleation of twins and their propagation.
The nucleation and growth of deformation twins have been directly observed using
in situ TEM mechanical testing in both Mg and Mg alloys. Yu et al.Reference Yu, Qi, Chen, Mishra, Li and Minor94 and Ye et al.Reference Ye, Mishra, Sachdev and Minor95 reported the formation of deformation twins in submicron single-crystal Mg
and a Mg alloy in compression. In both studies, twinning was observed to nucleate
from a corner at the contact surface. Significant dislocation activity was observed
during twin growth, specifically across the twin boundary. In Mg,  $\left( {10\bar 12} \right)$ twins were also studied by in situ TEM
nanotension experiments. Liu et al.Reference Liu, Wang, Li, Lu, Zhang, Shan, Li, Jia, Sun and Ma96 reported the formation of a
 $\left( {10\bar 12} \right)$ twin from the bottom of the sample by pulling a Mg single crystal
along the [0001] direction and further compressing the sample along the
 $\left[ {1\bar 100} \right]$ direction, as shown in Figure 6a. Yu et al. also performed in situ TEM nanotension tests on
single-crystal Mg bars oriented along [0001], but instead of a single twin, they
observed the formation of many nanotwins across the entire sample length (Figure 6b).Reference Yu, Qi, Chen, Mishra, Li and Minor94 Similar nanotwinned structures were observed in in situ TEM
nanobending tests as well, in which case the formation of the nanostructured twin
occurred right in front of the crack tip. The discrepancy in the results between Yu
et al. and Liu et al. demonstrates that subtle factors such as surface roughness and
dilute compositional differences can often influence deformation in small-scale
tests.
Deformation twinning behaviors studied through in situ
transmission electron microscopy (TEM) mechanical testing. (a) Formation
of a  $\left\{ {10\bar 12} \right\}$ twin in a nanocompression test on single-crystal Mg
oriented along
 $\left[ {1\bar 100} \right]$.Reference Liu, Wang, Li, Lu, Zhang, Shan, Li, Jia, Sun and Ma96 Dark-field TEM images showing the pillar (left) before and
(right) after loading. (b) Formation of nanotwins in nanotensile and
bending tests (lower right inset). The upper left inset image is a
typical high-resolution TEM image showing the atomic structure of the
nanotwins. Note: BD, beam direction. Reproduced with permission from
Reference 93. © 2010 Nature Publishing Group.
The critical stress for compression twin nucleation in pure Mg was found to be approximately 750 MPa in Yu et al.’s study.Reference Yu, Qi, Chen, Mishra, Li and Minor94 The critical stress for the nucleation of an extension twin was about 800 MPa on average in Yu et al.’s tensile testsReference Yu, Qi, Chen, Mishra, Li and Minor94 and about 1.2 GPa in Ye et al.’s compression tests.Reference Ye, Mishra, Sachdev and Minor95 The same value varied between about 500 Mpa and 800 MPa in Liu et al.’s case.Reference Liu, Wang, Li, Lu, Zhang, Shan, Li, Jia, Sun and Ma96 This wide variation in quantitative data demonstrates the stochastic nature of small-scale mechanical testing, as well as the significant size effects associated with the twinning mechanism. In Yu et al.’s work,Reference Yu, Qi, Chen, Mishra, Li and Minor94 significant strain hardening was obtained after the formation of a nanotwinned structure, presumably resulting from the high density of twin boundaries, which serve as barriers to further dislocation motion. The maximum flow stress then increased to about 1.2 GPa, ∼400 MPa higher than that in Liu et al.’s study.Reference Liu, Wang, Li, Lu, Zhang, Shan, Li, Jia, Sun and Ma96
In situ TEM nanomechanical testing provides direct insights into deformation twinning, the related mechanical properties, and their relation to crystal size. However, the observation of very fast twin nucleation events remains a challenge. In addition to future improvements in sample preparation, higher time and spatial resolutions are needed to understand the complete picture of twin nucleation.
Summary and outlook
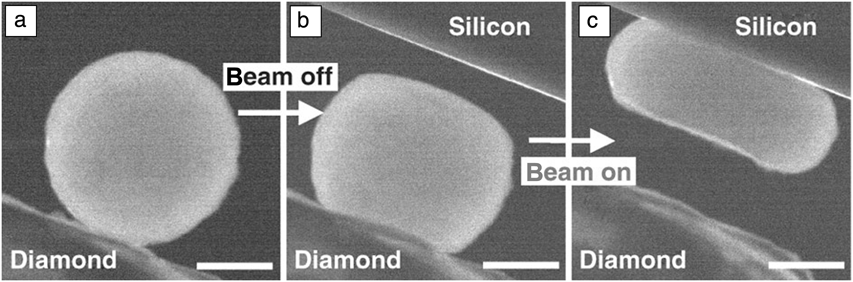
Several examples of dislocation plasticity, twinning, and GB mechanisms observed by in situ TEM mechanical testing were described, where the mechanisms of interest are directly related to the mechanical properties. However, in situ TEM mechanical testing can also be used to interrogate properties and mechanisms in materials beyond defect interactions, such as phase transformations,Reference Ye, Mishra, Pelton and Minor97,Reference Guo, Wang, Deng, Oh, Syed Asif, Warren, Shan, Wu and Minor98 ultrafast electromechanical quenching,Reference Zhong, Wang, Sheng, Zhang and Mao99 and electron-beam irradiation effectsReference Zheng, Wang, Cheng, Yue, Han, Zhang, Shan, Mao, Ye, Yin and Ma100 (see, for example, Figure 7). As in situ mechanical testing becomes more sophisticated, experiments will extend beyond the simple observation of mechanisms to measurements of key mechanical parameters.
Example of the use of in situ nanomechanical testing to probe electron irradiation effects in silica nanoparticles. (a) The silica nanoparticle prior to compression. Two consecutive compression tests were performed: (b) first with the electron beam off and (c) then with it on. The silica particle was found to be much softer under electron-beam illumination. Scale marker is 200 nm. Reproduced with permission from Reference 100. © 2010 Nature Publishing Group.
Recent advances in TEM sample preparation and imaging techniques have the potential to make observations clearer and measurements more precise. For example, direct measurements of strain can now be accomplished using imaging techniques such as holographic strain measurement at small scalesReference Hÿtch and Minor101 or automated crystalline indexing tools.Reference Sharon, Zhang, Mompiou, Legros and Hemker55,Reference Rauch, Veron, Portillo, Bultreys, Maniette and Nicolopoulos102 Sample preparation will continue to improve, as a result of new sample handling and microfabrication technologies. Faster direct electron detectors working at the millisecond time scale can capture faster mechanismsReference Stach, Zakharov, Rivas, Longo, Lent, Gubbens and Czarnik103 and/or collect more information.Reference Ozdol, Gammer, Sarahan and Minor104 Faster experiments can also enable clearer imaging of deformation, as stability during contact is always an issue. Of course, capturing ultrafast events such as dislocation nucleation in a perfect crystal might require ultrafast technologiesReference LaGrange, Campbell, Reed, Taheri, Pesavento, Kim and Browning105 and remains a challenge.
In the future, a critical area for research will be the adaptation of in situ TEM mechanical testing to environmental conditions relevant to mechanical behavior. Whereas high-temperature straining has long been widely available, adapting quantitative techniques such as indentation to work at low or high temperatures has been more difficult. Beyond simply high-temperature environments, it is critical to study environmentally assisted deformation mechanisms such as stress-corrosion cracking. Many outstanding questions remain concerning the mechanisms by which interfacial oxides form in cracks and contribute to the dramatic reduction in fracture toughness. The ability to examine, with atomic resolution, the structure and chemistry of these films and the location of crack initiation using in situ TEM nanomechanical testing will lead to fundamentally new insights in this important field.
In summary, in situ mechanical testing in a transmission electron microscope is uniquely suited for investigating the origins of both strength and ductility in structural materials and has proven to be advantageous for directly observing and measuring plastic deformation due to dislocation plasticity and twinning. New technological developments in the field promise to enable greater insights into the mechanics of an even wider range of materials in a wider range of environments.
Acknowledgments
A.M.M. was supported by the Molecular Foundry at Lawrence Berkeley National Laboratory, which is supported by the US Department of Energy under Contract DE-AC02-05CH11231. M.L. was supported by the French National Research Agency under the “Investissement d’Avenir” MIMETIS program (reference ANR-10-EQPX-38-01).