1 Introduction
Fluid–structure interactions (FSIs) are omnipresent in engineering applications (Paidoussis Reference Paidoussis1998, Reference Paidoussis2004), e.g. in long pipes carrying fluids, in heat exchangers, in wind turbines, in gas turbines, in oil platforms and long risers for deep-sea drilling. Vortex-induced vibrations (VIVs), in particular, are a special class of FSIs, which involve a resonance condition. They are caused in external flows past bluff bodies when the frequency of the shed vortices from the body is close to the natural frequency of the structure (Williamson & Govardhan Reference Williamson and Govardhan2004). A prototypical example is flow past a circular cylinder that involves the so-called von Kármán shedding with a non-dimensional frequency (Strouhal number) of about 0.2. If the cylinder is elastically mounted, its resulting motion is caused by the lift force and the drag force in the crossflow and streamwise directions, respectively, and can reach about
 $1D$
and
 $0.1D$
in amplitude, where
 $D$
is the cylinder diameter. Clearly, for large structures like a long riser in deep-sea drilling, this is a very large periodic motion that will lead to fatigue and hence a short life time for the structure.
Using traditional computational fluid dynamics (CFD) methods we can predict accurately VIVs (Evangelinos & Karniadakis Reference Evangelinos and Karniadakis1999), both the flow field and the structure’s motion. However, CFD simulations are limited to relatively low Reynolds numbers and simple geometric configurations and involve the generation of elaborate and moving grids that may need to be updated frequently. Moreover, some of the structural characteristics, e.g. damping, are not readily available and hence separate experiments are required to obtain such quantities involved in CFD modelling of FSIs. Solving inverse coupled CFD problems, however, is typically computationally prohibitive and often requires the solution of ill-posed problems. For the vibrating cylinder problem, in particular, we may have available data for the motion of the cylinder or some limited noisy measurements of the velocity field in the wake or some flow visualizations obtained by injecting dye upstream for liquid flows or smoke for air flows. Of interest is to determine the forces on the body that will determine the dynamic motion and possibly deformation of the body, and ultimately its fatigue life for safety evaluations.
In this work, we take a different approach, building on our previous work on physics-informed deep learning (Raissi, Perdikaris & Karniadakis Reference Raissi, Perdikaris and Karniadakis2017a ,Reference Raissi, Perdikaris and Karniadakis b ) and extending this concept to coupled multi-physics problems. Instead of solving the fluid mechanics equations and the dynamic equation for the motion of the structure using numerical discretization, we learn the velocity and pressure fields and the structure’s motion using coupled deep neural networks with scattered data in space–time as input. The governing equations are employed as part of the loss function and play the role of regularization mechanisms. Hence, experimental input that may be noisy and at scattered spatio-temporal locations can be readily utilized in this new framework. Moreover, as we have shown in previous work, physics-informed neural networks are particularly effective in solving inverse and data assimilation problems in addition to leveraging and discovering the hidden physics of coupled multi-physics problems (Raissi Reference Raissi2018a ).
The approach presented in the current work exploits the strengths of machine learning algorithm and of scientific computing applied to conservation laws. In this new setting, we did not need to specify the geometry or the boundary and initial conditions as we usually do with the traditional numerical approaches. Moreover, solving the inverse problem using conventional numerical methods (e.g. finite differences, finite elements, finite volumes, spectral methods, etc.) would have been prohibitively expensive as the corresponding optimization problems involve some form of ‘parametrized’ initial and boundary conditions, appropriate loss functions and multiple runs of the conventional computational solvers. In this setting, one could easily end up with very high-dimensional optimization problems that require either back-propagating through the computational solvers (Chen et al. Reference Chen, Rubanova, Bettencourt and Duvenaud2018) or ‘Bayesian’ optimization techniques (Shahriari et al. Reference Shahriari, Swersky, Wang, Adams and De Freitas2016) for the surrogate models (e.g. Gaussian processes). If the geometry is further assumed to be unknown (as is the case in this work), then its parametrization requires grid regeneration, which makes the approach almost impractical.
This work aims to demonstrate feasibility and accuracy of a new approach that involves Navier–Stokes informed deep neural network inference, and is part of our ongoing development of physics-informed learning machines (Raissi et al. Reference Raissi, Perdikaris and Karniadakis2017a ,Reference Raissi, Perdikaris and Karniadakis b ). The first glimpses of promise for exploiting structured prior information to construct data-efficient and physics-informed learning machines have already been showcased in the recent studies of Owhadi (Reference Owhadi2015) and Raissi, Perdikaris & Karniadakis (Reference Raissi, Perdikaris and Karniadakis2017c ,Reference Raissi, Perdikaris and Karniadakis d ). There, the authors employed Gaussian process regression (Rasmussen & Williams Reference Rasmussen and Williams2006) to devise functional representations that are tailored to a given linear operator, and were able to accurately infer solutions and provide uncertainty estimates for several prototype problems in mathematical physics. Extensions to nonlinear problems were proposed in subsequent studies by Raissi & Karniadakis (Reference Raissi and Karniadakis2018) and Raissi, Perdikaris & Karniadakis (Reference Raissi, Perdikaris and Karniadakis2018a ) in the context of both inference and systems identification. Despite the flexibility and mathematical elegance of Gaussian processes in encoding prior information, the treatment of nonlinear problems introduces two important limitations. First, in Raissi & Karniadakis (Reference Raissi and Karniadakis2018) and Raissi et al. (Reference Raissi, Perdikaris and Karniadakis2018a ), a local linearization in time of the nonlinear terms is involved, thus limiting the applicability of the proposed methods to discrete-time domains and possibly compromising the accuracy of their predictions in strongly nonlinear regimes. Second, the Bayesian nature of Gaussian process regression requires certain prior assumptions that may limit the representation capacity of the model and give rise to robustness/brittleness issues, especially for nonlinear problems (Owhadi et al. Reference Owhadi, Scovel and Sullivan2015), although this may be overcome by hybrid neural networks/Gaussian process algorithms (Pang, Yang & Karniadakis Reference Pang, Yang and Karniadakis2018).
Physics-informed deep learning (Raissi et al. Reference Raissi, Perdikaris and Karniadakis2017a ,Reference Raissi, Perdikaris and Karniadakis b ; Raissi Reference Raissi2018a ) takes a different approach by employing deep neural networks and leveraging their well-known capability as universal function approximators (Hornik, Stinchcombe & White Reference Hornik, Stinchcombe and White1989). In this setting, one can directly tackle nonlinear problems without the need for committing to any prior assumptions, linearization or local time-stepping. Physics-informed neural networks exploit recent developments in automatic differentiation (Baydin et al. Reference Baydin, Pearlmutter, Radul and Siskind2018) – one of the most useful but perhaps under-utilized techniques in scientific computing – to differentiate neural networks with respect to their input coordinates and model parameters to leverage the underlying physics of the problem. Such neural networks are constrained to respect any symmetries, invariances or conservation principles originating from the physical laws that govern the observed data, as modelled by general time-dependent and nonlinear partial differential equations. This simple yet powerful construction allows us to tackle a wide range of problems in computational science and introduces a potentially transformative technology leading to the development of new data-efficient and physics-informed learning machines, new classes of numerical solvers for partial differential equations as well as new data-driven approaches for model inversion and systems identification.
Here, we should underline an important distinction between this line of work and existing approaches (see e.g. Beidokhti & Malek Reference Beidokhti and Malek2009) in the literature that elaborate on the use of machine learning in computational physics. The term physics-informed machine learning has been also recently used by Wang et al. (Reference Wang, Wu, Ling, Iaccarino and Xiao2017) in the context of turbulence modelling. Other examples of machine learning approaches for predictive modelling of physical systems include Rico-Martinez, Anderson & Kevrekidis (Reference Rico-Martinez, Anderson and Kevrekidis1994), Milano & Koumoutsakos (Reference Milano and Koumoutsakos2002), Duraisamy, Zhang & Singh (Reference Duraisamy, Zhang and Singh2015), Ling & Templeton (Reference Ling and Templeton2015), Zhang & Duraisamy (Reference Zhang and Duraisamy2015), Ling, Kurzawski & Templeton (Reference Ling, Kurzawski and Templeton2016), Parish & Duraisamy (Reference Parish and Duraisamy2016), Perdikaris, Venturi & Karniadakis (Reference Perdikaris, Venturi and Karniadakis2016), Hagge et al. (Reference Hagge, Stinis, Yeung and Tartakovsky2017), Tripathy & Bilionis (Reference Tripathy and Bilionis2018), Vlachas et al. (Reference Vlachas, Byeon, Wan, Sapsis and Koumoutsakos2018) and Zhu & Zabaras (Reference Zhu and Zabaras2018). All these approaches employ machine learning algorithms like support vector machines, random forests, Gaussian processes and feed-forward/convolutional/recurrent neural networks merely as black-box tools. As described above, our goal here is to open the black box, understand the mechanisms inside it and utilize them to develop new methods and tools that could potentially lead to new machine learning models, novel regularization procedures and efficient and robust inference techniques. In particular, opening the black box involves understanding and appreciating the key role played by automatic differentiation within the deep learning field. Automatic differentiation in general, and the back-propagation algorithm in particular, is currently the dominant approach for training deep models by taking their derivatives with respect to the parameters (e.g. weights and biases) of the models. Here, we use the exact same automatic differentiation techniques, employed by the deep learning field, to physics-inform neural networks by taking their derivatives with respect to their input coordinates (i.e. space and time), where the physics is described by partial differential equations. To this end, the proposed work draws inspiration from the early contributions of Psichogios & Ungar (Reference Psichogios and Ungar1992), Lagaris, Likas & Fotiadis (Reference Lagaris, Likas and Fotiadis1998) and Beidokhti & Malek (Reference Beidokhti and Malek2009), as well as the contemporary works of Mallat (Reference Mallat2016), Hirn, Mallat & Poilvert (Reference Hirn, Mallat and Poilvert2017), Kondor (Reference Kondor2018) and Kondor & Trivedi (Reference Kondor and Trivedi2018).
The focus of this paper is FSIs in general and VIVs in particular. Specifically, we are interested in the prediction of the fluid’s lift and drag forces on a structure given some limited and scattered information on the velocity field or simply snapshots of dye visualization. This is a data assimilation problem that is notoriously difficult to solve using standard CFD methods, especially since no initial conditions are specified for the algorithm, the training domain is small leading to the well-known numerical artifacts and no information is provided for the pressure. An even greater challenge is to infer the lift and drag forces given some dye or smoke visualizations of the flow field. Here we employ Navier–Stokes informed deep neural networks that are extended to encode the structure’s dynamic motion equation. The paper is organized as follows. In the next section, we give an overview of the proposed algorithm, set up the problem and describe the synthetic data that we generate to test the performance of the method. In § 3, we present our results for three benchmark cases. (1) We start with a pedagogical example and assume that we know the forces acting on the body while seeking to obtain the structure’s motion in addition to its properties without explicitly solving the equation for displacement. (2) We then consider a case where we know the velocity field and the structural motion at some scattered data points in space–time. In this case, we try to infer the lift and drag forces while learning the pressure field as well as the entire velocity field in addition to the structure’s dynamic motion. (3) We then consider an even more interesting case where we only assume the availability of concentration data in space–time. From such information we obtain all components of the flow fields and the structure’s motion as well as lift and drag forces. We conclude with a short summary.
2 Problem set-up and solution methodology
We begin by considering the prototype VIV problem of flow past a circular cylinder. The fluid motion is governed by the incompressible Navier–Stokes equations while the dynamics of the structure is described in a general form involving displacement, velocity and acceleration terms. In particular, let us consider the two-dimensional version of flow over a flexible cable, i.e. an elastically mounted cylinder (Bourguet, Karniadakis & Triantafyllou Reference Bourguet, Karniadakis and Triantafyllou2011). The two-dimensional problem contains most of the salient features of the three-dimensional case and consequently it is relatively straightforward to generalize the proposed framework to the flexible cylinder/cable problem. In two dimensions, the physical model of the cable reduces to a mass–spring–damper system. There are two directions of motion for the cylinder: the streamwise (i.e.
 $x$
) direction and the crossflow (i.e.
 $y$
) direction. In this work, we assume that the cylinder can only move in the crossflow (i.e.
 $y$
) direction; we concentrate on crossflow vibrations since this is the primary VIV direction. However, it is a simple extension to study cases where the cylinder is free to move in both streamwise and crossflow directions.
2.1 A pedagogical example
The cylinder displacement is defined by the variable
 $\unicode[STIX]{x1D702}$
corresponding to the crossflow motion. The equation of motion for the cylinder is then given by
 $$\begin{eqnarray}\unicode[STIX]{x1D70C}\unicode[STIX]{x1D702}_{tt}+b\unicode[STIX]{x1D702}_{t}+k\unicode[STIX]{x1D702}=f_{L},\end{eqnarray}$$
where
 $\unicode[STIX]{x1D70C}$
,
 $b$
and
 $k$
are the mass, damping and stiffness parameters, respectively. The fluid lift force on the structure is denoted by
 $f_{L}$
. The mass
 $\unicode[STIX]{x1D70C}$
of the cylinder is usually a known quantity; however, the damping
 $b$
and the stiffness
 $k$
parameters are often unknown in practice. In the current work, we put forth a deep learning approach for estimating these parameters from measurements. We start by assuming that we have access to the input–output data
 $\{t^{n},\unicode[STIX]{x1D702}^{n}\}\text{}_{n=1}^{N}$
and
 $\{t^{n},f_{L}^{n}\}\text{}_{n=1}^{N}$
on the displacement
 $\unicode[STIX]{x1D702}(t)$
and the lift force
 $f_{L}(t)$
functions, respectively. Having access to direct measurements of the forces exerted by the fluid on the structure is obviously a strong assumption. However, we start with this simpler but pedagogical case and we will relax this assumption later in this section.
Inspired by recent developments in physics-informed deep learning (Raissi et al.
Reference Raissi, Perdikaris and Karniadakis2017a
,Reference Raissi, Perdikaris and Karniadakis
b
) and deep hidden physics models (Raissi Reference Raissi2018a
), we propose to approximate the unknown function
 $\unicode[STIX]{x1D702}$
by a deep neural network. This choice is motivated by modern techniques for solving forward and inverse problems involving partial differential equations, where the unknown solution is approximated either by a neural network (Raissi et al.
Reference Raissi, Perdikaris and Karniadakis2017a
,Reference Raissi, Perdikaris and Karniadakis
b
; Raissi Reference Raissi2018a
,Reference Raissi
b
; Raissi, Perdikaris & Karniadakis Reference Raissi, Perdikaris and Karniadakis2018b
) or by a Gaussian process (Raissi & Karniadakis Reference Raissi and Karniadakis2016; Perdikaris et al.
Reference Perdikaris, Raissi, Damianou, Lawrence and Karniadakis2017; Raissi Reference Raissi2017; Raissi et al.
Reference Raissi, Perdikaris and Karniadakis2017c
,Reference Raissi, Perdikaris and Karniadakis
d
, Reference Raissi, Perdikaris and Karniadakis2018a
; Raissi & Karniadakis Reference Raissi and Karniadakis2018). Moreover, placing a prior on the solution is fully justified by similar approaches pursued in past centuries by classical methods of solving partial differential equations such as finite elements, finite differences or spectral methods, where one would expand the unknown solution in terms of an appropriate set of basis functions. Approximating the unknown function
 $\unicode[STIX]{x1D702}$
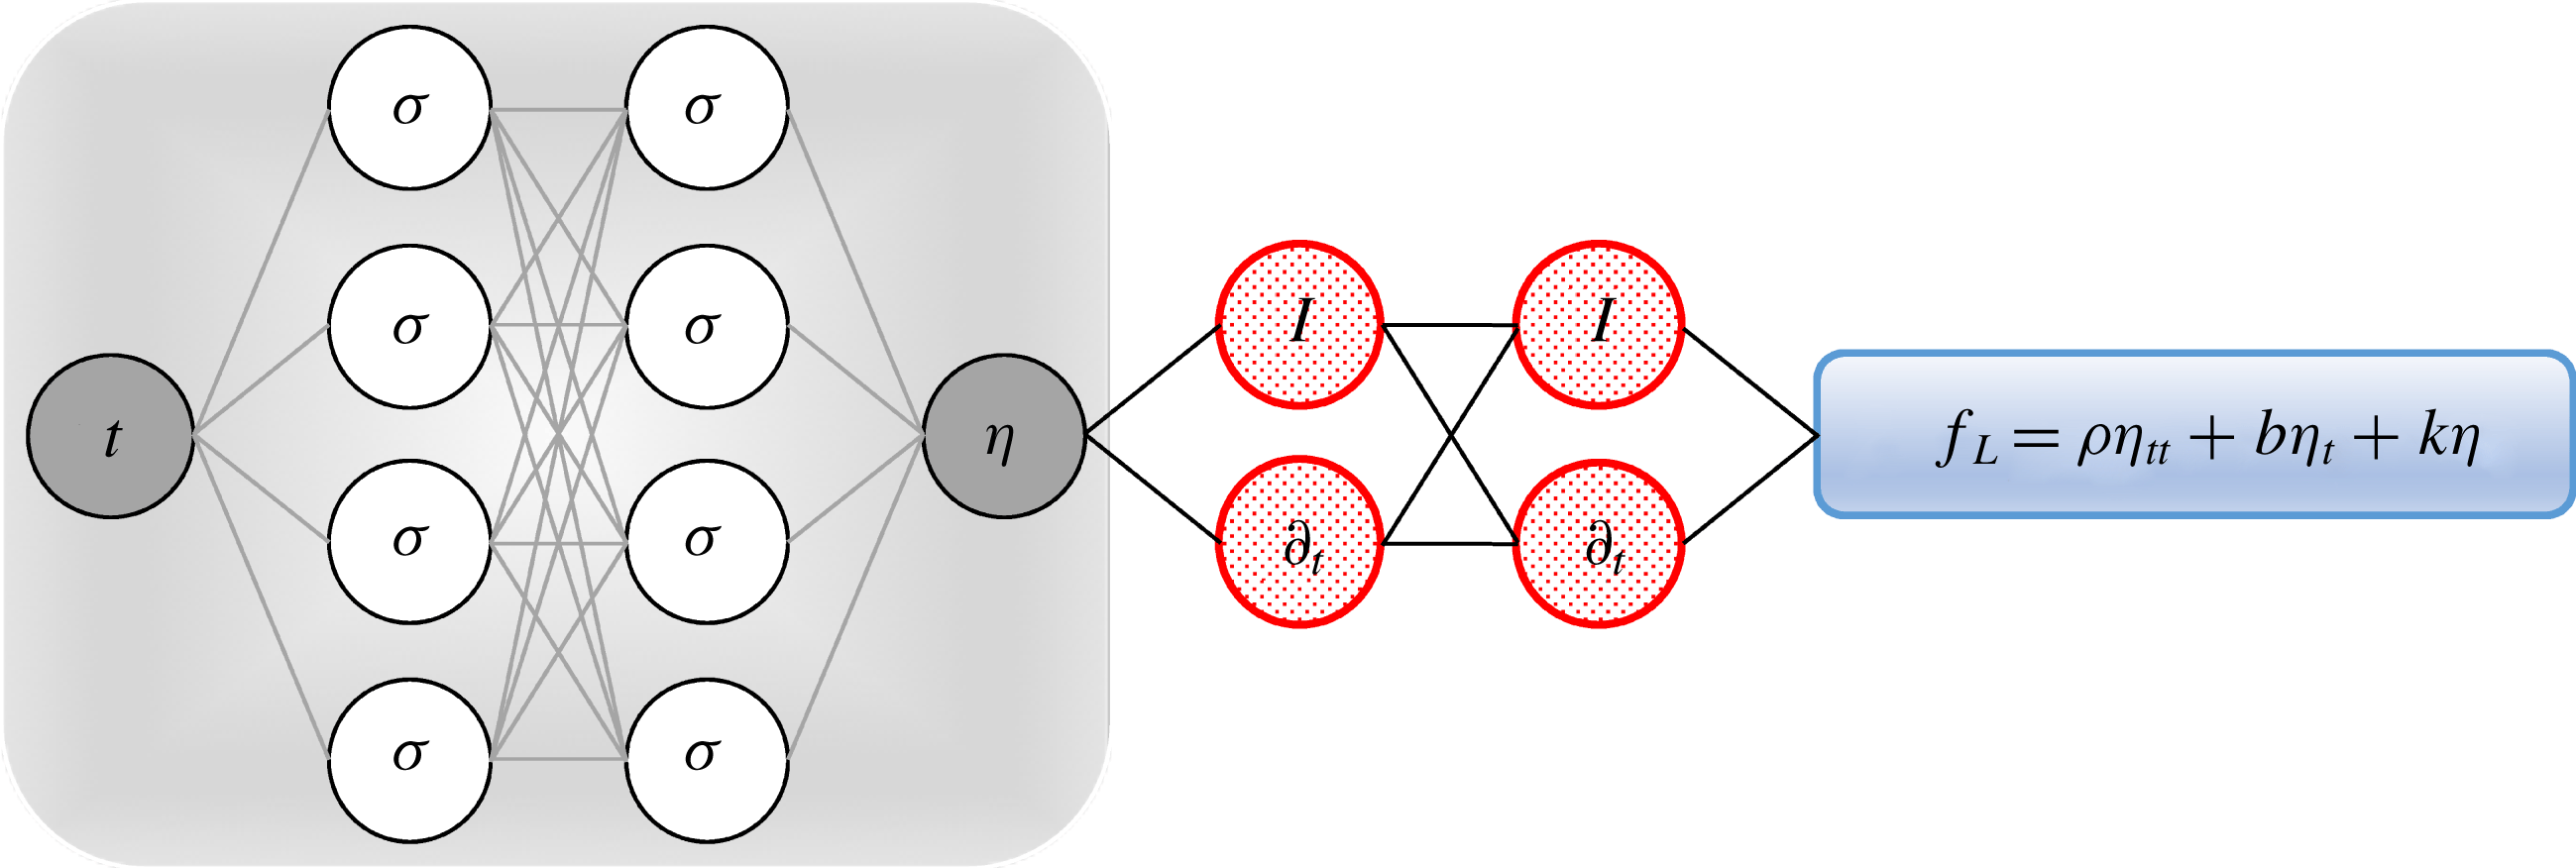
by a deep neural network and using (2.1) allow us to obtain the following physics-informed neural network (see figure 1):
 $$\begin{eqnarray}f_{L}:=\unicode[STIX]{x1D70C}\unicode[STIX]{x1D702}_{tt}+b\unicode[STIX]{x1D702}_{t}+k\unicode[STIX]{x1D702}.\end{eqnarray}$$
It is worth noting that the damping
 $b$
and the stiffness
 $k$
parameters turn into parameters of the resulting physics-informed neural network
 $f_{L}$
. We obtain the required derivatives to compute the residual network
 $f_{L}$
by applying the chain rule for differentiating compositions of functions using automatic differentiation (Baydin et al.
Reference Baydin, Pearlmutter, Radul and Siskind2018). Automatic differentiation is different from, and in several respects superior to, numerical or symbolic differentiation – two commonly encountered techniques of computing derivatives. In its most basic description (Baydin et al.
Reference Baydin, Pearlmutter, Radul and Siskind2018), automatic differentiation relies on the fact that all numerical computations are ultimately compositions of a finite set of elementary operations for which derivatives are known. Combining the derivatives of the constituent operations through the chain rule gives the derivative of the overall composition. This allows accurate evaluation of derivatives at machine precision with ideal asymptotic efficiency and only a small constant factor of overhead. In particular, to compute the required derivatives we rely on Tensorflow (Abadi et al.
Reference Abadi2016), which is a popular and relatively well-documented open source software library for automatic differentiation and deep learning computations.
Pedagogical physics-informed neural network: a plain vanilla densely connected (physics-uninformed) neural network, with 10 hidden layers and 32 neurons per hidden layer per output variable (i.e.
 $1\times 32=32$
neurons per hidden layer), takes the input variable
 $t$
and outputs
 $\unicode[STIX]{x1D702}$
. As for the activation functions, we use
 $\unicode[STIX]{x1D70E}(x)=\sin (x)$
. For illustration purposes only, the network depicted in this figure comprises two hidden layers and four neurons per hidden layer. We employ automatic differentiation to obtain the required derivatives to compute the residual (physics-informed) networks
 $f_{L}$
. The total loss function is composed of the regression loss of the displacement
 $\unicode[STIX]{x1D702}$
on the training data, and the loss imposed by the differential equation
 $f_{L}$
. Here,
 $I$
denotes the identity operator and the differential operator
 $\unicode[STIX]{x2202}_{t}$
is computed using automatic differentiation and can be thought of as an ‘activation operator’. Moreover, the gradients of the loss function are back-propagated through the entire network to train the parameters of the neural network as well as the damping
 $b$
and the stiffness
 $k$
parameters using the Adam optimizer.

The shared parameters of the neural networks
 $\unicode[STIX]{x1D702}$
and
 $f_{L}$
, in addition to the damping
 $b$
and the stiffness
 $k$
parameters, can be learned by minimizing the following sum of squared errors loss function:
 $$\begin{eqnarray}\mathop{\sum }_{n=1}^{N}|\unicode[STIX]{x1D702}(t^{n})-\unicode[STIX]{x1D702}^{n}|^{2}+\mathop{\sum }_{n=1}^{N}|f_{L}(t^{n})-f_{L}^{n}|^{2}.\end{eqnarray}$$
The first summation in this loss function corresponds to the training data on the displacement
 $\unicode[STIX]{x1D702}(t)$
while the second summation enforces the dynamics imposed by (2.1).
2.2 Inferring lift and drag forces from scattered velocity measurements
So far, we have been operating under the assumption that we have access to direct measurements of the lift force
 $f_{L}$
. In the following, we are going to relax this assumption by recalling that the fluid motion is governed by the incompressible Navier–Stokes equations given explicitly by
 $$\begin{eqnarray}\left.\begin{array}{@{}c@{}}u_{t}+uu_{x}+vu_{y}=-p_{x}+Re^{-1}(u_{xx}+u_{yy}),\\ v_{t}+uv_{x}+vv_{y}=-p_{y}+Re^{-1}(v_{xx}+v_{yy})-\unicode[STIX]{x1D702}_{tt},\\ u_{x}+v_{y}=0.\end{array}\right\}\end{eqnarray}$$
Here,
 $u(t,x,y)$
and
 $v(t,x,y)$
are the streamwise and crossflow components of the velocity field, respectively, while
 $p(t,x,y)$
denotes the pressure and
 $Re$
is the Reynolds number based on the cylinder diameter and the free stream velocity. We consider the incompressible Navier–Stokes equations in the coordinate system attached to the cylinder, so that the cylinder appears stationary in time. This explains the appearance of the extra term
 $\unicode[STIX]{x1D702}_{tt}$
in the second momentum equation (2.4).
Problem 1 (VIV-I).
Given scattered and potentially noisy measurements
 $\{t^{n},x^{n},y^{n},u^{n},v^{n}\}\text{}_{n=1}^{N}$
of the velocity field in addition to the data
 $\{t^{n},\unicode[STIX]{x1D702}^{n}\}\text{}_{n=1}^{N}$
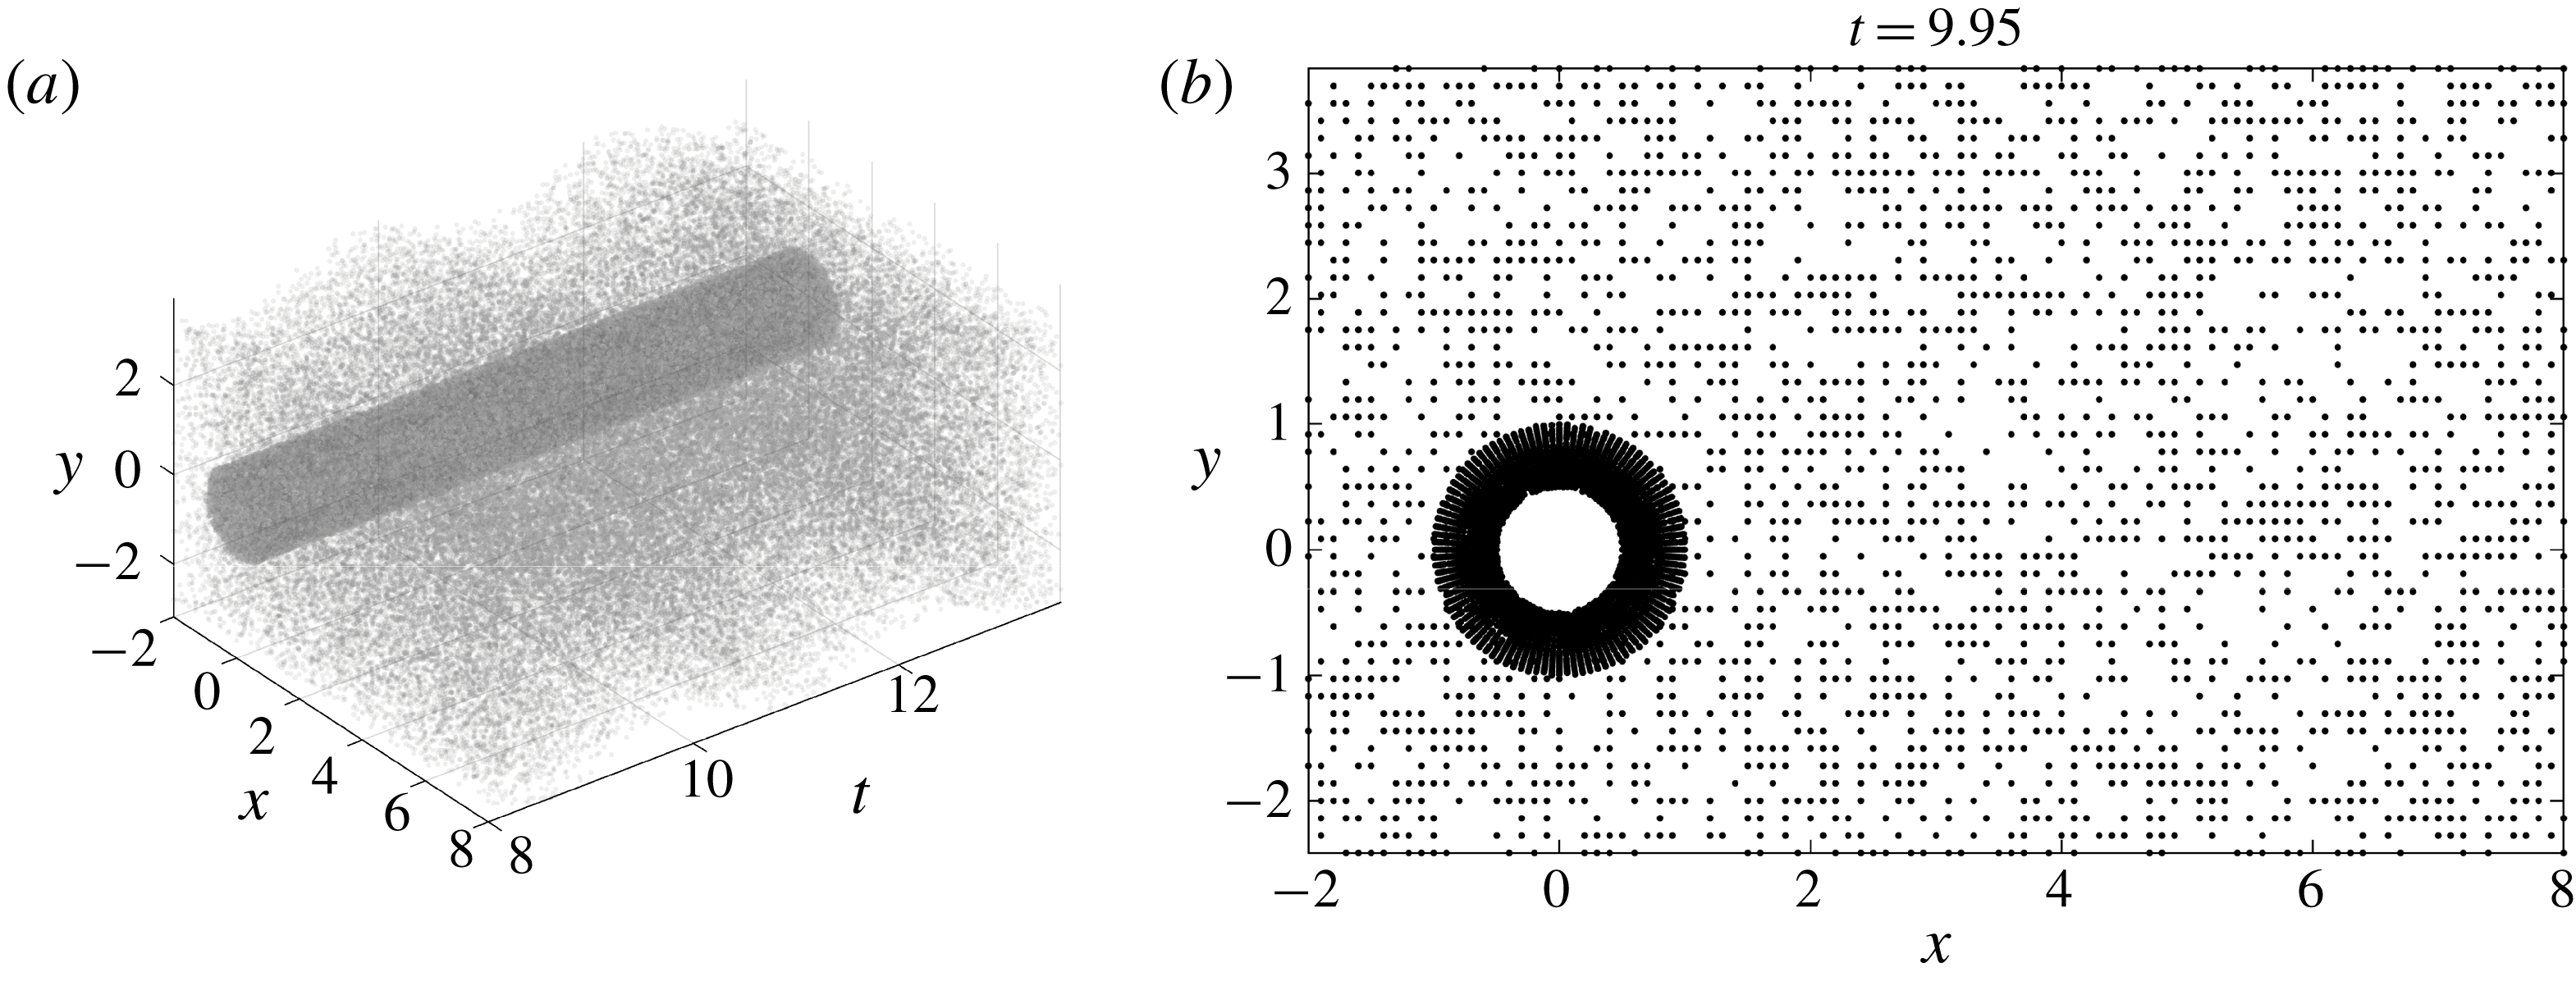
on the displacement and knowing the governing equations of the flow (2.4), we are interested in reconstructing the entire velocity field as well as the pressure field in space–time. (Take for example the case of reconstructing a flow field from scattered measurements obtained from particle image velocimetry or particle tracking velocimetry.) Such measurements are usually collected only in a small subdomain, which may not be appropriate for classical CFD computations due to the presence of numerical artifacts. Typically, the data points are scattered in both space and time and are usually of the order of a few thousands or less in space. For a visual representation of the distribution of observation points
 $\{t^{n},x^{n},y^{n}\}\text{}_{n=1}^{N}$
scattered in space and time, see figure 3.
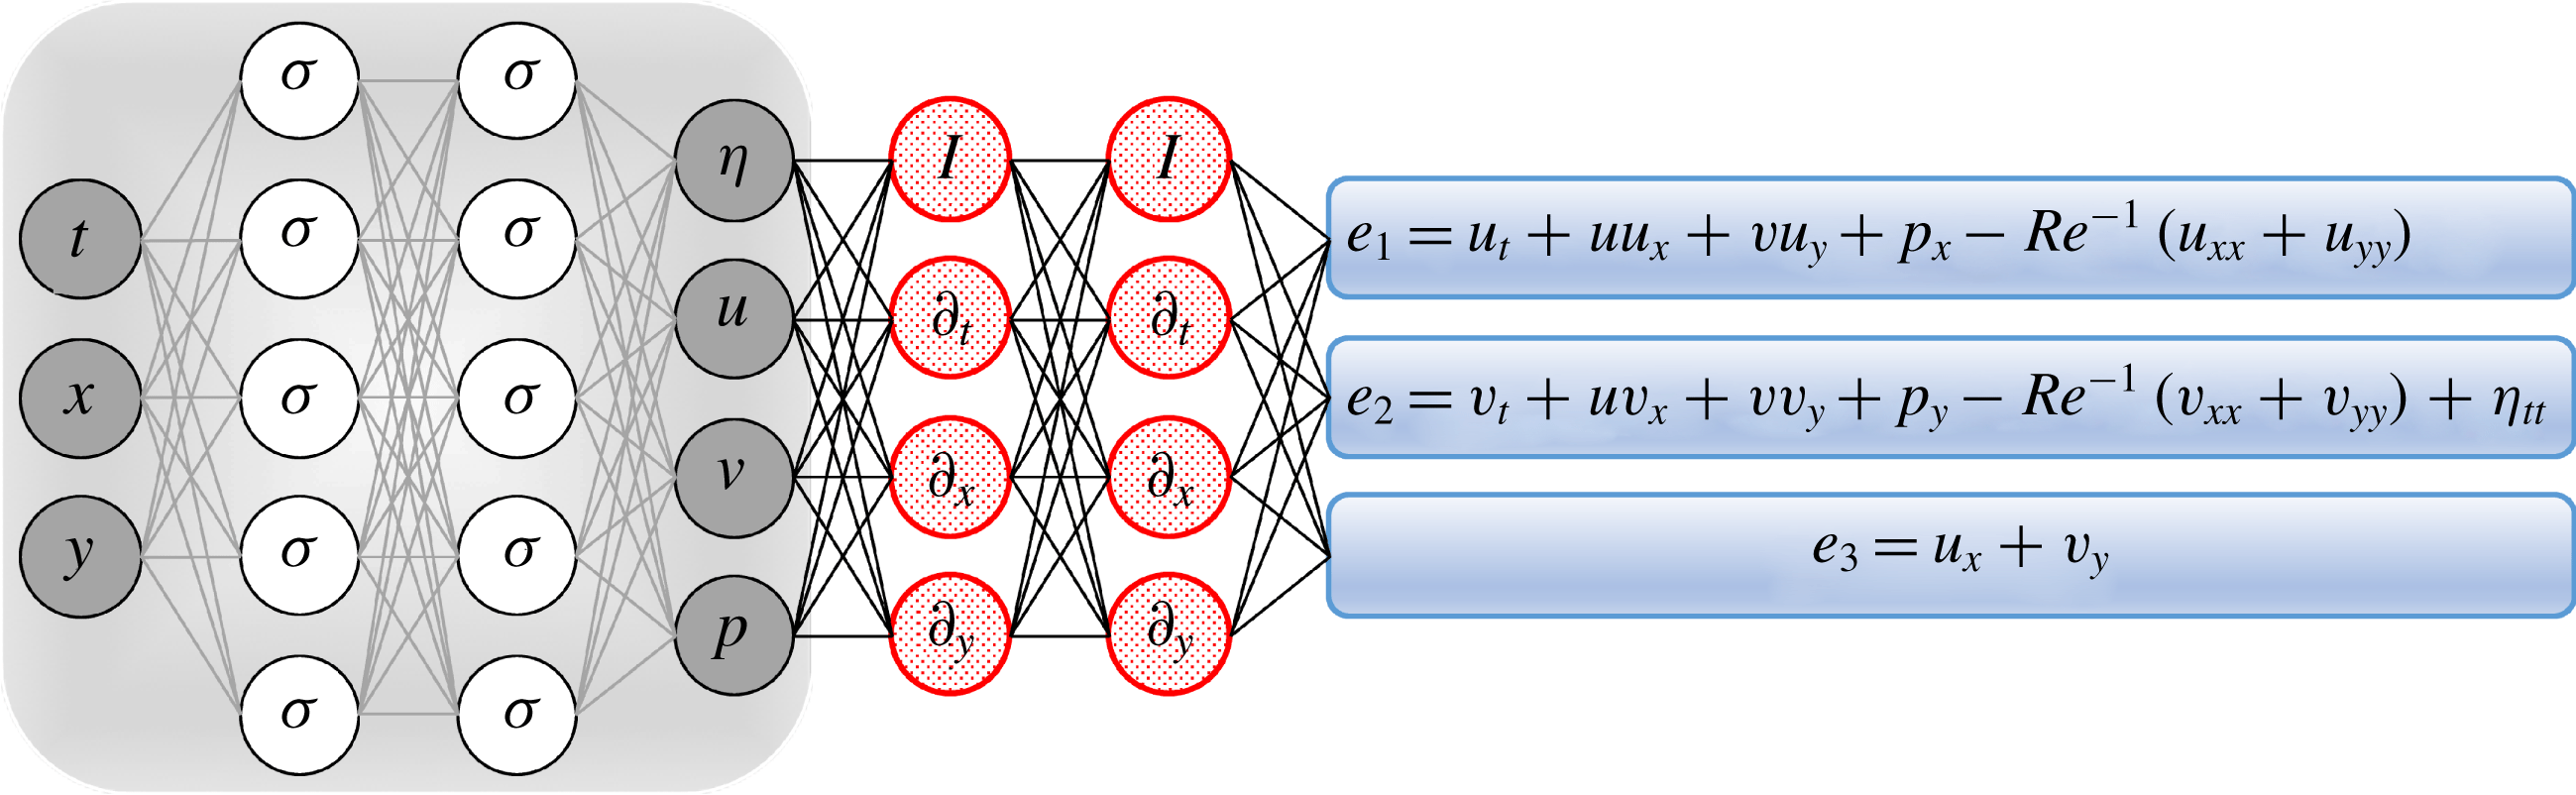
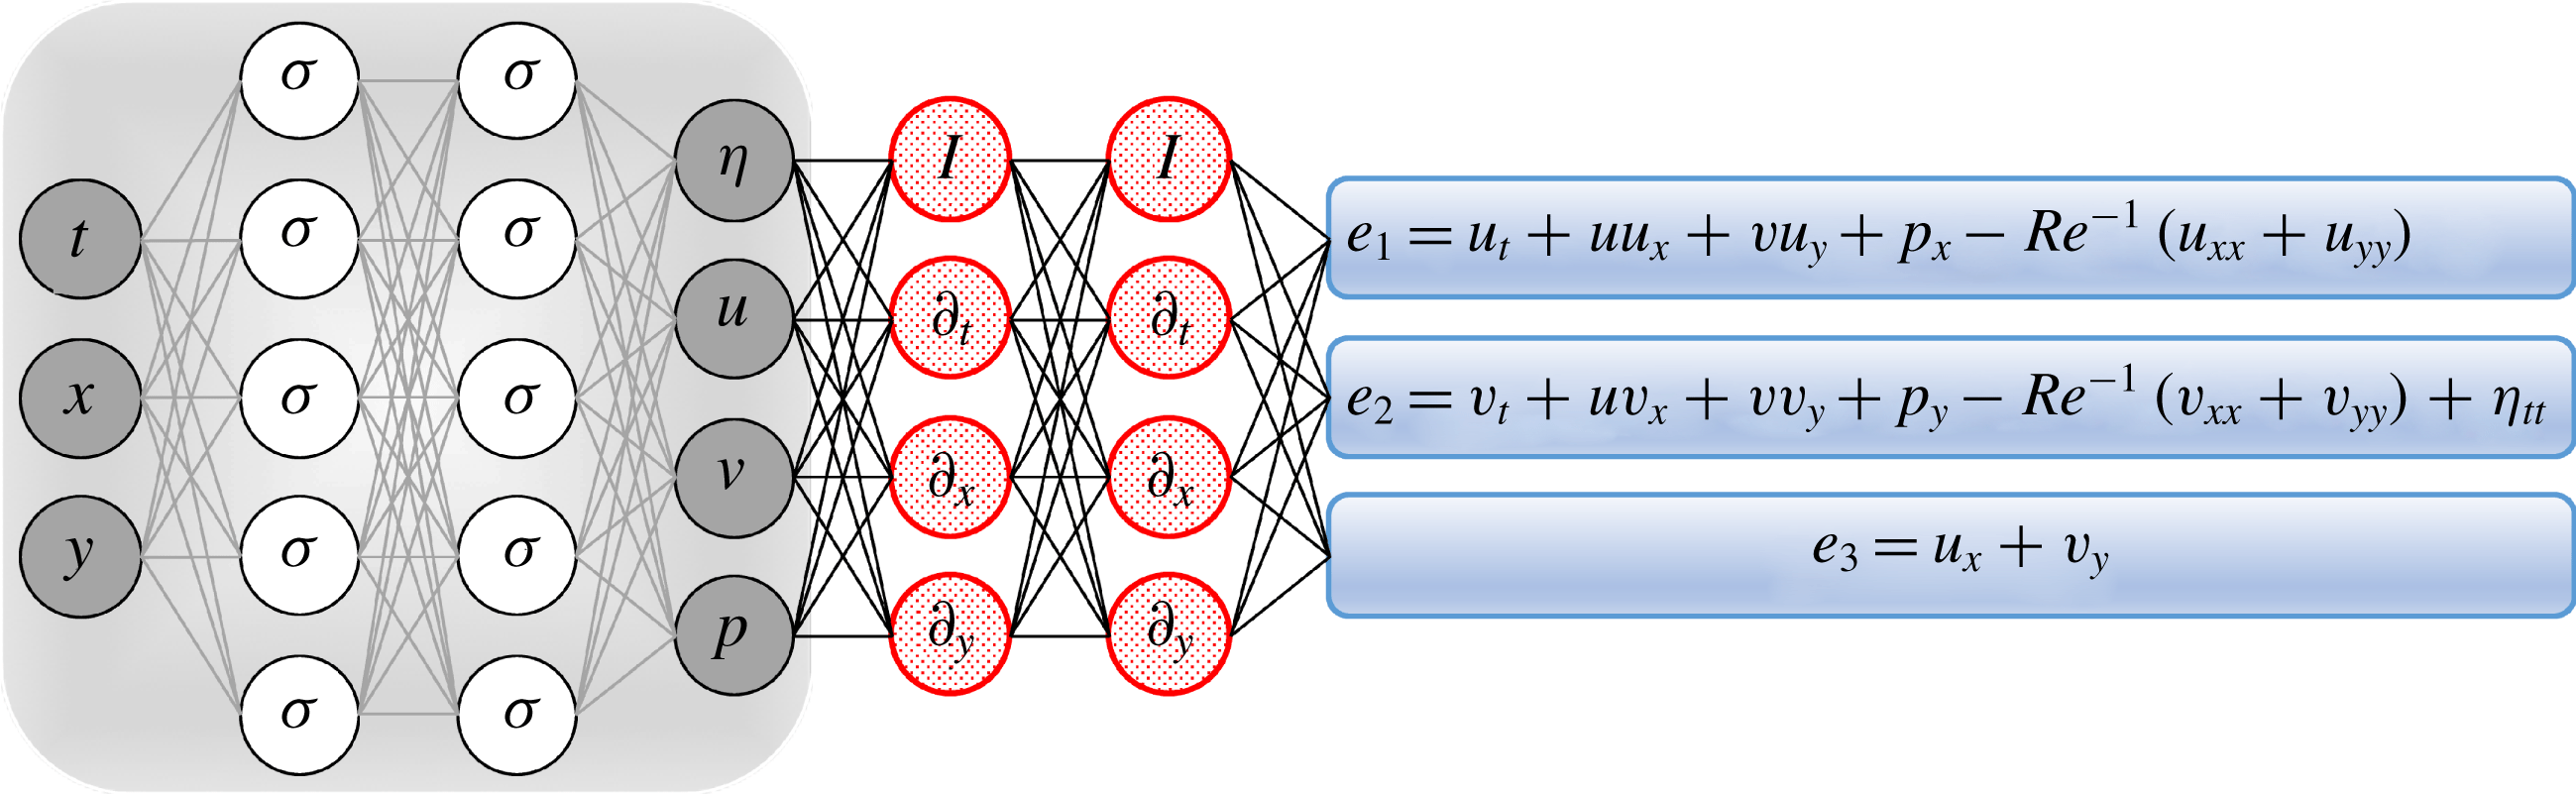
Navier–Stokes informed neural networks: a plain vanilla densely connected (physics-uninformed) neural network, with 10 hidden layers and 32 neurons per hidden layer per output variable (i.e.
 $4\times 32=128$
neurons per hidden layer), takes the input variables
 $t$
,
 $x$
and
 $y$
and outputs
 $\unicode[STIX]{x1D702}$
,
 $u$
,
 $v$
and
 $p$
. As for the activation functions, we use
 $\unicode[STIX]{x1D70E}(x)=\sin (x)$
. For illustration purposes only, the network depicted in this figure comprises two hidden layers and five neurons per hidden layer. We employ automatic differentiation to obtain the required derivatives to compute the residual (physics-informed) networks
 $e_{1}$
,
 $e_{2}$
and
 $e_{3}$
. If a term does not appear in the blue boxes (e.g.
 $u_{xy}$
or
 $u_{tt}$
), its coefficient is assumed to be zero. It is worth emphasizing that unless the coefficient in front of a term is non-zero, that term is not going to appear in the actual ‘compiled’ computational graph and is not going to contribute to the computational cost of a feed-forward evaluation of the resulting network. The total loss function is composed of the regression loss of the velocity fields
 $u,v$
and the displacement
 $\unicode[STIX]{x1D702}$
on the training data, and the loss imposed by the differential equations
 $e_{1}$
,
 $e_{2}$
and
 $e_{3}$
. Here,
 $I$
denotes the identity operator and the differential operators
 $\unicode[STIX]{x2202}_{t},\unicode[STIX]{x2202}_{x}$
and
 $\unicode[STIX]{x2202}_{y}$
are computed using automatic differentiation and can be thought of as ‘activation operators’. Moreover, the gradients of the loss function are back-propagated through the entire network to train the neural network parameters using the Adam optimizer.
Point cloud: depicted in (a) is a visual representation of the distribution of observation points
 $\{t^{n},x^{n},y^{n}\}\text{}_{n=1}^{N}$
scattered in space and time. A randomly selected snapshot of the distribution of data points is also shown in (b). To capture the boundary layers, a finer resolution of points is sampled closer to the cylinder.

To solve the aforementioned problem, we proceed by approximating the latent functions
 $u(t,x,y)$
,
 $v(t,x,y)$
,
 $p(t,x,y)$
and
 $\unicode[STIX]{x1D702}(t)$
by a single neural network outputting four variables while taking as input
 $t$
,
 $x$
and
 $y$
. This prior assumption along with the incompressible Navier–Stokes equations (2.4) result in the following Navier–Stokes informed neural networks (see figure 2):
 $$\begin{eqnarray}\left.\begin{array}{@{}c@{}}e_{1}:=u_{t}+uu_{x}+vu_{y}+p_{x}-Re^{-1}(u_{xx}+u_{yy}),\\ e_{2}:=v_{t}+uv_{x}+vv_{y}+p_{y}-Re^{-1}(v_{xx}+v_{yy})+\unicode[STIX]{x1D702}_{tt},\\ e_{3}:=u_{x}+v_{y}.\end{array}\right\}\end{eqnarray}$$
We use automatic differentiation (Baydin et al.
Reference Baydin, Pearlmutter, Radul and Siskind2018) to obtain the required derivatives to compute the residual networks
 $e_{1}$
,
 $e_{2}$
and
 $e_{3}$
. The shared parameters of the neural networks
 $u$
,
 $v$
,
 $p$
,
 $\unicode[STIX]{x1D702}$
,
 $e_{1}$
,
 $e_{2}$
and
 $e_{3}$
can be learned by minimizing the sum of squared errors loss function
 $$\begin{eqnarray}\displaystyle & & \displaystyle \mathop{\sum }_{n=1}^{N}(|u(t^{n},x^{n},y^{n})-u^{n}|^{2}+|v(t^{n},x^{n},y^{n})-v^{n}|^{2})\nonumber\\ \displaystyle & & \displaystyle \quad +\,\mathop{\sum }_{n=1}^{N}|\unicode[STIX]{x1D702}(t^{n})-\unicode[STIX]{x1D702}^{n}|^{2}+\mathop{\sum }_{i=1}^{3}\mathop{\sum }_{n=1}^{N}(|e_{i}(t^{n},x^{n},y^{n})|^{2}).\end{eqnarray}$$
Here, the first two summations correspond to the training data on the fluid velocity and the structure displacement while the last summation enforces the dynamics imposed by (2.4).
The fluid forces on the cylinder are functions of the pressure and the velocity gradients. Consequently, having trained the neural networks, we can use
 $$\begin{eqnarray}\displaystyle & \displaystyle F_{D}=\oint [-pn_{x}+2Re^{-1}u_{x}n_{x}+Re^{-1}(u_{y}+v_{x})n_{y}]\,\text{d}s, & \displaystyle\end{eqnarray}$$
 $$\begin{eqnarray}\displaystyle & \displaystyle F_{L}=\oint [-pn_{y}+2Re^{-1}v_{y}n_{y}+Re^{-1}(u_{y}+v_{x})n_{x}]\,\text{d}s & \displaystyle\end{eqnarray}$$
to obtain the lift and drag forces exerted by the fluid on the cylinder. Here,
 $(n_{x},n_{y})$
is the outward normal on the cylinder and
 $\text{d}s$
is the arc length on the surface of the cylinder. We use the trapezoidal rule to approximately compute these integrals, and we use (2.8) to obtain the required data on the lift force. These data are then used to estimate the structural parameters
 $b$
and
 $k$
by minimizing the loss function (2.3).
2.3 Inferring lift and drag forces from flow visualizations
We now consider the second VIV learning problem by taking one step further and circumvent the need for having access to measurements of the velocity field by leveraging the following equation:
 $$\begin{eqnarray}c_{t}+uc_{x}+vc_{y}=Pe^{-1}(c_{xx}+c_{yy})\end{eqnarray}$$
governing the evolution of the concentration
 $c(t,x,y)$
of a passive scalar injected into the fluid flow dynamics described by the incompressible Navier–Stokes equations (2.4). Here,
 $Pe$
denotes the Péclet number, defined based on the cylinder diameter, the free-stream velocity and the diffusivity of the concentration species.
Problem 2 (VIV-II).
Given scattered and potentially noisy measurements
 $\{t^{n},x^{n},y^{n},c^{n}\}\text{}_{n=1}^{N}$
of the concentration
 $c(t,x,y)$
of the passive scalar in space–time, we are interested in inferring the latent (hidden) quantities
 $u(t,x,y)$
,
 $v(t,x,y)$
and
 $p(t,x,y)$
while leveraging the governing equations of the flow (2.4) as well as (2.9) describing the evolution of the passive scalar. Typically, the data points are of the order of a few thousands or less in space. For a visual representation of the distribution of observation points
 $\{t^{n},x^{n},y^{n}\}\text{}_{n=1}^{N}$
scattered in space and time, see figure 3. Moreover, equations (2.7) and (2.8) enable us to consequently compute the drag and lift forces, respectively, as functions of the inferred pressure and velocity gradients. Unlike the first VIV problem, here we assume that we do not have access to direct observations of the velocity field.
Navier–Stokes informed neural networks: a plain vanilla densely connected (physics-uninformed) neural network, with 10 hidden layers and 32 neurons per hidden layer per output variable (i.e.
 $5\times 32=160$
neurons per hidden layer), takes the input variables
 $t$
,
 $x$
and
 $y$
and outputs
 $\unicode[STIX]{x1D702},c,u,v,w$
and
 $p$
. As for the activation functions, we use
 $\unicode[STIX]{x1D70E}(x)=\sin (x)$
. For illustration purposes only, the network depicted in this figure comprises two hidden layers and six neurons per hidden layer. We employ automatic differentiation to obtain the required derivatives to compute the residual (physics-informed) networks
 $e_{1}$
,
 $e_{2}$
,
 $e_{3}$
and
 $e_{4}$
. If a term does not appear in the blue boxes (e.g.
 $u_{xy}$
or
 $u_{tt}$
), its coefficient is assumed to be zero. It is worth emphasizing that unless the coefficient in front of a term is non-zero, that term is not going to appear in the actual ‘compiled’ computational graph and is not going to contribute to the computational cost of a feed-forward evaluation of the resulting network. The total loss function is composed of the regression loss of the passive scalar
 $c$
and the displacement
 $\unicode[STIX]{x1D702}$
on the training data, and the loss imposed by the differential equations
 $e_{1}$
–
 $e_{4}$
. Here,
 $I$
denotes the identity operator and the differential operators
 $\unicode[STIX]{x2202}_{t},\unicode[STIX]{x2202}_{x}$
and
 $\unicode[STIX]{x2202}_{y}$
are computed using automatic differentiation and can be thought of as ‘activation operators’. Moreover, the gradients of the loss function are back-propagated through the entire network to train the neural network parameters using the Adam optimizer.

To solve the second VIV problem, in addition to approximating
 $u(t,x,y)$
,
 $v(t,x,y)$
,
 $p(t,x,y)$
and
 $\unicode[STIX]{x1D702}(t)$
by deep neural networks as before, we represent
 $c(t,x,y)$
by yet another output of the network taking
 $t$
,
 $x$
and
 $y$
as inputs. This prior assumption along with (2.9) results in the following additional component of the Navier–Stokes informed neural network (see figure 4):
 $$\begin{eqnarray}e_{4}:=c_{t}+uc_{x}+vc_{y}-Pe^{-1}(c_{xx}+c_{yy}).\end{eqnarray}$$
The residual networks
 $e_{1}$
,
 $e_{2}$
and
 $e_{3}$
are defined as before according to (2.5). We use automatic differentiation (Baydin et al.
Reference Baydin, Pearlmutter, Radul and Siskind2018) to obtain the required derivatives to compute the additional residual network
 $e_{4}$
. The shared parameters of the neural networks
 $c$
,
 $u$
,
 $v$
,
 $p$
,
 $\unicode[STIX]{x1D702}$
,
 $e_{1}$
,
 $e_{2}$
,
 $e_{3}$
and
 $e_{4}$
can be learned by minimizing the sum of squared errors loss function
 $$\begin{eqnarray}\displaystyle & & \displaystyle \mathop{\sum }_{n=1}^{N}(|c(t^{n},x^{n},y^{n})-c^{n}|^{2}+|\unicode[STIX]{x1D702}(t^{n})-\unicode[STIX]{x1D702}^{n}|^{2})\nonumber\\ \displaystyle & & \displaystyle \quad +\,\mathop{\sum }_{m=1}^{M}(|u(t^{m},x^{m},y^{m})-u^{m}|^{2}+|v(t^{m},x^{m},y^{m})-v^{m}|^{2})+\mathop{\sum }_{i=1}^{4}\mathop{\sum }_{n=1}^{N}(|e_{i}(t^{n},x^{n},y^{n})|^{2}).\nonumber\\ \displaystyle & & \displaystyle\end{eqnarray}$$
Here, the first summation corresponds to the training data on the concentration of the passive scalar and the structure’s displacement, the second summation corresponds to the Dirichlet boundary data on the velocity field and the last summation enforces the dynamics imposed by (2.4) and (2.9). Upon training, we use (2.8) to obtain the required data on the lift force. Such data are then used to estimate the structural parameters
 $b$
and
 $k$
by minimizing the loss function (2.3).
3 Results
To generate a high-resolution dataset for the VIV problem, we have performed direct numerical simulations employing the high-order spectral element method (Karniadakis & Sherwin Reference Karniadakis and Sherwin2005), together with the coordinate transformation method to take account of the boundary deformation (Newman & Karniadakis Reference Newman and Karniadakis1997). The computational domain is
 $[-6.5D,23.5D]\times [-10D,10D]$
, consisting of 1872 quadrilateral elements. The cylinder centre was placed at
 $(0,0)$
. On the inflow, located at
 $x/D=-6.5$
, we prescribe
 $(u=U_{\infty },v=0)$
. On the outflow, where
 $x/D=23.5$
, zero-pressure boundary condition
 $(p=0)$
is imposed. On both top and bottom boundaries where
 $y/D=\pm 10$
, a periodic boundary condition is used. The Reynolds number is
 $Re=100$
,
 $\unicode[STIX]{x1D70C}=2$
,
 $b=0.084$
and
 $k=2.2020$
. For the case with dye, we assumed the Péclet number
 $Pe=90$
. First, the simulation is carried out until
 $t=1000(D/U_{\infty })$
when the system is in steady periodic state. Then, an additional simulation for
 $\unicode[STIX]{x0394}t=14(D/U_{\infty })$
is performed to collect the data that are saved in 280 field snapshots. The time interval between two consecutive snapshots is
 $\unicode[STIX]{x0394}t=0.05(D/U_{\infty })$
. Note here
 $D=1$
is the diameter of the cylinder and
 $U_{\infty }=1$
is the inflow velocity. We use the direct numerical simulation results to compute the lift and drag forces exerted by the fluid on the cylinder. All data and codes used in this paper are publicly available on GitHub at https://github.com/maziarraissi/DeepVIV.
3.1 A pedagogical example
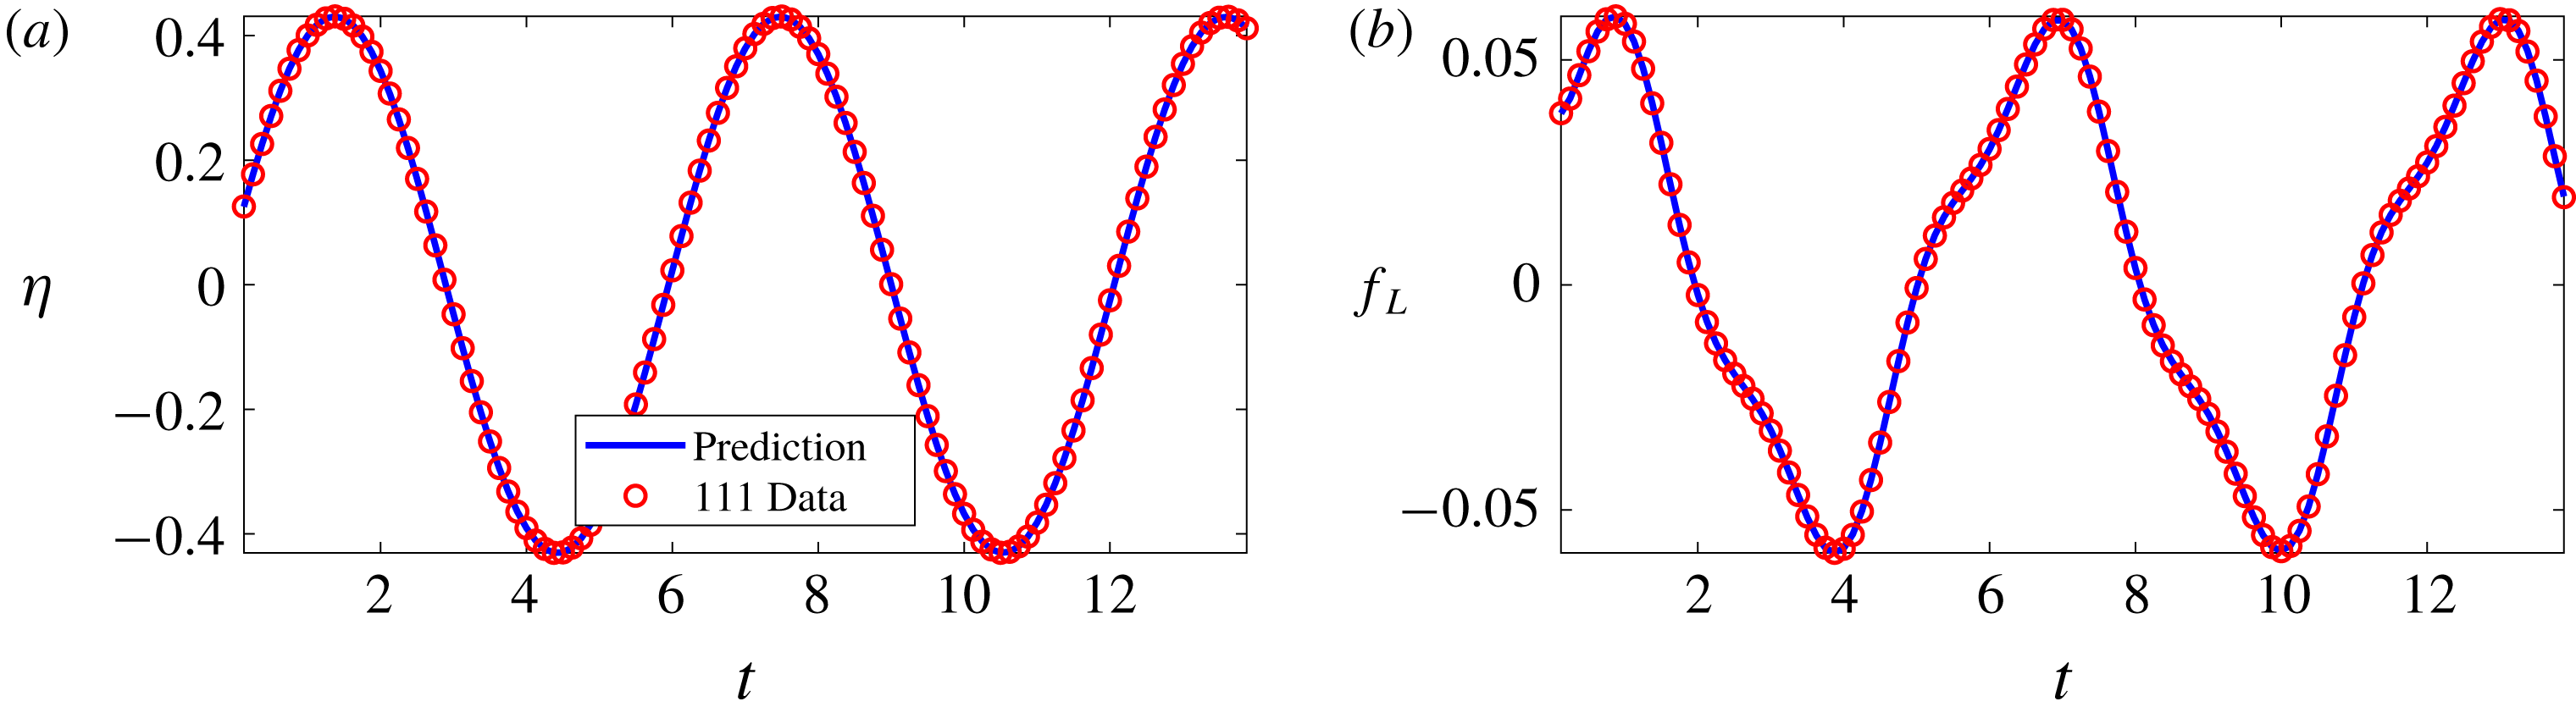
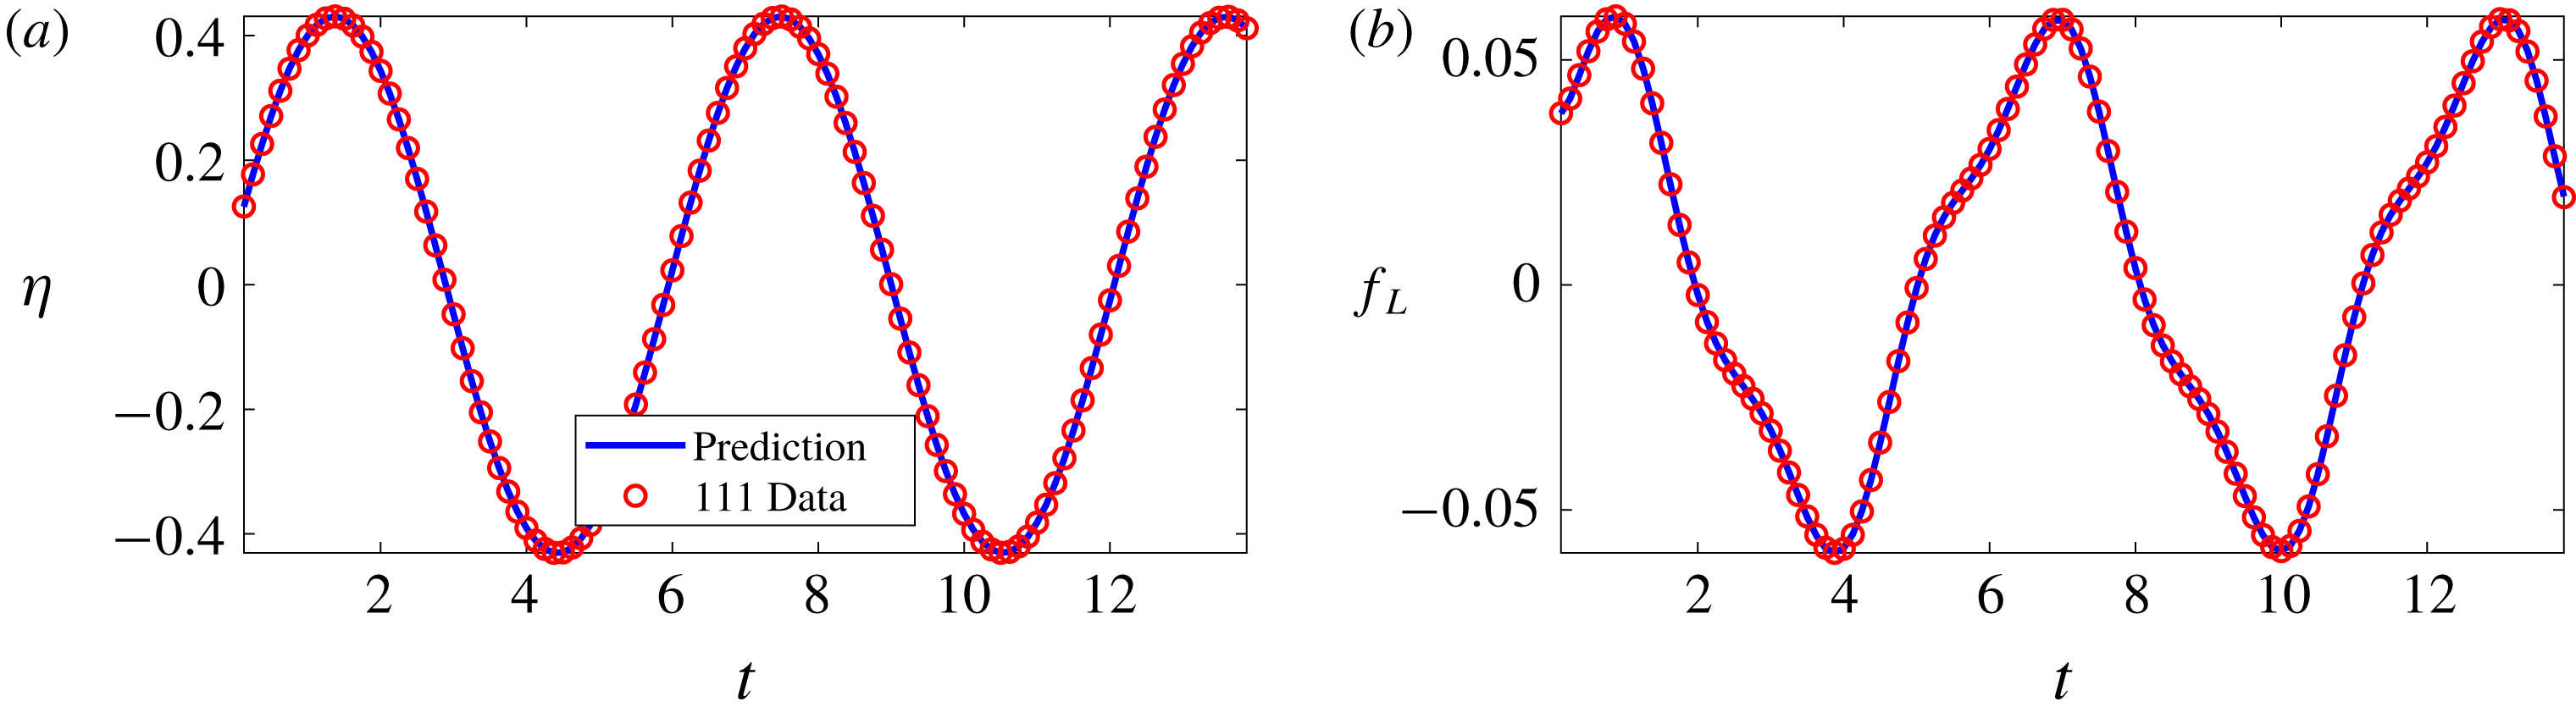
To illustrate the effectiveness of our approach, let us start with the two time series depicted in figure 5 consisting of
 $N=111$
observations of the displacement and the lift force. These data correspond to damping and stiffness parameters with exact values
 $b=0.084$
and
 $k=2.2020$
, respectively. Here, the cylinder is assumed to have a mass of
 $\unicode[STIX]{x1D70C}=2.0$
. This dataset is then used to train a 10-layer deep neural network with 32 neurons per hidden layer (see figure 1) by minimizing the sum of squared errors loss function (2.3) using the Adam optimizer (Kingma & Ba Reference Kingma and Ba2014). Upon training, the network is used to predict the entire solution functions
 $\unicode[STIX]{x1D702}(t)$
and
 $f_{L}(t)$
, as well as the unknown structural parameters
 $b$
and
 $k$
. In addition to almost perfect reconstructions of the two time series for displacement and lift force, the proposed framework is capable of identifying the correct values for the structural parameters
 $b$
and
 $k$
with remarkable accuracy. The learned values for the damping and stiffness parameters are
 $b=0.08438281$
and
 $k=2.2015007$
. This corresponds to around 0.45 % and 0.02 % relative errors in the estimated values for
 $b$
and
 $k$
, respectively.
VIVs: observations of the displacement
 $\unicode[STIX]{x1D702}$
are plotted in (a) while the data on the lift force
 $f_{L}$
are depicted in (b). These observations are shown by the red circles. Predictions of the trained neural networks
 $\unicode[STIX]{x1D702}$
and
 $f_{L}$
are depicted by blue solid lines.
As for the activation functions, we use
 $\sin (x)$
. In general, the choice of a neural network’s architecture (e.g. number of layers/neurons and form of activation functions) is crucial and in many cases still remains an art that relies on one’s ability to balance the trade-off between expressivity and trainability of the neural network (Raghu et al.
Reference Raghu, Poole, Kleinberg, Ganguli and Sohl-Dickstein2016). Our empirical findings so far indicate that deeper and wider networks are usually more expressive (i.e. they can capture a larger class of functions) but are often more costly to train (i.e. a feed-forward evaluation of the neural network takes more time and the optimizer requires more iterations to converge). Moreover, the sinusoid (i.e.
 $\sin (x)$
) activation function seems to be numerically more stable than
 $\tanh (x)$
, at least while computing the residual neural networks
 $f_{L}$
and
 $e_{i}$
,
 $i=1,\ldots ,4$
(see figures 1, 2 and 4). In this work, we have tried to choose the architectures of the neural networks in a consistent fashion throughout the paper by setting the number of layers to 10 and the number of neurons to 32 per output variable. Consequently, there might exist other architectures that improve some of the results reported in the current work.
3.2 Inferring lift and drag forces from scattered velocity measurements
Let us now consider the case where we do not have access to direct measurements of the lift force
 $f_{L}$
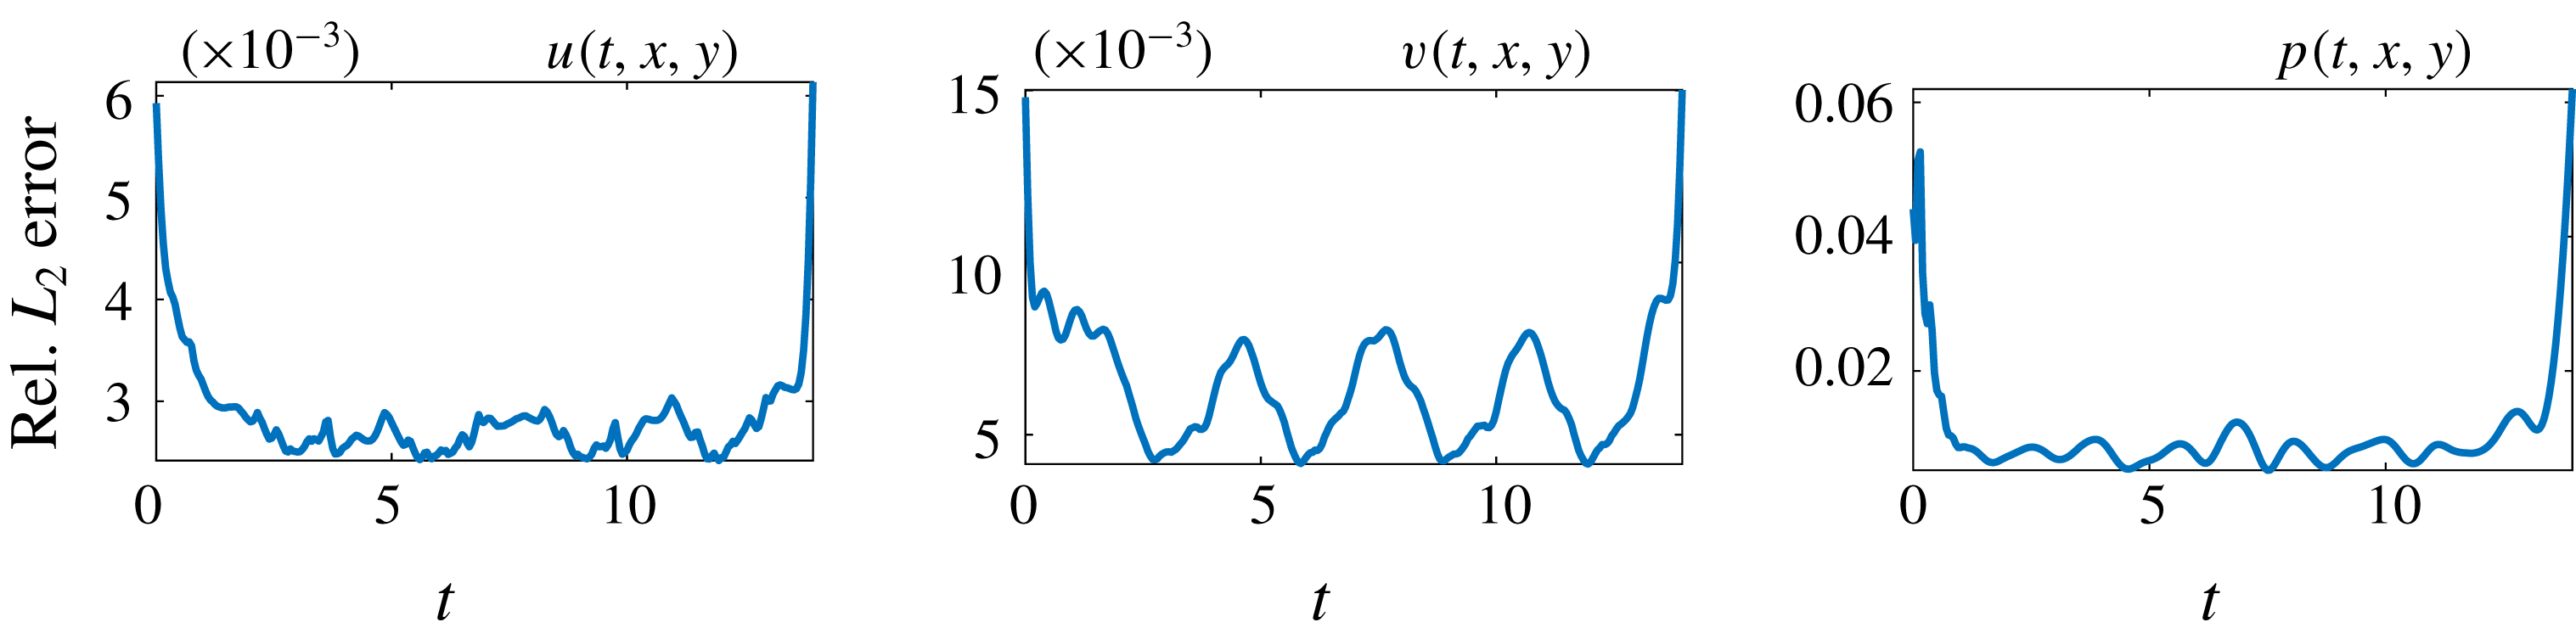
. In this case, we can use measurements of the velocity field, obtained for instance via particle image velocimetry or particle tracking velocimetry, to reconstruct the velocity field, the pressure and consequently the drag and lift forces. A representative snapshot of the data on the velocity field is depicted in the top left panel of figure 6. The neural network architectures used here consist of 10 layers with 32 neurons in each hidden layer per output variable. A summary of our results is presented in figure 6. The proposed framework is capable of accurately (of the order of
 $10^{-3}$
) reconstructing the velocity field; however, a more intriguing result stems from the network’s ability to provide an accurate prediction of the entire pressure field
 $p(t,x,y)$
in the absence of any training data on the pressure itself (see figure 7). A visual comparison against the exact pressure is presented in figure 6 for a representative snapshot of the pressure. It is worth noticing that the difference in magnitude between the exact and the predicted pressure is justified by the very nature of incompressible Navier–Stokes equations, since the pressure field is only identifiable up to a constant. This result of inferring a continuous quantity of interest from auxiliary measurements by leveraging the underlying physics is a great example of the enhanced capabilities that our approach has to offer, and highlights its potential in solving high-dimensional data assimilation and inverse problems.
VIV-I (velocity measurements): a representative snapshot of the data on the velocity field is depicted in the top left and top middle panels. The algorithm is capable of accurately (of the order of
 $10^{-3}$
) reconstructing the velocity field and more importantly the pressure without having access to even a single observation on the pressure itself. To compute the difference between the predicted and exact pressure fields we had to subtract the spatial average pressure from both predicted and exact fields because for incompressible fluids the pressure is unique only up to a constant.

VIV-I (velocity measurements): relative
 $L_{2}$
errors between predictions of the model and the corresponding exact velocity and pressure fields. Four million data points corresponding to 280 time snapshots, scattered in space and time, are used to both regress the velocity field and enforce the corresponding partial differential equations. Lack of training data on
 $u$
and
 $v$
for
 $t<0$
and
 $t>14$
leads to weaker neural network predictions for the initial and final time instants. Here, it should be emphasized that the mechanism at work is ‘regression’, not ‘interpolation’. In a regression framework, lack of training data for times
 $t<0$
and
 $t>14$
directly affects the accuracy of predictions made at and near times
 $t=0$
and
 $t=14$
.

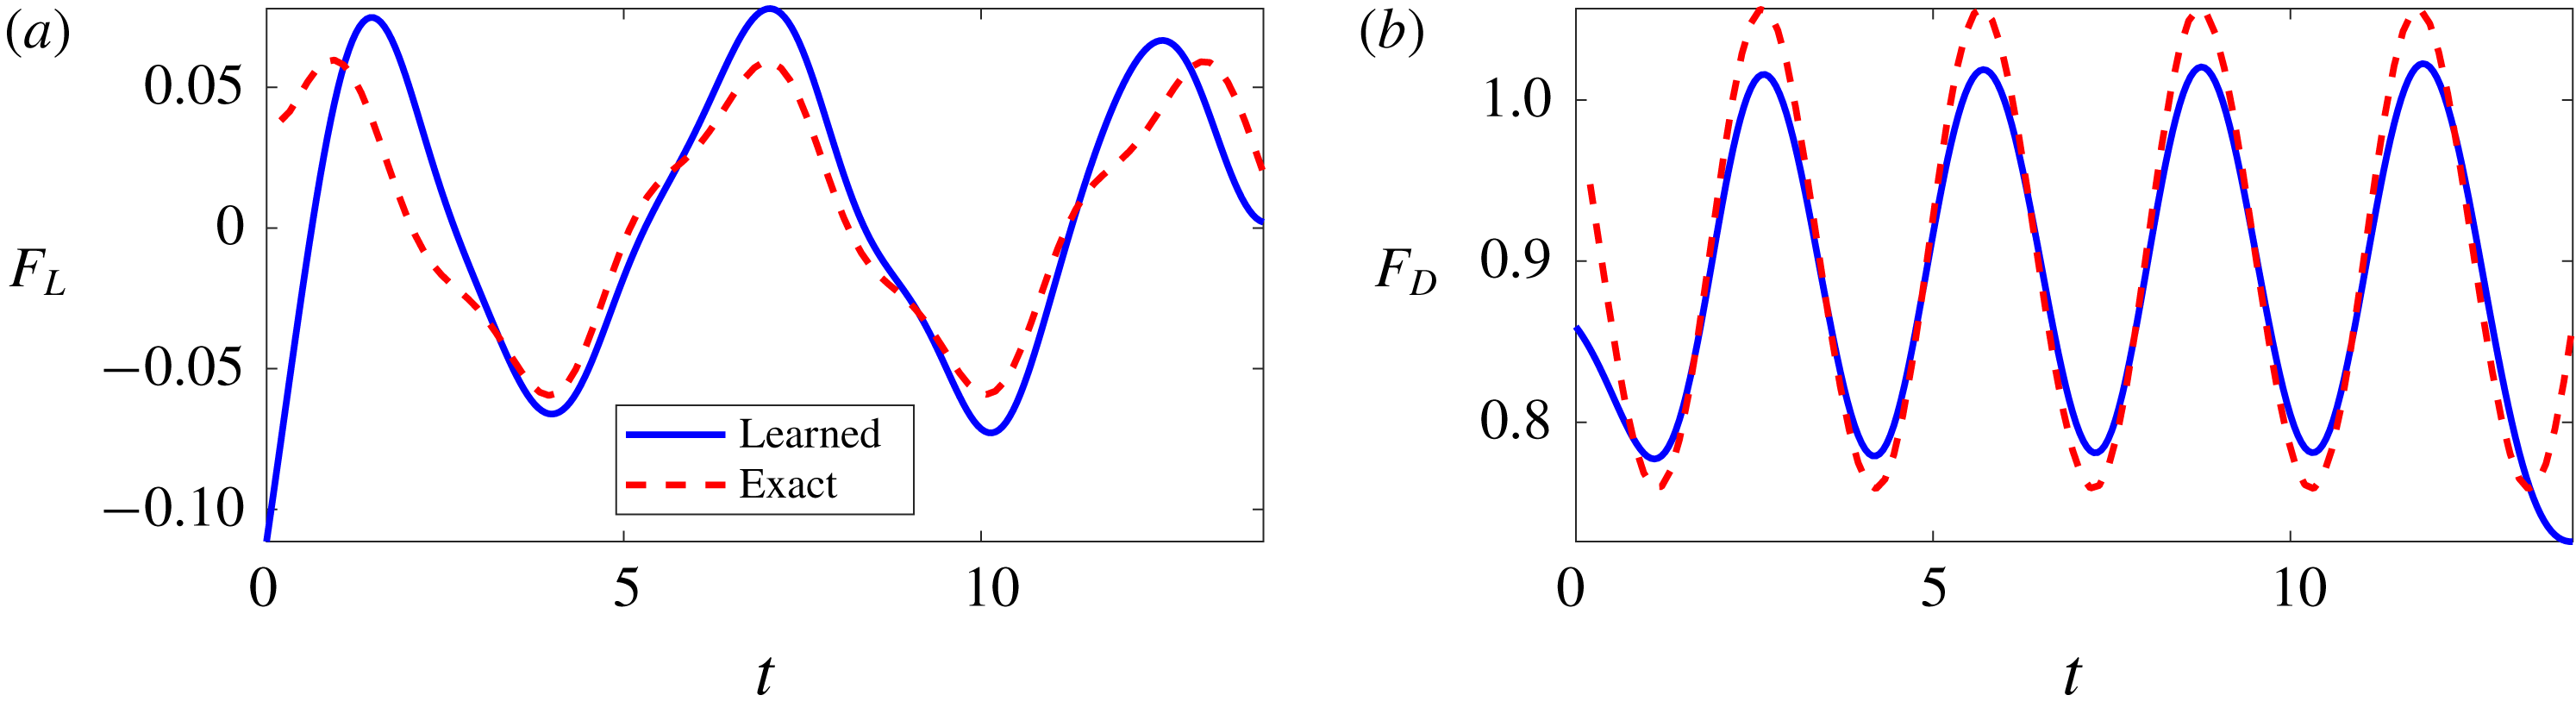
The trained neural networks representing the velocity field and the pressure can be used to compute the drag and lift forces by employing (2.7) and (2.8), respectively. The resulting drag and lift forces are compared to the exact ones in figure 8. In the following, we are going to use the computed lift force to generate the required training data on
 $f_{L}$
and estimate the structural parameters
 $b$
and
 $k$
by minimizing the loss function (2.3). Upon training, the proposed framework is capable of identifying the correct values for the structural parameters
 $b$
and
 $k$
with remarkable accuracy. The learned values for the damping and stiffness parameters are
 $b=0.0844064$
and
 $k=2.1938791$
. This corresponds to around 0.48 % and 0.37 % relative errors in the estimated values for
 $b$
and
 $k$
, respectively.
VIV-I (velocity measurements): the resulting lift (a) and drag (b) forces are compared to the exact ones.

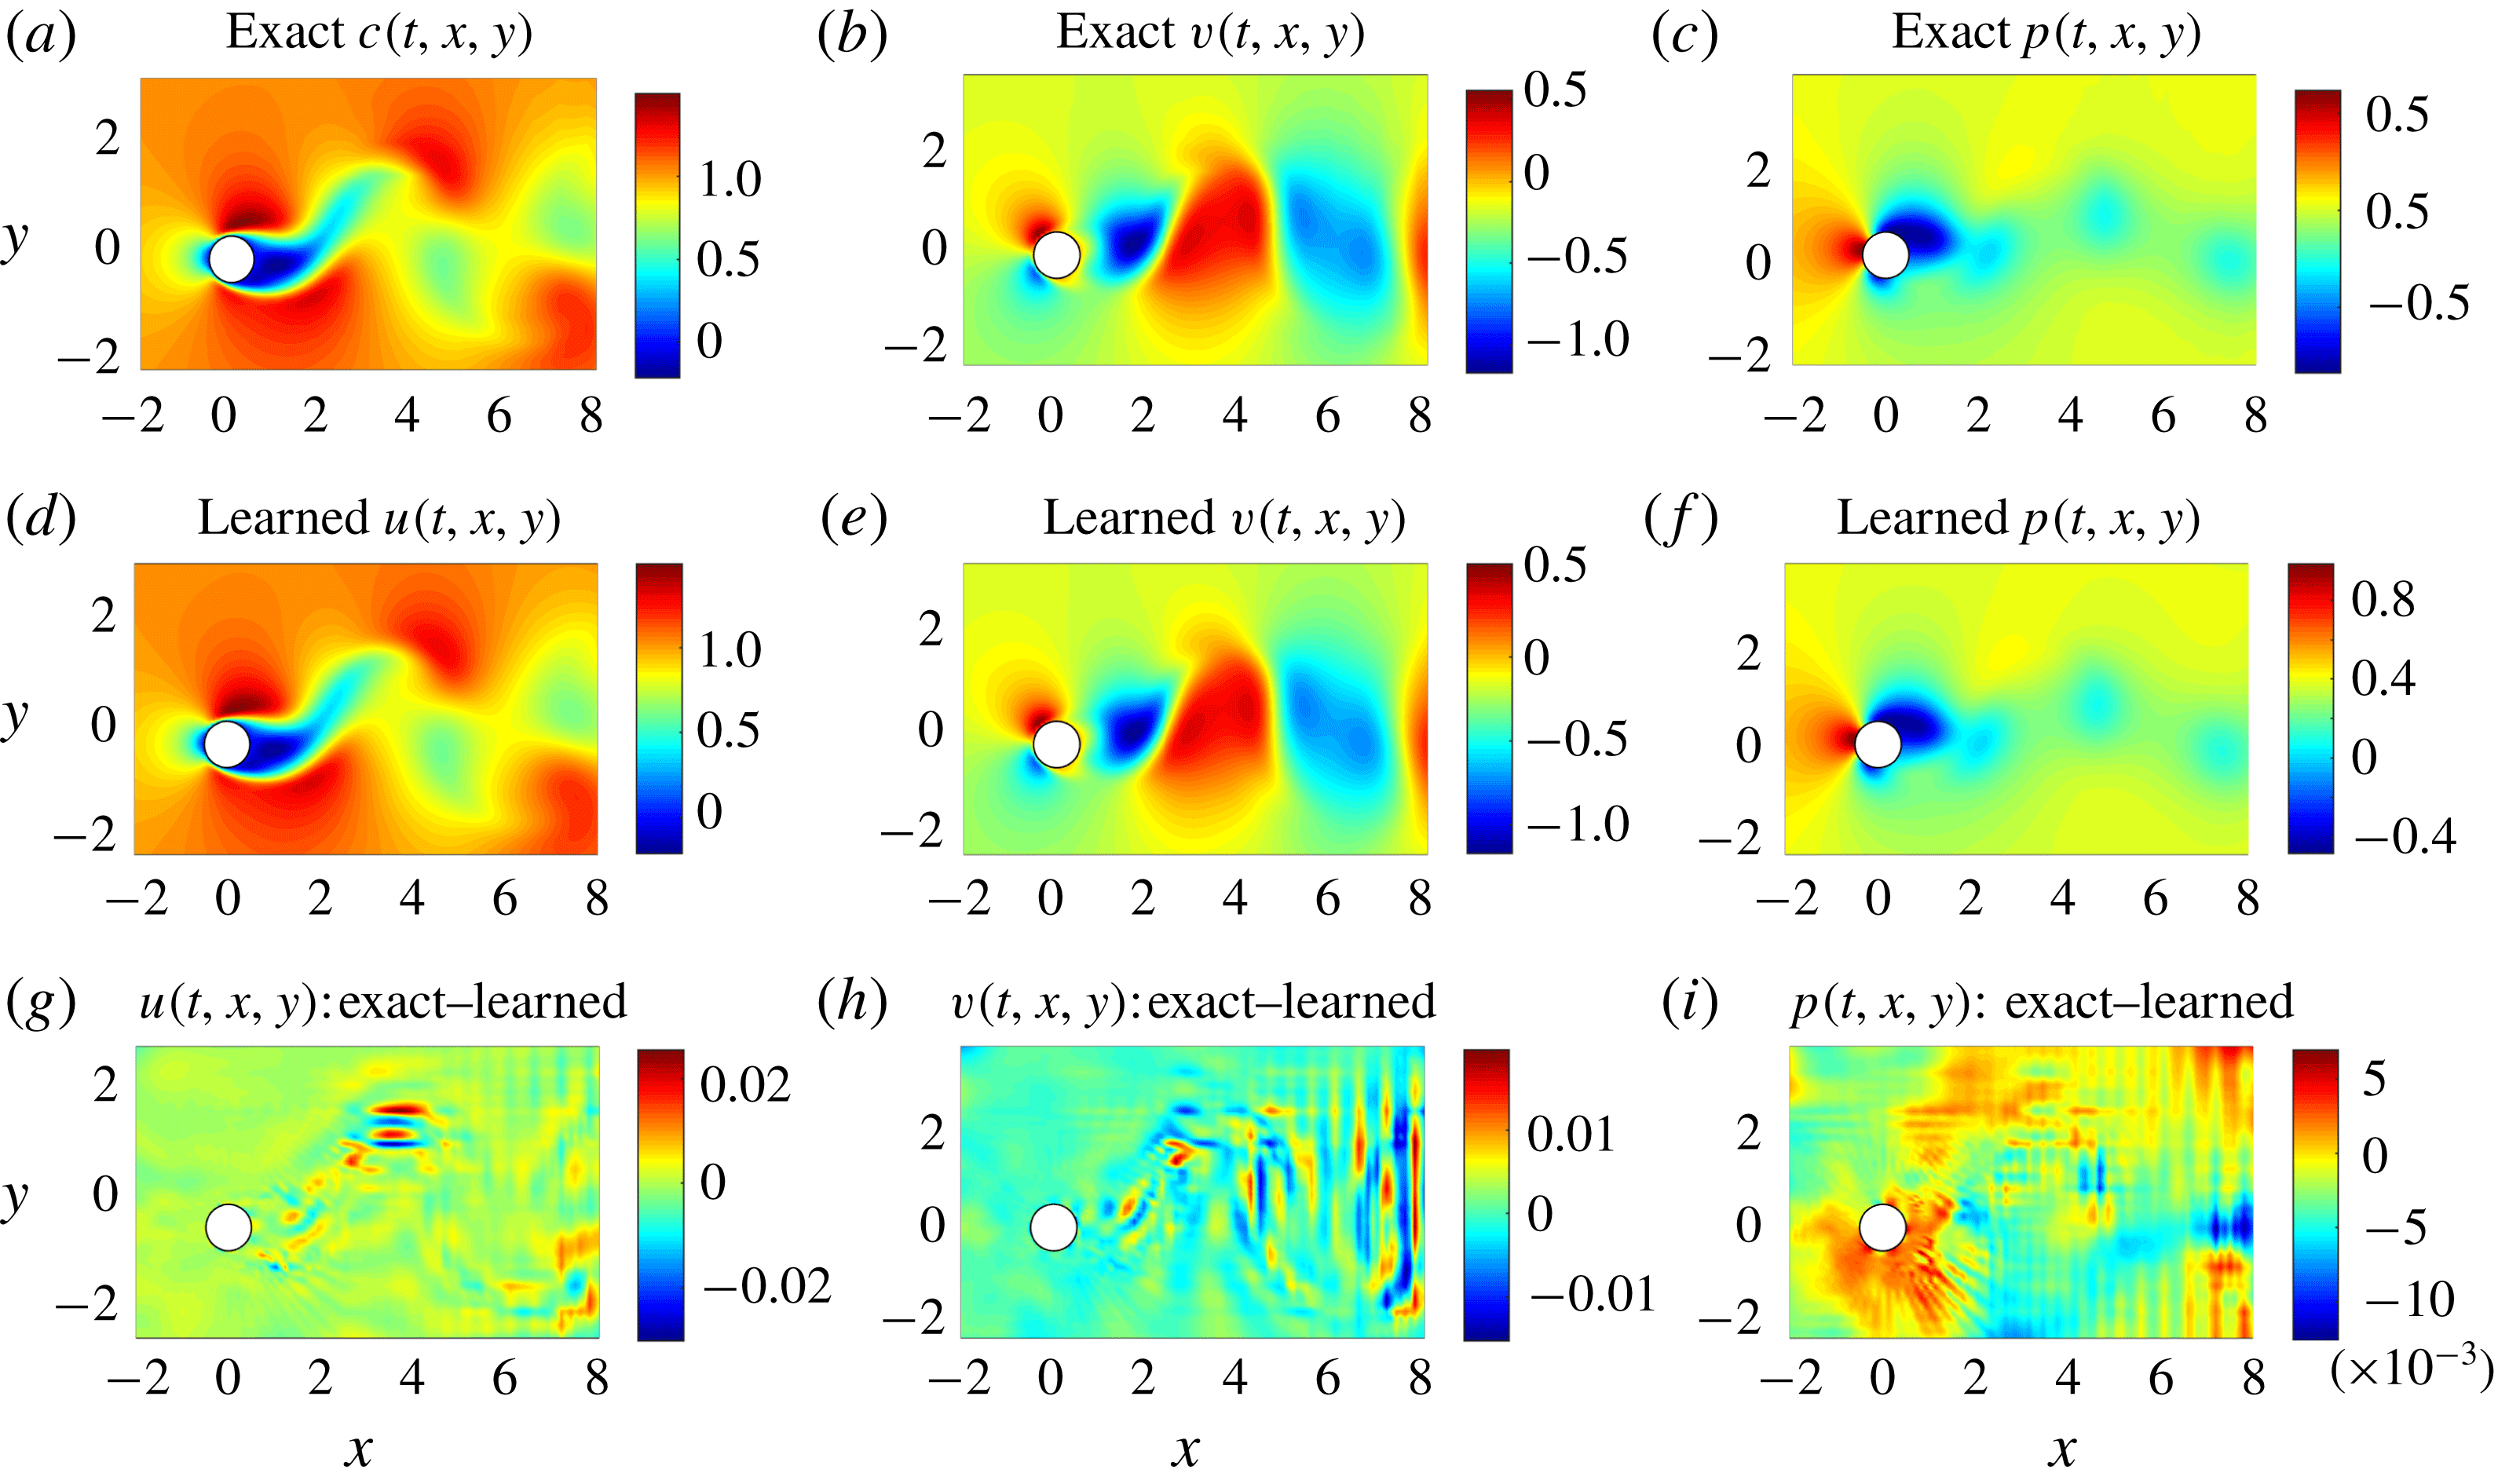
VIV-II (flow visualizations data): a representative snapshot of the data on the concentration of the passive scalar is depicted in the top left panel. The algorithm is capable of accurately (of the order of
 $10^{-3}$
) reconstructing the concentration of the passive scalar and more importantly the velocity field as well as the pressure without having access to enough observations of these quantities themselves. To compute the difference between the predicted and exact pressure fields we had to subtract the spatial average pressure from both predicted and exact fields because for incompressible fluids the pressure is unique only up to a constant.

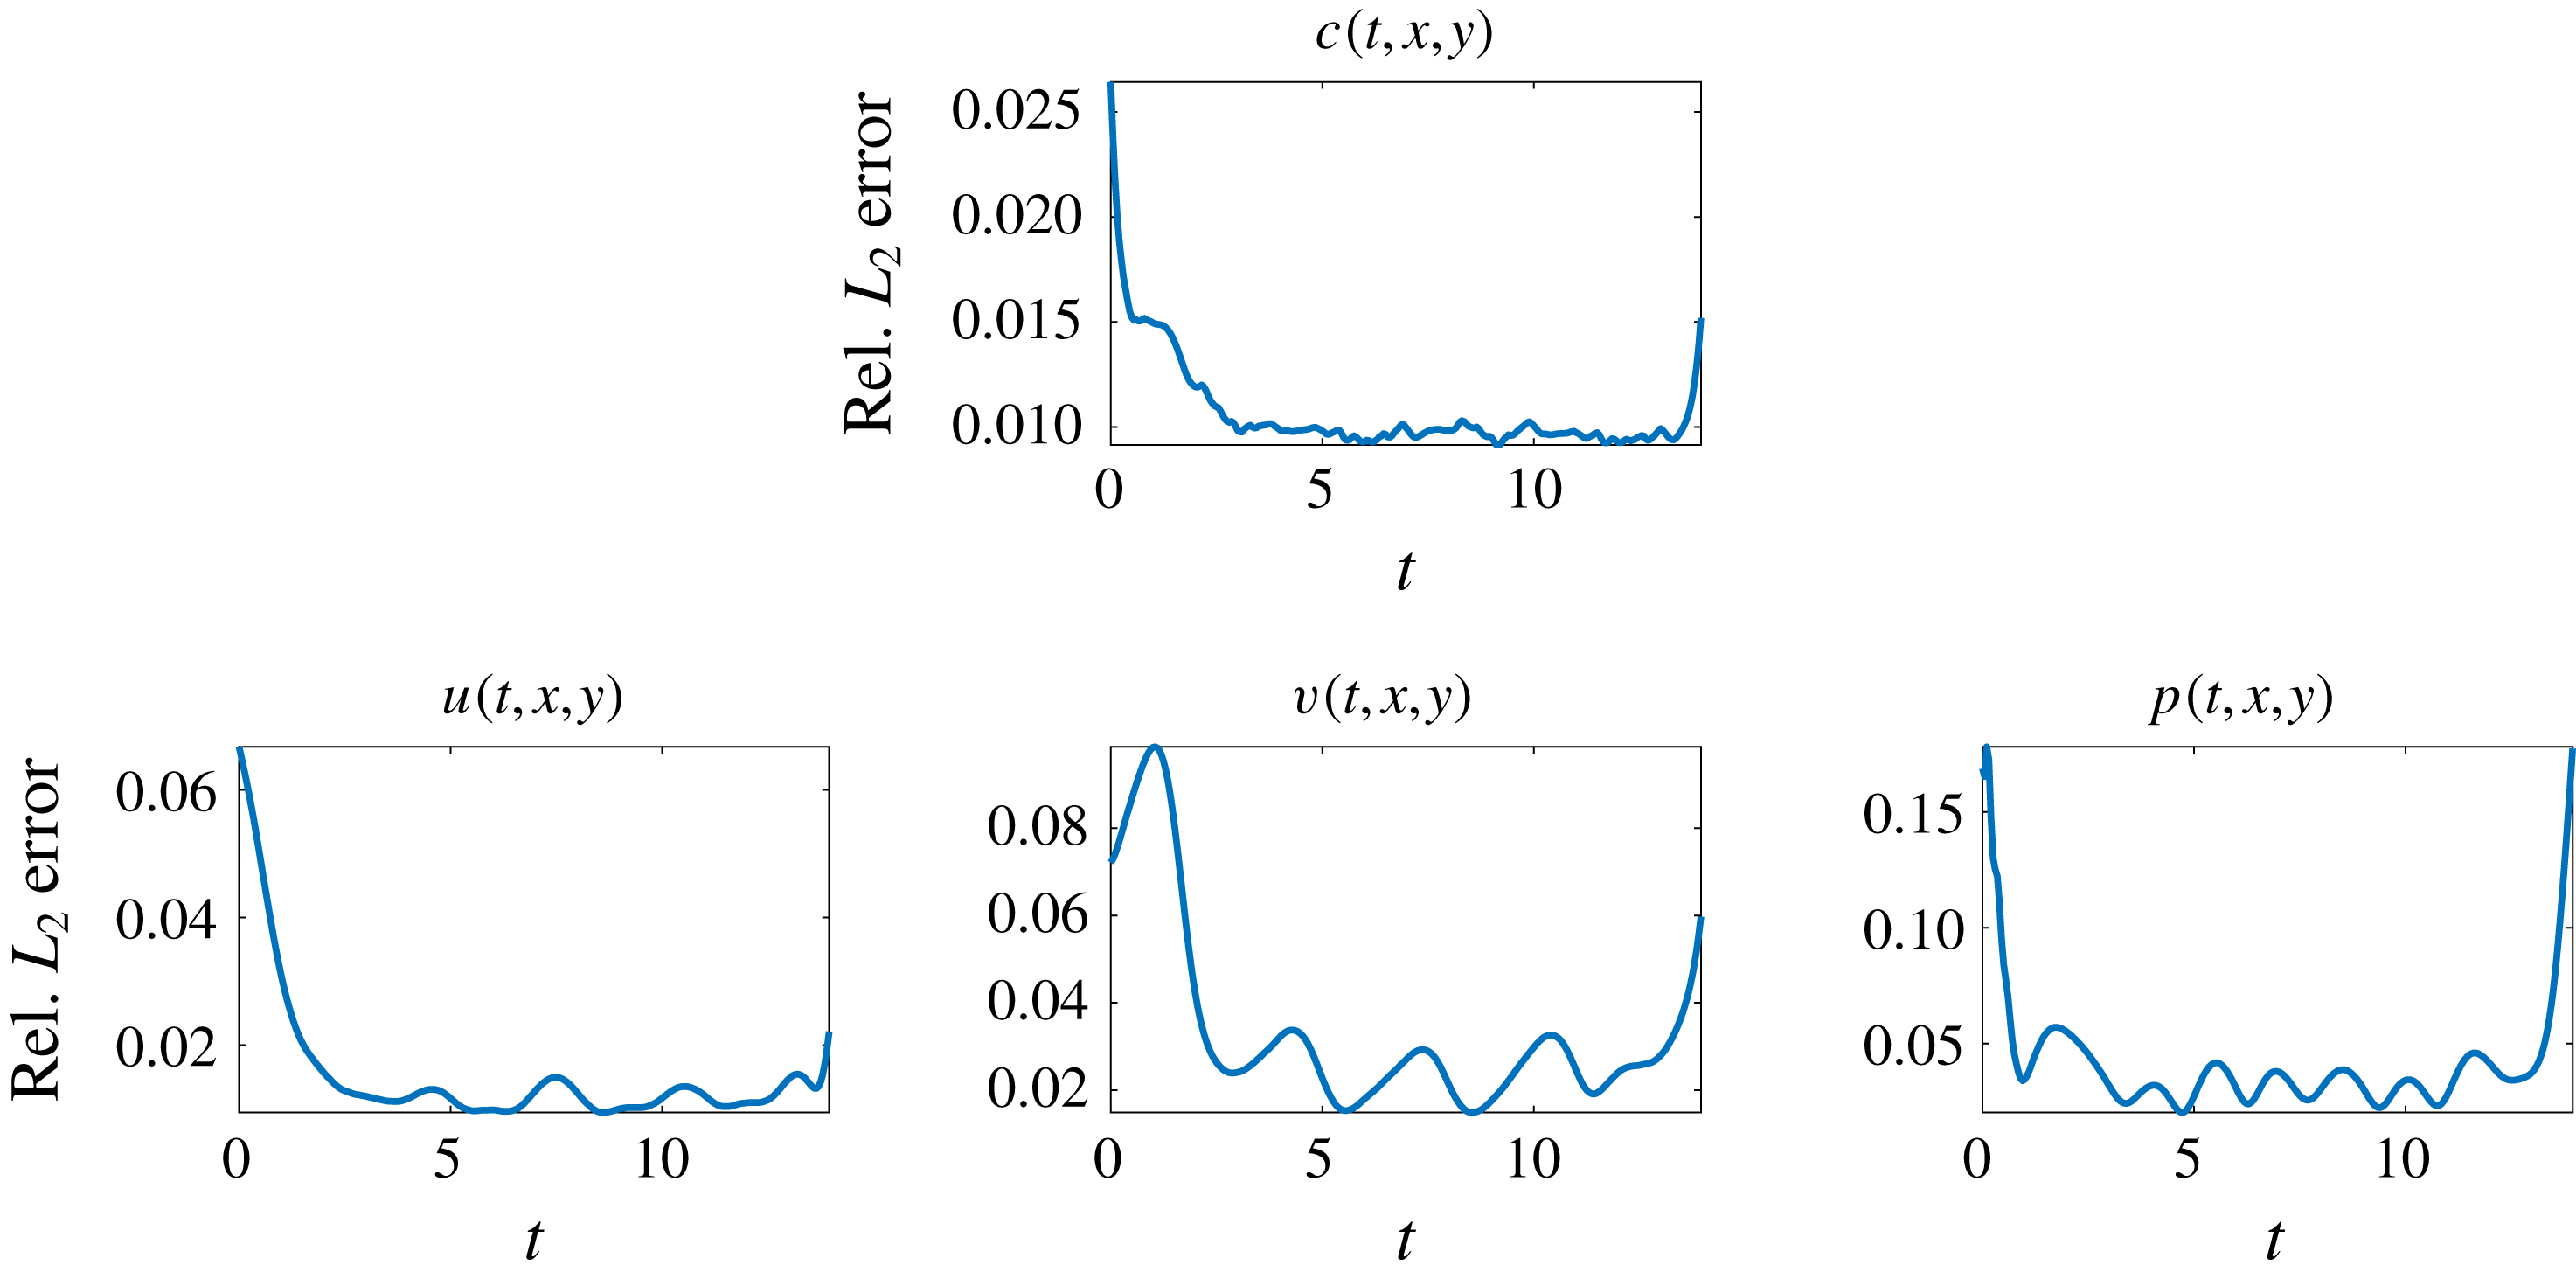
VIV-II (flow visualizations data): relative
 $L_{2}$
errors between predictions of the model and the corresponding exact velocity and pressure fields. Four million data points corresponding to 280 time snapshots, scattered in space and time, are used to both regress the concentration field and enforce the corresponding partial differential equations. Lack of training data on
 $c$
for
 $t<0$
and
 $t>14$
leads to weaker neural network predictions for the initial and final time instants. Here, it should be emphasized that the mechanism at work is ‘regression’, not ‘interpolation’. In a regression framework, lack of training data for times
 $t<0$
and
 $t>14$
directly affects the accuracy of predictions made at and near times
 $t=0$
and
 $t=14$
.

VIV-II (flow visualizations data): the resulting lift (a) and drag (b) forces are compared to the exact ones.

3.3 Inferring lift and drag forces from flow visualizations
Let us continue with the case where we do not have access to direct observations of the lift force
 $f_{L}$
. This time rather than using data on the velocity field, we use measurements of the concentration of a passive scalar (e.g. dye or smoke) injected into the system. In the following, we are going to employ such data to reconstruct the velocity field, the pressure and consequently the drag and lift forces. A representative snapshot of the data on the concentration of the passive scalar is depicted in the top left panel of figure 9. The neural network architectures used here consist of 10 layers with 32 neurons per hidden layer per output variable. A summary of our results is presented in figure 9. The proposed framework is capable of accurately (of the order of
 $10^{-3}$
) reconstructing the concentration. However, a truly intriguing result stems from the network’s ability to provide accurate predictions of the entire velocity vector field as well as the pressure, in the absence of sufficient training data on the pressure and the velocity field themselves (see figure 10). A visual comparison against the exact quantities is presented in figure 9 for a representative snapshot of the velocity field and the pressure. This result of inferring multiple hidden quantities of interest from auxiliary measurements by leveraging the underlying physics is a great example of the enhanced capabilities that physics-informed deep learning has to offer, and highlights its potential in solving high-dimensional data-assimilation and inverse problems (see e.g. Raissi, Yazdani & Karniadakis Reference Raissi, Yazdani and Karniadakis2018).
Following the same procedure as in the previous example, the trained neural networks representing the velocity field and the pressure can be used to compute the drag and lift forces by employing (2.7) and (2.8), respectively. The resulting drag and lift forces are compared to the exact ones in figure 11. In the following, we are going to use the computed lift force to generate the required training data on
 $f_{L}$
and estimate the structural parameters
 $b$
and
 $k$
by minimizing the loss function (2.3). Upon training, the proposed framework is capable of identifying the correct values for the structural parameters
 $b$
and
 $k$
with surprising accuracy. The learned values for the damping and stiffness parameters are
 $b=0.08600664$
and
 $k=2.2395933$
. This corresponds to around 2.39 % and 1.71 % relative errors in the estimated values for
 $b$
and
 $k$
, respectively.
As for the training procedure, our experience so far indicates that while training deep neural networks it is often useful to reduce the learning rate as the training progresses. Specifically, the results reported in §§ 3.2 and 3.3 are obtained after 200, 300, 300 and 200 consecutive epochs of the Adam optimizer (Kingma & Ba Reference Kingma and Ba2014) with learning rates of
 $10^{-3}$
,
 $10^{-4}$
,
 $10^{-5}$
and
 $10^{-6}$
, respectively. Each epoch corresponds to one pass through the entire dataset. The total number of iterations of the Adam optimizer is therefore given by 1000 times the number of data divided by the mini-batch size. The mini-batch size we used is 10 000 and the number of data points is clearly specified in the captions of figures 7 and 10.
4 Discussion and concluding remarks
We have considered the classical coupled problem of a freely vibrating cylinder due to lift forces and demonstrated how physics-informed deep learning can be used to infer quantities of interest from scattered data in space–time. In the first VIV learning problem, we inferred the pressure field and structural parameters, and hence the lift and drag on the vibrating cylinder using velocity and displacement data in space–time. In the second VIV learning problem, we inferred the velocity and pressure fields as well as the structural parameters given data on a passive scalar in space–time. The framework we propose here represents a paradigm shift in fluid mechanics simulation as it uses the governing equations as regularization mechanisms in the loss function of the corresponding minimization problem. It is particularly effective for multi-physics problems as the coupling between fields can be readily accomplished by sharing parameters among the multiple neural networks – here a neural network outputting four variables for the first problem and five variables for the second one – and for more general coupled problems by also including coupled terms in the loss function. There are many questions that this new type of modelling raises, both theoretical and practical, e.g. efficiency, solution uniqueness, accuracy, etc. We have considered such questions here in the present context as well as in our previous work in the context of physics-informed learning machines, but admittedly at the present time it is not possible to rigorously answer such questions. We hope, however, that our present work will ignite interest in physics-informed deep learning that can be used effectively for many different fields of multi-physics fluid mechanics.
Moreover, it must be mentioned that we are avoiding the regimes where the Navier–Stokes equations become chaotic and turbulent (e.g. as the Reynolds number increases). In fact, it should not be difficult for a plain vanilla neural network to approximate the types of complicated functions that naturally appear in turbulence. However, as we compute the derivatives required in the computation of the physics informed neural networks (see figures 1, 2 and 4), minimizing the loss functions might become a challenge (Raissi Reference Raissi2018a ), where the optimizer may fail to converge to the right values for the parameters of the neural networks. It might be the case that the resulting optimization problem inherits the complicated nature of the turbulent Navier–Stokes equations. Hence, inference of turbulent velocity and pressure fields should be considered in future extensions of this line of research. Moreover, in this work we have been operating under the assumption of Newtonian and incompressible fluid flow governed by the Navier–Stokes equations. However, the proposed algorithm can also be used when the underlying physics is non-Newtonian, compressible or partially known. This, in fact, is one of the advantages of our algorithm in which other unknown parameters such as the Reynolds and Péclet numbers can be inferred in addition to the velocity and pressure fields.
Acknowledgements
This work received support from DARPA EQUiPS grant N66001-15-2-4055 and AFOSR grant FA9550-17-1-0013. All data and codes used in this paper are publicly available on GitHub at https://github.com/maziarraiss/DeepVIV.