1. Introduction
The violent expansion of a liquid bubble filled with a gas mixture undergoing an exothermic reaction is a prototypical configuration for the explosion of cohesive materials in three dimensions.
We study here the explosion and fragmentation of a liquid bubble formed by the capillary pinch off of a thin liquid annular jet surrounding a jet of a gaseous hydrogen and oxygen mixture at ambient pressure. When ignited, the mixture confined in the bubble undergoes a strongly exothermic chemical reaction producing hot expanding burnt gases which violently accelerate the liquid shell. That accelerated motion triggers the instability of the shell, which develops thickness modulations ultimately piercing it in a number of places. The capillary retraction of the holes concentrates the liquid constituting the shell into a web of ligaments, whose breakup leads to stable drops.
This experiment is the three-dimensional analogue with liquids of the ring configuration initially imagined by Mott (Reference Mott1947) for solids in two dimensions (see also Grady Reference Grady2007; Zhang & Ravi-Chandar Reference Zhang and Ravi-Chandar2007, Reference Zhang and Ravi-Chandar2008). This problem, in which the fragments’ distribution is the result of a competition between deformation, breakup and cohesion, is relevant to a collection of phenomena spanning over a broad range of length scales, among which are: exploding blood cells in the human body, spore dispersal from plants (Ingold Reference Ingold1933, Reference Ingold1971; Hassett et al. Reference Hassett, Fischer, Sugawara, Stolze-Rybczynski and Money2013), boiling droplets (Frost Reference Frost1988), underwater explosions (Cole Reference Cole1948), magma eruption in volcanoes (Kedrinskii Reference Kedrinskii2009) and the torn patterns of supernovae in the Universe (Burrows Reference Burrows2000). Case shells and bombs are obvious examples for which a precise prediction of the final fragment sizes as a function of the energy released by the explosion, and of the properties of the enclosing envelope, is desired (Zeldovich & Raizer Reference Zeldovich and Raizer2002; Kedrinskii Reference Kedrinskii2005; Frost et al. Reference Frost, Ornthanalai, Zarei, Tanguay and Zhang2007).
The problem examined here however, is different from the supersonic limit described before by, in particular, Sedov (Reference Sedov1946) and Taylor (Reference Taylor1950); the propagating flame in the hydrogen/oxygen mixtures employed here remains subsonic and is not a ‘very intense explosion’ (Taylor Reference Taylor1950) but rather a gentle deflagration, as underlined by Marangoni & Stefanelli (Reference Marangoni and Stefanelli1873) (§ 7, p. 254; english translation from the original Italian by the authors):
Explosive gas. It is well known from all those who teach physics and chemistry that, to demonstrate the explosive property of a mixture composed of two volumes of hydrogen and one volume of oxygen, the most spectacular effect is obtained, without any danger, from the ignition by a firing wick of a soap bubble inflated with the mixture as it ascends in air.
Concerning the fundamentals in fragmentation science (Villermaux Reference Villermaux2007), the interest of the present configuration is that the course of events can be followed step by step and in real time, from an initially connex cohesive material (here a liquid shell) to its dispersion into a collection of stable fragments, each step being subjected to a precise description. The propagation of the flame deflagration inside the confined space of the bubble results in a sudden expansion of the shell, which is violently accelerated outwards. The dense spherical shell is sandwiched between two media with lighter densities (the inner unburnt gases and the outer ambient air), so that, being accelerated radially, it is liable to develop an inertial instability in the sense of Rayleigh–Taylor (Chandrasekhar Reference Chandrasekhar1961). The development of this instability is, however, altered by the presence of two close-by density interfaces, a proximity which is stabilizing (Keller & Kolodner Reference Keller and Kolodner1954), as first demonstrated experimentally by Bremond & Villermaux (Reference Bremond and Villermaux2005). However, by contrast with this earlier study using a planar geometry and a very thin liquid (soap) film accelerated perpendicular to its plane, we use here an original method to make shells ten times thicker and have access to the dispersion of the final droplets whose distribution can be quantified. Overall, we offer a comprehensive description of a fragmentation scenario, free from uncontrolled assumptions, in the spirit of the study conducted by Lhuissier & Villermaux (Reference Lhuissier and Villermaux2013) on free liquid sheets nucleating holes at random (so-called ‘effervescent’ atomization).
We first describe our method for making thick liquid shells and the properties of the reactive mixture and visualization tools in § 2. The phenomenology of the shell expansion, destabilization and bursting is exposed in § 3. Then, elements of theory to understand the expansion dynamics of the shell are discussed in § 4, while the stability of the motion is presented in § 5. The fragments produced by the explosion are documented in § 6.
2. Liquid shells and experimental methods
2.1. Liquid shells
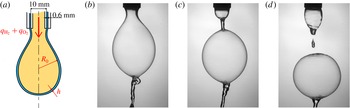
Liquid shells confining the reactive hydrogen–oxygen gas mixture were realized by a method originally suggested and studied by Kendall (Reference Kendall1986). A thin (0.6 mm gap) annular liquid jet surrounds a thick (10 mm in diameter) jet carrying the premixed gaseous mixture, as seen in figure 1. Under certain conditions of relative exit velocities of the liquid and gas streams, the outer tubular liquid jet pinches off by a capillary instability (see e.g. § 3.4 in Eggers & Villermaux (Reference Eggers and Villermaux2008)) into a train of liquid bubbles of radius
 $R_{0}$
, whose entrapped volume
 $(4/3){\rm\pi}R_{0}^{3}$
and shell thickness
 $h$
depend on the ratio of the liquid to gas flowrates. The process is described in figure 2.
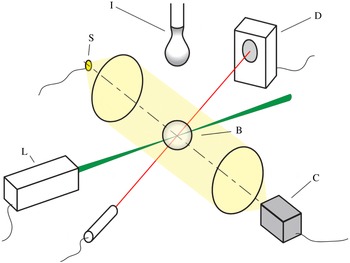
Sketch of the experimental setup. The bubble (B) formed by the injection tube (I) is detected by a diode (D) when it arrives at the firing location where a pulsed Nd:YaG laser (L) ignites the mixture. The liquid shell expansion and bursting is recorded by a fast camera (C) located at the focal point of a Schlieren apparatus made of two 8 cm in diameter and 31 cm in focal length lenses, and a 3 W white light source (S).

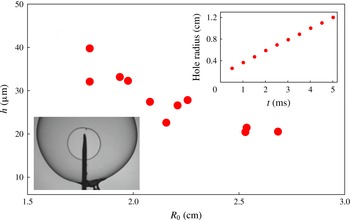
For given flowrates, the shell thickness was measured by puncturing a bubble, just after it is formed, with a needle and by recording the resulting hole opening velocity (figure 3), relating it to the shell thickness by the Taylor–Culick (Taylor Reference Taylor1959; Culick Reference Culick1960) relationship
 $$\begin{eqnarray}v_{TC}=\sqrt{\frac{2{\it\sigma}}{{\it\rho}h}},\end{eqnarray}$$
where
 ${\it\sigma}=50$
N m
 $^{-1}$
is the liquid surface tension and
 ${\it\rho}=1.06\times 10^{3}$
kg m
 $^{-3}$
its density. We do not use pure water as a working liquid for the following reason: the pinch-off events at the poles during the birth of a bubble propagate capillary waves at its surface (visible in figure 2
c) and, notably, varicose waves causing thickness modulations of the shell. This is particularly visible with pure water. Therefore, in order to study the bursting of shells whose thickness is initially as uniform as possible (we will show how critical this aspect is in § 5), we premix a small quantity of glycerol (20 % in volume) in the water liquid stream. The resulting slight increase of liquid viscosity (a factor 2 with respect to water) is enough to damp the capillary waves and make the shells smoother. The addition of glycerol alters liquid surface tension and density accordingly. Keeping, for instance, the gas flowrate constant, and varying that of the liquid, various shells are obtained, with the relationship of their initial radii and thicknesses shown in figure 3.
Details of the coaxial tube used to make the liquid shells. The outer and inner tubes are 11.2 mm and 10 mm in diameter, respectively. The inner tube conveys the gas mixture at flowrate
 $q_{\text{H}_{2}}+q_{\text{O}_{2}}$
. Through the 0.6 mm in width gap flows the liquid. The shell formation process is illustrated in three successive pictures. At
 $t=0$
the gas starts filling the bubble, at
 $t=0.023$
s the capillary instability of the cylindrical liquid envelope pinches off the extremity of the bubble, which detaches at
 $t=0.046$
s, with a radius
 $R_{0}=20$
mm and thickness
 $h$
of a few tens of microns. The net gas flowrate is 3 l min
 $^{-1}$
, and the liquid flowrate is 2 l min
 $^{-1}$
.

Relationship between the shell thickness
 $h$
(in microns) versus their formation radius
 $R_{0}$
(in cm) as measured through the Taylor–Culick velocity of a hole made on the shell by a needle (lower inset). The gas flowrate was maintained constant (3 l min
 $^{-1}$
), and that of the liquid varied. The hole radius is linear in time (upper inset), giving
 $v_{TC}=2.21$
m s
 $^{-1}$
corresponding to
 $h\approx 21~{\rm\mu}$
m for
 $R_{0}=26$
mm.

The experiments reported here which have lead to a full documentation of the shell fragments (stable droplets) have been made with bubbles whose radius
 $R_{0}$
is about 25 mm corresponding to a thickness
 $h$
of the order of
 $20~{\rm\mu}$
m, obtained for a gas flowrate of 3 l min
 $^{-1}$
using the method described above. Other experiments, mainly devoted to the study of the flame propagation inside the bubble, and to the initial dynamics of the shell, were made using a simple hemispherical soap bubble inflated at the surface of a Petri dish with the gas mixture. These bubbles have a comparable radius, and are typically much thinner, with
 $h\approx 2{-}4~{\rm\mu}$
m. The droplets formed from these soap bubbles were too small to be measured accurately.
2.2. Reactive mixture and ignition
The coaxial tube used for the formation of the bubbles is fed as follows: the liquid (water plus 20 % glycerol) flows by gravity from a reservoir at the desired flowrate in the annular gap. The gaseous hydrogen/oxygen mixture is conveyed in the inner tube through a mixing chamber at the desired relative proportions. The chamber is fed by pressurized bottles of the pure substances, and the flowrates of hydrogen
 $q_{\text{H}_{2}}$
and oxygen
 $q_{\text{O}_{2}}$
are set by precision flowmeters. The chemical reaction
 $$\begin{eqnarray}\text{H}_{2}+{\textstyle \frac{1}{2}}\text{O}_{2}\longrightarrow \text{H}_{2}\text{O}\end{eqnarray}$$
is exothermic (the formation enthalpy of water vapour is
 ${\rm\Delta}H=-241$
kJ mol
 $^{-1}$
, see Lide (Reference Lide2004)), and produces water vapour
 $\text{H}_{2}\text{O}$
plus free radicals like
 $\text{H}\cdot$
and
 $\text{OH}\cdot$
, remnants of
 $\text{H}_{2}$
and
 $\text{O}_{2}$
, to which is added traces of atomic hydrogen and oxygen, and non-condensable species. When the combustion occurs at atmospheric pressure, the temperature of the products is typically 3000 K, depending on the equivalence ratio of the initial mixture (Morley Reference Morley2005). The reaction thus forms hot burnt gases at density
 ${\it\rho}_{b}$
lighter than the unburnt mixture at density
 ${\it\rho}_{u}$
. The equivalence ratio of the mixture is defined from the stoichiometry of the reaction by
 $$\begin{eqnarray}{\it\phi}=\frac{2\,q_{\text{H}_{2}}}{q_{\text{O}_{2}}}.\end{eqnarray}$$
A stoichiometric mixture has
 ${\it\phi}=1$
, a lean mixture has
 ${\it\phi}<1$
and a mixture is said to be rich when
 ${\it\phi}>1$
. At
 ${\it\phi}=1$
and if
 ${\it\rho}_{\infty }=1.2$
kg m
 $^{-3}$
denotes the density of the surrounding ambient air, one has
 ${\it\rho}_{u}\approx {\it\rho}_{\infty }/3$
and
 ${\it\rho}_{u}/{\it\rho}_{b}\approx 8$
.
Once formed, the bubble confining the mixture falls freely in the ambient air, and its passage at the firing location is detected by a photodiode, which at that very moment triggers a 195 mJ pulse from a YaG laser, lasting for 8 ns. The plasma formed by the laser beam focalized at the bubble centre ignites the reaction (Bradley et al. Reference Bradley, Sheppard, Suardjaja and Wooley2004; Srivastava et al. Reference Srivastava, Weinrotter, Iskra, Agarwal and Wintner2009). Thus, a spherical deflagration grows isotropically from the centre of the bubble to its confining liquid shell.
2.3. Visualization method
The injection/ignition apparatus is placed at the centre of a Schlieren system (Settles Reference Settles2001) made of two 8 cm in diameter and 31 cm in focal length achromatic lenses, a 3 W white diode as the source and a knife at the focal point on the visualization side, realizing a 1 m long parallel light space in-between. This method, which highlights density (index of refraction) gradients, is useful for visualizing the location of the very faint flame which cannot be seen in simple back-lit views which are sensitive to the second derivative of the density field only (figure 4). Therefore, this method allows one to record, in a single experiment, both the flame and liquid shell dynamics, as seen in figures 5 and 8 (see also Leblanc et al. (Reference Leblanc, Manoubi, Dennis, Liang and Radulescu2013) in a related context).
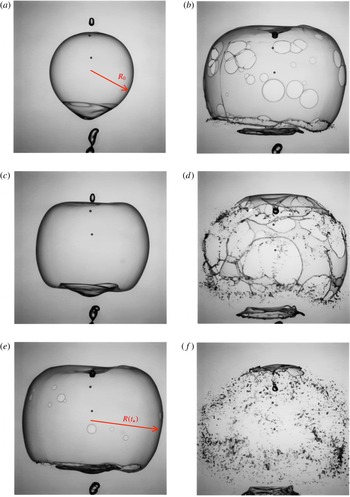
Fragmentation of a liquid shell with initial radius
 $R_{0}=2.5$
cm by the combustion of a mixture at
 ${\it\phi}=5$
, showing sequentially the instant of last pulse at
 $t=0$
, the shell expansion at
 $t=0.003$
s, the onset of the shell piercing at
 $t=t_{\star }=0.0045$
s, the nucleation and coalescence of the holes at
 $t=0.006$
s, the formation of a web of ligaments at
 $t=0.009$
s and finally the breakup of the ligaments in a dispersion of droplets at
 $t=0.012$
s.

3. Phenomenology
The hot plasma from the laser beam focalized at the centre of the liquid shell ignites the mixture. The reaction zone forms a thin density and temperature discontinuity which propagates towards the fresh mixture, leaving behind burnt gases. This propagating deflagration replaces at its passage three molecules of unburnt fresh mixture by two molecules of hot light burnt gases according to (2.2). These being much lighter, they occupy a relatively larger volume, hence the expansion of the volume contained in the bubble. That expansion pushes the liquid shell radially outwards in a violently accelerated motion to be analysed in § 4. Associated to this acceleration is the destabilization of the shell itself, through an inertial instability described in § 5. This instability results in thickness modulations of the shell which grow to ultimately pierce the shell. The holes grow in radius by capillary retraction, accumulating the liquid of the shell into their rim, which merge with the rim of the neighbouring hole, finally leaving the shell as a web of ligaments, which break by capillary instability.
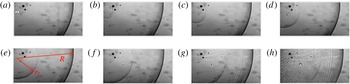
Sequence showing the concomitant development of the flame with radius
 $r_{f}$
and of the liquid shell with radius
 $R$
from the ignition time by steps of
 ${\rm\Delta}t=5\times 10^{-5}$
s for a mixture equivalence ratio
 ${\it\phi}=1.7$
. Note the blurring of the shell on the last image, showing the onset of the shell instability and consecutive thickness modulations. See also figure 6 for a close up front view highlighting the instability in similar conditions.

Close up (8.5 mm
 $\times$
8.5 mm) of a shell undergoing a strong expansion at
 ${\it\phi}=0.7$
. The initial smooth shell suffers thickness modulations at a time
 $t=2.5\times 10^{-4}$
s after the laser has ignited the mixture. A regular network of ligaments (central image) is visible at
 $t=3.12\times 10^{-4}$
s of typical cell size
 ${\it\lambda}\approx 0.5$
mm. At time
 $t=5.62\times 10^{-4}$
s, the ligaments have destabilized into a collection of drops with average diameter
 $\langle d\rangle \approx 150~{\rm\mu}$
m. Note, by contrast with expansions at a larger mixture equivalence ratios (
 ${\it\phi}>3$
), the regular character of the hole network.

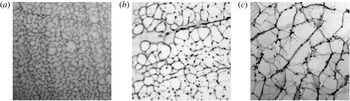
Figures 4 and 14 show the fragmentation of a shell whose radial expansion is forced by a rich mixture (
 ${\it\phi}=5$
). The dynamics is, in that case, relatively slow (the shell has burst in about 10 ms). If the same experiment is made with a mixture initially closer to stoichiometry (
 ${\it\phi}=0.7$
) as in figure 6, the expansion dynamics is much faster and fragmentation is completed in a time interval 10 times shorter. In both cases the sequence of events is similar (flame propagation, expansion of the shell, destabilization, holes formation, ligaments and final droplets), but the average density of holes is much larger when the expansion is faster. Correspondingly, the final droplet size is smaller.
3.1. Flame velocity
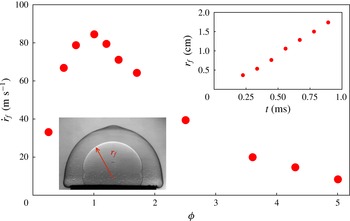
Flame propagation speed (in a fixed frame)
 ${\dot{r}}_{f}$
as a function of the mixture equivalence ratio
 ${\it\phi}$
. Velocities are measured by igniting the mixture at the centre of a soap bubble with
 $h=4~{\rm\mu}$
m (lower inset) and by recording its position versus time (upper inset), obtained here for an equivalence ratio
 ${\it\phi}=3.6$
(
 ${\dot{r}}_{f}\approx 20$
m s
 $^{-1}$
).

The combustion of hydrogen with oxygen is exothermic, and since the reaction rate is strongly dependent on temperature through an Arrhenius term, reaction essentially occurs in a thin region whose thickness is limited by the ability of heat to diffuse in the fresh mixture. This defines a flame, which progresses at constant velocity
 $u_{f}$
in the unburnt gases (see Zeldovich & Frank-Kamenetskii Reference Zeldovich and Frank-Kamenetskii1938; Landau & Lifshitz Reference Landau and Lifshitz1987). If the flame delimits a sphere with radius
 $r_{f}$
of stagnant burnt gases (
 $u_{b}=0$
, see also (4.7)), the evolution of the radius is given by mass conservation
 $$\begin{eqnarray}r_{f}(t+{\it\delta}t)=r_{f}(t)+u_{f}\frac{{\it\rho}_{u}}{{\it\rho}_{b}}\,{\it\delta}t\end{eqnarray}$$
or
 $$\begin{eqnarray}{\dot{r}}_{f}=\frac{{\it\rho}_{u}}{{\it\rho}_{b}}u_{f}.\end{eqnarray}$$
Flame speeds, for mixtures enclosed in soap bubbles, have been measured varying the mixture equivalence ratio
 ${\it\phi}$
. One sees from figure 7 that the speed is strongly dependent on
 ${\it\phi}$
, with a maximum about the stoichiometry
 ${\it\phi}\approx 1$
, consistent with earlier observations on different setups (Senior Reference Senior1961; Zitoun & Deshaies Reference Zitoun and Deshaies1997). The flame propagates more slowly in lean and rich mixtures, and extinction of the flame (or, the impossibility to ignite the mixture), occurs for
 ${\it\phi}$
lower than 0.1, and larger than about 7 (Lewis & von Elbe Reference Lewis and von Elbe1961).
We have
 ${\dot{r}}_{f}\approx 70$
m s
 $^{-1}$
for a mixture with
 ${\it\phi}=1.7$
, and
 ${\dot{r}}_{f}\approx 8$
m s
 $^{-1}$
for
 ${\it\phi}=5$
. The flame propagates nearly 10 times faster in a near-stoichiometric mixture as compared to a rich mixture at
 ${\it\phi}=5$
, reminiscent of the corresponding factor of 10 in the kinetics of the overall fragmentation process noticed above.
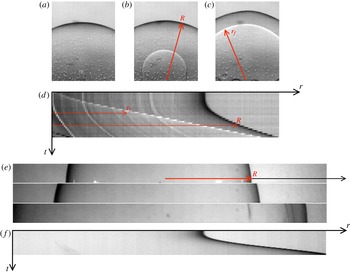
Interfaces dynamics and tracking. (a–d) A soap bubble with
 $R_{0}=19.6$
mm and
 ${\it\phi}=3.6$
at the instant of the laser pulse at
 $t=0$
, at
 $t=0.6$
ms and
 $t=1.2$
ms showing the flame propagation (radius
 $r_{f}$
) and the shell expansion (radius
 $R$
). The corresponding spatio-temporal diagram displays the flame and shell trajectories. (b,e,f) Same sequence for a liquid bubble with
 $R_{0}=24.2$
mm shown at the instant of the laser pulse,
 $t=1$
ms and
 $t=2$
ms after, and corresponding spatio-temporal diagram from which the trajectory in figure 9 is extracted.

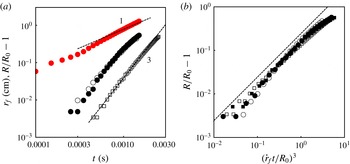
(a) Raw trajectories as a function of time of the flame front and of the shells for various mixture equivalence ratios
 ${\it\phi}$
, and shell thickness. Red filled circles: flame radius
 $r_{f}$
in cm for
 ${\it\phi}=3.6$
. Black circles: radius
 $R$
of a soap bubble relative to its initial value
 $R_{0}=19.6$
mm at
 ${\it\phi}=3.6$
. Black filled circles: radius of a liquid shell with
 $R_{0}=24.2$
mm at
 ${\it\phi}=3.6$
. Squares: radius of a liquid shell with
 $R_{0}=25.8$
mm and
 ${\it\phi}=4.3$
. We have
 $r_{f}\sim t$
and
 $R/R_{0}-1\sim t^{3}$
, with a pre-factor depending on
 ${\it\phi}$
. (b) Scaled liquid shell radii versus the cube of the dimensionless time
 ${\dot{r}}_{f}t/R_{0}$
. Empty circles:
 ${\it\phi}=4.3$
, filled circles:
 ${\it\phi}=3.6$
, filled squares:
 ${\it\phi}=1.7$
and empty squares:
 ${\it\phi}=0.7$
. The dashed line is the expectation from (4.25).

3.2. Shell expansion and destabilization
The concomitant recordings of the flame and liquid shell expansions, shown for instance in figure 8, reveal that if the flame radius grows proportionally to time, indeed in agreement with (3.2), the trajectory of the liquid interface is very different, and is such that
 $$\begin{eqnarray}R-R_{0}\propto t^{3}\end{eqnarray}$$
with a pre-factor independent of the shell thickness
 $h$
and strongly dependent on the equivalence ratio
 ${\it\phi}$
: figure 9 shows that a thick liquid shell with
 $h\approx 20~{\rm\mu}$
m has an expansion very similar to that of a soap bubble with
 $h\approx 4~{\rm\mu}$
m when both are forced by the deflagration of a mixture with
 ${\it\phi}=3.6$
. However, the dynamics of the shell radius
 $R(t)$
is slower, although still proportional to
 $t^{3}$
when forced by a mixture at
 ${\it\phi}=4.3$
. The ratio of the flame speeds corresponding to these two values of
 ${\it\phi}$
is 1.5 while the shell expansion rate with the richest mixture is 3 times smaller.
The destabilization of the shell is more rapid when the flame velocity is faster: not only is the destabilization time
 $t_{\star }$
shorter, but the destabilization radius
 $R(t_{\star })$
relative to its initial radius
 $R_{0}$
is also smaller.
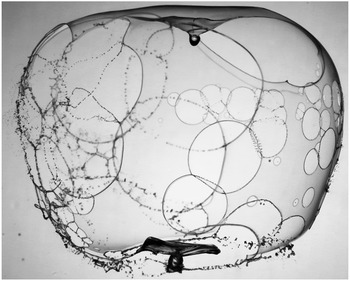
Finally, once the holes are formed, they grow by capillary retraction according to (2.1), accumulating the liquid constituting the shell into their rim. Rims then collide with the rims of the neighbouring holes, leaving the shell as a web of ligaments, breaking by capillary instability (figures 4, 12 and 14). Depending on the distance two rims have travelled before merging (and thus depending on the mass they carry), their collision may result in a simple smooth merger, or in a corrugated ligament if the holes were more distant, and even in the formation of a transverse sheet itself producing smaller drops when the holes were far apart (figures 12 and 14). This phenomenology was described in a related context by Lhuissier & Villermaux (Reference Lhuissier and Villermaux2013) and will be shown in § 6 to have important consequences on the size distribution of the fragments.
4. Expansions dynamics
The expansion of the flame front is fully described by equation (3.2): the radius
 $r_{f}$
of the spherical flame increases linearly in time, at a speed which, through
 $u_{f}$
, depends on the equivalence ratio
 ${\it\phi}$
. If the flame is ignited at a point, we have
 $$\begin{eqnarray}r_{f}={\dot{r}}_{f}t.\end{eqnarray}$$
Since the burnt gases are much lighter than the fresh mixture and are released on the inner confined side of the flame, they must expand, and by doing so, push the different phases ahead of the flame front. These are, successively at increasing distances from the flame, the envelope of the remaining fresh gases, the liquid shell and the ambient air. The radial motion of these inertial phases is thus made at the expense of an elevation of pressure in the burnt gases with respect to the initial ambient pressure.
However, the expanding motion has typical velocities which are small compared to that of sound in the unburnt gases at
 $20\,^{\circ }\text{C}$
(
 $c_{u}\approx 550$
m s
 $^{-1}$
in a stoichiometric mixture), in the outer air (
 $c_{\infty }\approx 340$
m s
 $^{-1}$
) and even more to that in the liquid shell (
 $c\approx 1000$
m s
 $^{-1}$
). Indeed, the flame radius velocity
 ${\dot{r}}_{f}$
is never larger than 100 m s
 $^{-1}$
, as seen in figure 7. Therefore, we do not expect the formation of shock waves. Moreover, the pressure elevation necessary to drive the motion in the fresh mixture is, relative to the ambient pressure itself, of the order of
 $({\dot{r}}_{f}/c_{u})^{2}$
, the square of a Mach number which is small compared to unity.
Thus, the low Mach number limit characteristic of the flow velocity field
 $\boldsymbol{u}$
suggests that a nearly incompressible description
 $$\begin{eqnarray}\boldsymbol{{\rm\nabla}}\boldsymbol{\cdot }\boldsymbol{u}\approx 0\end{eqnarray}$$
will be a fair approximation of the problem, in all phases. Consequently, if
 $\boldsymbol{u}=u\,\boldsymbol{e}_{r}$
denotes the spherical radial expansion velocity, depending on the distance to the ignition point
 $r$
and time
 $t$
only, and if
 $R(t)$
is the (outer) position of the liquid shell, we have
 $$\begin{eqnarray}u=\left(\frac{R}{r}\right)^{2}{\dot{R}}\end{eqnarray}$$
but also, since the kinematic condition at the flame surface is
 $u(r_{f})={\dot{r}}_{f}-u_{f}$
,
 $$\begin{eqnarray}u=\left(\frac{r_{f}}{r}\right)^{2}({\dot{r}}_{f}-u_{f}).\end{eqnarray}$$
The compatibility between the two velocity fields (4.3) and (4.4), when enforced by the global incompressibility condition (4.2) infers a motion of the liquid shell as
 $$\begin{eqnarray}R^{3}-R_{0}^{3}=\left(1-\frac{{\it\rho}_{b}}{{\it\rho}_{u}}\right)r_{f}^{3}.\end{eqnarray}$$
If (4.5) anticipates the correct scaling (3.3) at short time, it overestimates slightly the observed shell radius trajectory and, most importantly, fails at accounting for any effects possibly delaying its motion like, in particular, the shell inertia (see in this respect Takeno Reference Takeno1985). A more detailed analysis is thus required.
4.1. Orders of magnitudes
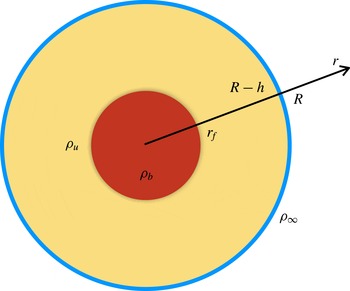
We first discuss why the pressure jump across the flame front (also called recoil pressure), the capillary pressure caused by the presence of liquid interfaces and the viscous stresses, both in the moving gas and in the liquid shell, are negligible in practice. Figure 10 shows the geometry of the system.
Sketch of the liquid shell (external radius
 $R$
and thickness
 $h$
) enclosing the reactive mixture with density
 ${\it\rho}_{u}$
, the flame with radius
 $r_{f}$
and the burnt gases with density
 ${\it\rho}_{b}$
. The outside ambient air has density
 ${\it\rho}_{\infty }$
.

The order of magnitude of the pressure induced by a moving flame in an otherwise quiescent environment is the stagnation pressure based on
 ${\dot{r}}_{f}$
 $$\begin{eqnarray}p_{f}\sim {\it\rho}_{u}{\dot{r}}_{f}^{2}.\end{eqnarray}$$
It is, as shown below, the dominant driving force of the liquid shell radial expansion.
4.1.1. Recoil pressure
The pressure jump at the flame front originates from the continuity of the mass and momentum fluxes across the flame, treated here as a discontinuity of density and normal velocity (Landau & Lifshitz Reference Landau and Lifshitz1987). The flame propagates at velocity
 ${\dot{r}}_{f}$
in a fixed frame and at velocity
 $u_{f}$
with respect to the fresh gases. Thus the mass flux absorbed by it is
 ${\dot{m}}={\it\rho}_{u}({\dot{r}}_{f}-u_{f}-{\dot{r}}_{f})=-{\it\rho}_{u}u_{f}$
. Momentum conservation is written
 $$\begin{eqnarray}p_{b}+{\dot{m}}(u_{b}-{\dot{r}}_{f})=p_{f}+{\dot{m}}({\dot{r}}_{f}-u_{f}-{\dot{r}}_{f}),\end{eqnarray}$$
where
 $u_{b}\approx 0$
is the velocity of the burnt gases, on the inner side of the flame, and
 $p_{b}$
their pressure. The pressure jump is such that
 $$\begin{eqnarray}\frac{p_{f}-p_{b}}{{\it\rho}_{u}{\dot{r}}_{f}^{2}}=\frac{{\it\rho}_{b}}{{\it\rho}_{u}}\left(1-\frac{{\it\rho}_{b}}{{\it\rho}_{u}}\right)\end{eqnarray}$$
that is, since
 ${\it\rho}_{b}/{\it\rho}_{u}\approx 1/8$
, an order of magnitude smaller than
 ${\it\rho}_{u}{\dot{r}}_{f}^{2}\sim p_{f}$
.
4.1.2. Capillary pressure
The over-pressure
 ${\rm\Delta}p$
of the fresh mixture with respect to the pressure in the outside air at the contact of the liquid shell is the Laplace pressure, which incorporates the contribution of the two interfaces of the shell at
 $r=R-h$
and
 $r=R$
, with
 $h/R\ll 1$
 $$\begin{eqnarray}{\rm\Delta}p=\frac{4{\it\sigma}}{R}.\end{eqnarray}$$
Evaluated around the initial stage at
 $R=R_{0}$
with
 $R_{0}\approx 10^{-2}$
m,
 ${\dot{r}}\approx 10$
m s
 $^{-1}$
, the capillary jump is small relative to the driving pressure in (4.6)
 $$\begin{eqnarray}\frac{{\rm\Delta}p}{{\it\rho}_{u}{\dot{r}}_{f}^{2}}\sim \frac{{\it\sigma}}{{\it\rho}_{u}{\dot{r}}_{f}^{2}R_{0}}\sim 10^{-2}\end{eqnarray}$$
and is therefore disregarded.
4.1.3. Viscous stresses
The radial motion induces viscous stresses
 ${\it\tau}_{rr}$
given by (Landau & Lifshitz Reference Landau and Lifshitz1987)
 $$\begin{eqnarray}{\it\tau}_{rr}=2{\it\eta}_{g,l}\frac{\partial u}{\partial r},\end{eqnarray}$$
where
 ${\it\eta}_{g,l}$
is the appropriate viscosity in either the fresh gases, the ambient air or in the liquid. Evaluated in the vicinity of the initial shell radius, the velocity gradient computed from (4.3)
 $$\begin{eqnarray}\frac{\partial u}{\partial r}=-2\frac{{\dot{R}}}{R_{0}}\end{eqnarray}$$
is extremely small in magnitude, proportional to
 $t^{2}$
(see (3.3)), and therefore negligible there compared to
 ${\it\rho}_{u}{\dot{r}}_{f}^{2}$
in all phases.
4.2. Rayleigh–Plesset dynamics
Given the considerations above, the dynamics of the radial expansion is only sensitive to the inertia of the phases being pushed radially. The expansion is thus appropriately described by the Euler equation
 $$\begin{eqnarray}\partial _{t}u+u\partial _{r}u=-\frac{1}{{\it\rho}}\,\partial _{r}p,\end{eqnarray}$$
where
 $p$
is the pressure.
The reasoning consists of connecting the motion of the shell radius
 $R(t)$
with the pressure at the flame front
 $p(r_{f})=p_{f}$
. For doing so, we first integrate (4.13) in the three successive phases (ambient air, liquid shell, fresh gases) in order to evaluate their relative contributions and then compute the pressure
 $p_{f}$
in a second step, detailed in the next section, § 4.3. Using (4.3) for the displacement field, we have
 $$\begin{eqnarray}\frac{2R{\dot{R}}^{2}+R^{2}\ddot{R}}{r^{2}}-\frac{2R^{4}{\dot{R}}^{2}}{r^{5}}=-\frac{1}{{\it\rho}}\,\partial _{r}p\end{eqnarray}$$
also known as a Rayleigh–Plesset equation (Plesset & Prosperetti Reference Plesset and Prosperetti1977).
4.2.1. Ambient medium
Integrating (4.14) from
 $r=R$
, the radius of the external interface of the liquid shell, to
 $r\rightarrow \infty$
, and counting the pressure from the far field ambient pressure
 $p_{\infty }$
, we have
 $$\begin{eqnarray}p(R)={\it\rho}_{\infty }\left({\textstyle \frac{3}{2}}{\dot{R}}^{2}+R\ddot{R}\right)\end{eqnarray}$$
a result known since Rayleigh (Reference Rayleigh1917).
4.2.2. Liquid shell
The pressure drop at the passage of the liquid shell, disregarding the negligible capillary pressure (see § 4.1), is obtained from the integration of (4.14) from
 $r=R-h$
to
 $r=R$
to give, in the limit
 $h/R\ll 1$
 $$\begin{eqnarray}p(R-h)-p(R)\approx {\it\rho}h\ddot{R}\end{eqnarray}$$
which simply expresses the pressure difference as the acceleration of the thin dense shell of thickness
 $h$
. Thinner films are accelerated faster.
4.2.3. Fresh mixture
Finally, integrating (4.14) between the flame front at
 $r=r_{f}$
and the liquid shell inner interface at
 $r=R-h$
in the unburnt gases with density
 ${\it\rho}_{u}$
leads to
 $$\begin{eqnarray}p(R-h)-p(r_{f})=-{\it\rho}_{u}\left\{\!(2R{\dot{R}}^{2}+R^{2}\ddot{R})\left(\frac{1}{r_{f}}-\frac{1}{R-h}\right)+\frac{1}{2}R^{4}{\dot{R}}^{2}\left(\frac{1}{(R-h)^{4}}-\frac{1}{r_{f}^{4}}\right)\!\right\}\end{eqnarray}$$
a complicated expression which is considerably simplified by taking into account that initially
 $r_{f}\ll R$
and
 ${\dot{R}}(0)=0$
. Thus
 $$\begin{eqnarray}p(r_{f})-p(R-h)\approx {\it\rho}_{u}\frac{R^{2}\ddot{R}}{r_{f}}.\end{eqnarray}$$
Summing the pressure drops in the three consecutive phases given by (4.15), (4.16) and (4.18) provides the total pressure at the flame front as a function of the shell radius dynamics as
 $$\begin{eqnarray}p(r_{f})={\it\rho}_{u}\ddot{R}\left(\frac{R^{2}}{r_{f}}+\frac{{\it\rho}}{{\it\rho}_{u}}h+\frac{{\it\rho}_{\infty }}{{\it\rho}_{u}}R\right).\end{eqnarray}$$
For
 $h/R=O(10^{-3})$
,
 ${\it\rho}/{\it\rho}_{u}=O(10^{3})$
and
 ${\it\rho}_{\infty }/{\it\rho}_{u}=O(1)$
as in the present experiments, the two last terms in (4.19), representing the inertia of the liquid shell, and of the outer ambient medium, are of the same order of magnitude. However, both are small compared to the first term when initially
 $r_{f}\ll R$
. Therefore, the dynamics of the liquid shell is initially described, to leading order when
 ${\dot{R}}(0)=0$
and
 $R(0)=R_{0}$
, by
 $$\begin{eqnarray}p(r_{f})\approx {\it\rho}_{u}\frac{R_{0}^{2}\ddot{R}}{r_{f}}\end{eqnarray}$$
valid for
 $r_{f}<R$
.
4.3. Pressure at the flame front
We now compute the pressure at the flame front
 $p_{f}=p(r_{f})$
and for doing so, we adopt a description of the flow field which applies to radial locations
 $r$
of the order of the flame radius
 $r_{f}$
in (4.4). Using this form for
 $u$
in the fresh gases with density
 ${\it\rho}_{u}$
, the Euler equation (4.13) leads to the following Rayleigh–Plesset equation
 $$\begin{eqnarray}2({\dot{r}}_{f}-u_{f})\frac{r_{f}{\dot{r}}_{f}}{r^{2}}-2({\dot{r}}_{f}-u_{f})^{2}\frac{r_{f}^{4}}{r^{5}}=-\frac{1}{{\it\rho}_{u}}\,\partial _{r}p.\end{eqnarray}$$
Integrating from
 $r=r_{f}$
to a location far away from the flame front leads to
 $$\begin{eqnarray}p(r_{f})={\it\rho}_{u}({\dot{r}}_{f}-u_{f})\left({\textstyle \frac{3}{2}}{\dot{r}}_{f}+{\textstyle \frac{1}{2}}u_{f}\right)\end{eqnarray}$$
or, since
 ${\dot{r}}_{f}\gg u_{f}$
,
 $$\begin{eqnarray}p_{f}=p(r_{f})\approx {\textstyle \frac{3}{2}}{\it\rho}_{u}{\dot{r}}_{f}^{2}\end{eqnarray}$$
which has indeed the scaling anticipated in (4.6).
4.4. Radial expansion of the shell
The radial expansion of the shell is now completely defined by equating (4.20) with (4.23). We have
 $$\begin{eqnarray}{\it\rho}_{u}\frac{R_{0}^{2}\ddot{R}}{r_{f}}=\frac{3}{2}{\it\rho}_{u}{\dot{r}}_{f}^{2},\end{eqnarray}$$
giving, since the radius of the flame
 $r_{f}={\dot{r}}_{f}t$
is linear in time according to (4.1) and
 ${\dot{R}}(0)=0$
,
 $$\begin{eqnarray}\frac{R}{R_{0}}=1+\frac{1}{4}\left(\frac{r_{f}}{R_{0}}\right)^{3}\end{eqnarray}$$
valid as long as
 $r_{f}<R$
. This law has a structure similar to the one of the short time limit of (4.5), but a pre-factor of the
 $t^{3}$
term which is smaller, and therefore describes more adequately the shell trajectories, as seen in figure 9. It depends neither on the density of the outer ambient air nor on the features of the liquid shell because, as (4.19) demonstrates, the pressure drops corresponding to these phases are sub-dominant compared to that of the medium just ahead of the flame front, which incorporates most of the inertia moved by
 $p_{f}$
.
4.5. Compressibility, flame front sphericity
The trajectory of the liquid shell in (4.25) has been obtained by matching two locally incompressible descriptions of the flow, through the pressure at the flame front. The reason why (4.25) is different from that anticipated from a globally incompressible field (4.5) is that, precisely, the flow is compressible: the bubble burst, though not dangerous (Marangoni & Stefanelli Reference Marangoni and Stefanelli1873), is also accompanied by a distinct emission of sound, which can be deafening for centimetric bubbles and a stoichiometric mixture at a distance of a metre. Note that compressibility does not necessarily mean the formation of a shock (Taylor Reference Taylor1946; Strehlow et al. Reference Strehlow, Luckritz, Adamczyk and Shimpi1979), although a weak one is radiated immediately after the laser pulse from the ignition spot, soon vanishing as seen in figure 11.
Close-up in the ignition region of a mixture with
 ${\it\phi}=3.6$
showing, immediately after the laser pulse, the radiation of a weak spherical shock wave (arrow), and the subsequent development of the flame front, progressively approximating a sphere. Consecutive images are separated by
 $1/8000$
s, their width is 2 cm. The size of the ignited flame kernel is 2 mm.

The amplitude and chronology of the compression inside the bubble can be evaluated by noticing that the net mass
 $M$
enclosed inside it is constant as the flame propagates. We have until now confused the density
 ${\it\rho}_{u}$
with the initial density of the fresh mixture
 ${\it\rho}_{u}(0)$
, and thus have
 $$\begin{eqnarray}\displaystyle M & = & \displaystyle {\it\rho}_{u}(0){\textstyle \frac{4}{3}}{\rm\pi}R_{0}^{3}\nonumber\\ \displaystyle & = & \displaystyle {\it\rho}_{u}\left({\textstyle \frac{4}{3}}{\rm\pi}R^{3}-{\textstyle \frac{4}{3}}{\rm\pi}r_{f}^{3}\right)+{\it\rho}_{b}{\textstyle \frac{4}{3}}{\rm\pi}r_{f}^{3},\end{eqnarray}$$
that is
 $$\begin{eqnarray}\frac{{\it\rho}_{u}(0)}{{\it\rho}_{u}}=\left(\frac{R}{R_{0}}\right)^{3}-\left(\frac{r_{f}}{R_{0}}\right)^{3}\left(1-\frac{T_{u}}{T_{b}}\right),\end{eqnarray}$$
where use has been made of the fact that the ratio
 ${\it\rho}_{b}/{\it\rho}_{u}$
is equal to
 $T_{u}/T_{b}$
, independent of the absolute pressure in the bubble, and solely dependent on the chemistry of the reaction (for instance
 $T_{u}/T_{b}\approx 293/3000$
at
 ${\it\phi}=1$
). The density of the fresh mixture
 ${\it\rho}_{u}$
departs gradually from its initial value
 ${\it\rho}_{u}(0)$
as
 $r_{f}$
increases, at the same pace as
 $R$
departs from
 $R_{0}$
, that is with a
 $t^{3}$
dependence. The density of the fresh mixture is thus fairly given, in order of magnitude and at short time, by
 ${\it\rho}_{u}(0)$
, therefore legitimating the approximation we have made; its interest is to avoid technical difficulties in conducting a physically clear discussion. That density is strictly time dependent and larger than
 ${\it\rho}_{u}(0)$
, explaining also why the trajectory in (4.25) somewhat overestimates the observed shell trajectory (the real pre-factor is closer to
 $1/6$
than
 $1/4$
in (4.25)).
Figure 11 also shows that the ignited region is not spherical from the start, a fact well known in laser plasma ignition (Spiglanin et al. Reference Spiglanin, McIlroy, Fournier, Cohen and Syage1995), but has more the shape of a torus. However, this complicated initial topology relaxes subsequently towards a close-to-spherical shape, the one idealized in the present analysis. Premixed planar flame fronts are known to destabilize spontaneously, forming cells. Expanding spherical flames destabilize as well, although more slowly because of the ortho-radial divergence of the perturbations (Zeldovich et al. Reference Zeldovich, Barenblatt, Librovich and Makhviladze1985). These have not been seen to develop before the flame front has reached the shell in our experiments (see figures 5, 7 and 8, where the flame front is smooth).
Snapshot of a liquid shell of initial radius
 $R_{0}=2.5$
cm, expanded by a mixture at
 ${\it\phi}=5$
in the process of bursting, captured at
 $t\gtrsim t_{\star }$
. The view summarised all the phenomenology discussed in §§ 5 and 6, namely the piercing of the shell by holes, the hole expansion and associated rim collisions, the formation of a web of ligaments, their breakup into the final drops and the secondary atomization scenario with colliding rims from very distant holes (at the centre right of the image).

5. Stability
Being accelerated radially, perpendicularly to its local tangent plane, the dense liquid shell sandwiched between two lighter media (
 ${\it\rho}_{u}$
and
 ${\it\rho}_{\infty }$
are a thousand times smaller than
 ${\it\rho}$
), is unstable in the sense of Rayleigh–Taylor albeit in its modified version first analysed by Keller & Kolodner (Reference Keller and Kolodner1954). Indeed, the shell has a finite thickness
 $h$
, a fact which alters the instability development.
We follow here the lines of Bremond & Villermaux (Reference Bremond and Villermaux2005) and Lhuissier & Villermaux (Reference Lhuissier and Villermaux2012) to anticipate the relevant growth rate and mode selection of the instability. If
 $\ddot{R}$
is the acceleration of a density interface, the cut-off wavenumber of the instability is
 $$\begin{eqnarray}k_{c}=\sqrt{\frac{{\it\rho}\ddot{R}}{{\it\sigma}}}\end{eqnarray}$$
whose inverse must be compared to the shell thickness
 $h$
. If
 $k_{c}h\gg 1$
, the standard analysis (Chandrasekhar Reference Chandrasekhar1961) holds, for which both the most amplified wavenumber
 $k_{c}/\sqrt{3}$
and its growth rate
 $({\it\rho}\ddot{R}^{3}/{\it\sigma})^{1/4}$
are independent of
 $h$
. But when
 $$\begin{eqnarray}k_{c}h\ll 1\end{eqnarray}$$
the coupled distortion of the nearby interfaces hinders the instability development, which now occurs around a wavenumber given by
 $$\begin{eqnarray}k\approx {\textstyle \frac{1}{2}}k_{c}^{2}h\end{eqnarray}$$
with a growth rate
 $$\begin{eqnarray}{\it\omega}=\sqrt{\frac{{\it\rho}\ddot{R}^{2}h}{2\,{\it\sigma}}}\end{eqnarray}$$
going to zero as
 $h\rightarrow 0$
. The rear and front (in the direction of the shell expansion) interfaces amplify disturbances inducing thickness modulations of the shell, piercing it when they are of the order of its initial mean thickness.
The most violent expansions imposed on the shells in the present experiments are obtained close to stoichiometry for
 ${\it\phi}=0.7$
, that is
 ${\dot{r}}_{f}=80$
m s
 $^{-1}$
. These were destabilized within a time
 $t_{\star }\approx 10^{-4}$
s (see figure 6), under a maximal acceleration of the order of
 $\ddot{R}\approx 10^{5}$
m s
 $^{-2}$
giving, according to (5.2),
 $k_{c}h\lesssim 1$
. All shells accelerated under milder conditions are thus adequately described within the limit in (5.2): the typical distance between two adjacent holes is larger than the shell thickness.
5.1. Destabilization time and radius
Since both the shell acceleration in (4.24)
 $$\begin{eqnarray}\ddot{R}\sim \frac{{\dot{r}}_{f}^{3}\,t}{R_{0}^{2}}\end{eqnarray}$$
and to a lesser extent its mean thickness
 $h$
are time dependent in the course of the expansion, the instability growth rate in (5.4) is a function of time. As is usual in these kinds of problems (see Plesset Reference Plesset1954; Stebnovskii Reference Stebnovskii1982; Bremond & Villermaux Reference Bremond and Villermaux2005; Lhuissier & Villermaux Reference Lhuissier and Villermaux2012), most of the total breakup time is spent in developing the instability around the initial state. The shell piercing time
 $t_{\star }$
is thus such that
 $$\begin{eqnarray}\int _{0}^{t_{\star }}{\it\omega}(t)\,\text{d}t=O(1).\end{eqnarray}$$
It corresponds experimentally to the time where the first holes appear on the shell, as illustrated in figure 4.
Using the expression for the growth rate (5.4), the shell acceleration in (5.5) and further defining the relevant Weber number
 $$\begin{eqnarray}We=\frac{{\it\rho}\,{\dot{r}}_{f}^{2}h}{{\it\sigma}},\end{eqnarray}$$
we find that the application of the piercing criterion (5.6) leads to the following prediction for the instability time
 $$\begin{eqnarray}\frac{{\dot{r}}_{f}t_{\star }}{R_{0}}\sim We^{-1/4}\end{eqnarray}$$
and, from (4.25), for the corresponding destabilization radius
 $$\begin{eqnarray}\frac{R(t_{\star })}{R_{0}}-1\sim We^{-3/4}.\end{eqnarray}$$
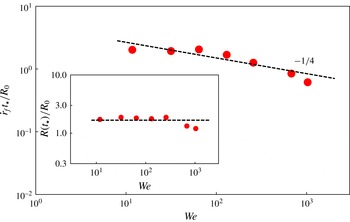
The Weber numbers of the present experiments are of the order of 100 so that, according to (5.8), holes first appear when the flame front has travelled by the initial shell radius
 $R_{0}$
, consistent with the observations. Correlatively, the destabilization radii are expected to be of the order of the initial radius
 $R_{0}$
. Figure 13 shows that both predictions (5.8) and (5.9) are consistent with the measurements, in law and absolute value. Indeed, if
 ${\it\epsilon}$
denotes the amplitude of the initial thickness modulations of the film, an explicit formulation of the piercing criterion in (5.6) is
 ${\it\epsilon}\exp (\int _{0}^{t_{\star }}{\it\omega}(t)\,\text{d}t)=h$
. From the experimental shell trajectories
 $R(t)$
and piercing times
 $t_{\star }$
in figures 9 and 13, we find that
 $$\begin{eqnarray}\ln \frac{h}{{\it\epsilon}}=8.1\end{eqnarray}$$
corresponding, with
 $h=30~{\rm\mu}$
m, to an initial amplitude
 ${\it\epsilon}$
of the film modulations of the order of a hundredth of a micron (
 $10^{-8}$
m). This value is consistent with the one already found in comparable systems (Buff, Lowett & Stillinger Reference Buff, Lowett and Stillinger1965; Krichevsky & Stavans Reference Krichevsky and Stavans1994; Bremond & Villermaux Reference Bremond and Villermaux2005), and is attributable to the amplitude of the thermal noise. The shell bursting results from an intrinsic instability amplifying a microscopic noise and is not caused by flaws, imperfections or external perturbations.
Destabilization time of the shell
 $t_{\star }$
obtained for various mixture equivalence ratios (and therefore various
 $We$
), normalized by the travelling time of the flame on the initial shell radius
 $R_{0}$
. The dashed line is
 $4.8\,We^{-1/4}$
. Inset: corresponding destabilization radii in (5.9) as a function of
 $We$
showing that
 $R(t_{\star })/R_{0}=O(1)$
.

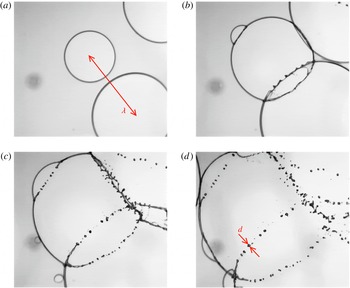
Close-up of the detailed fragmentation dynamics showing the collision of rims from holes centres at a distance
 ${\it\lambda}=15$
mm, the formation of ligaments, and their breakup into a dispersion of drops of diameters
 $d$
. The mixture equivalence ratio is
 ${\it\phi}=5$
, and the fragments average diameter is
 $\langle d\rangle \approx 450~{\rm\mu}$
m.

The destabilization time
 $t_{\star }$
of the shell is smaller for a more violent expansion, and so is the destabilization radius
 $R(t_{\star })$
relative to its initial radius
 $R_{0}$
. It takes longer for thinner films (soap bubbles) to destabilize compared to thicker shells, a consequence of the cancelling of the instability growth rate (5.4) as
 $h\rightarrow 0$
, which in itself explains how cohesion (through liquid surface tension) opposes the kinematic separation of the fluid particles.
The web of ligaments at
 $t\gtrsim t_{\star }$
for the successive equivalence ratios
 ${\it\phi}=1.7$
with
 ${\it\lambda}\approx 1$
mm,
 ${\it\phi}=2.5$
with
 ${\it\lambda}\approx 3$
mm and
 ${\it\phi}=3$
with
 ${\it\lambda}\approx 6$
mm. The ligaments are more corrugated for larger
 ${\it\phi}$
.

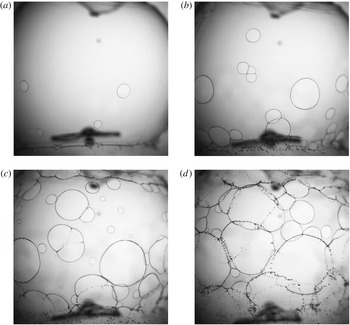
Sequence showing how holes nucleate, grow and merge on the shell (
 ${\it\phi}=4.3$
,
 ${\dot{r}}_{f}=14$
m s
 $^{-1}$
) at, successively,
 $t=4\times 10^{-3}$
s (
 $n=4$
),
 $t=5\times 10^{-3}$
s (
 $n=17$
),
 $t=6\times 10^{-3}$
s (
 $n=n_{max}=32$
) and
 $t=7\times 10^{-3}$
s (
 $n=13$
).

5.2. Selected wavelength
The number of holes piercing the shell is a direct measurement of the instability wavenumber
 $k$
in (5.3), that is of the instability wavelength
 ${\it\lambda}=2{\rm\pi}/k$
.
For strong expansions (that is for
 ${\dot{r}}_{f}\gtrsim 30$
m s
 $^{-1}$
corresponding to equivalence ratios
 ${\it\phi}\lesssim 3$
), the shell piercing is relatively synchronous, and a well defined network of holes is visible, which soon after
 $t_{\star }$
grow and merge to form a regular network of ligaments, so that
 ${\it\lambda}$
can be read directly from the movies of the phenomenon, as seen in figures 6 and 15. However, when the expansion is milder, holes appear progressively, as seen in figures 16 and 17. The initial growth of the number of holes in time reflects the distribution of initial thickness modulations on the shell discussed by Bremond & Villermaux (Reference Bremond and Villermaux2005), while the subsequent decay in time is due to the coalescence of the holes with their neighbours, whose kinetics has been analysed by Lhuissier & Villermaux (Reference Lhuissier and Villermaux2013). The overall evolution of the number of holes recorded in a fixed area
 $A$
of the shell (roughly half its surface area, as in figure 16) as a function of time is shown in figure 17. The instability wavelength is defined (Bremond & Villermaux Reference Bremond and Villermaux2005) and measured from the maximal hole number
 $n_{max}$
in
 $A$
as
 $$\begin{eqnarray}{\it\lambda}=\sqrt{\frac{A}{n_{max}}}.\end{eqnarray}$$
The wavenumber mostly amplified by the instability (5.3) depends on time through the time dependence of the shell acceleration (5.5) as
 $$\begin{eqnarray}k(t)\approx \frac{1}{R_{0}}\frac{{\it\rho}\,{\dot{r}}_{f}^{2}h}{{\it\sigma}}\frac{{\dot{r}}_{f}}{R_{0}}.\end{eqnarray}$$
Evaluated at the piercing time
 $t=t_{\star }$
in (5.8), it provides the expected wavelength
 ${\it\lambda}$
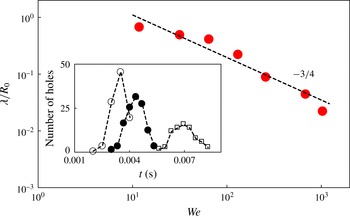
 $$\begin{eqnarray}\frac{{\it\lambda}}{R_{0}}\approx \frac{2{\rm\pi}}{We^{3/4}},\end{eqnarray}$$
a prediction verified quantitatively from the comparison with the measurements made through (5.11), as shown in figure 17.
Wavelength
 ${\it\lambda}$
normalized by
 $R_{0}$
as a function of
 $We$
. The dashed line is the law given by (5.13). Inset: number of holes visible on a fixed area of the shell as function of time at various equivalence ratios
 ${\it\phi}=3.6$
(circles),
 ${\it\phi}=4.3$
(filled circles) and
 ${\it\phi}=5$
(squares). The maximum number of holes in (5.11) is smaller for a milder expansion (larger equivalence ratio).

6. Fragments
Once the holes have all nucleated, and opened at a constant speed given by (2.1), collecting during the passage of their rim the liquid of the shell, they eventually coalesce by the collision of their rims. The collision forms a ligament which, because it has on average a columnar shape, is unstable by capillarity. This is how the droplets, in the final disintegration phase of the shell, are formed.
The outcome from ligament breakup is a collection of fragments distributed according to (Villermaux Reference Villermaux2007)
 $$\begin{eqnarray}{\it\Gamma}_{{\it\nu}}(x=d/\langle d\rangle )=\frac{{\it\nu}^{{\it\nu}}}{{\it\Gamma}({\it\nu})}\,x^{{\it\nu}-1}\,\text{e}^{-{\it\nu}x},\end{eqnarray}$$
where
 $\langle d\rangle$
is the average drop size. The index
 ${\it\nu}$
refers to the roughness of the ligament: a straight, smooth ligament has
 ${\it\nu}=\infty$
and produces a single size population of drops. A strong corrugation means that the amplitude of the cross-section diameter fluctuations along the ligament is of the order of its mean radius. In that case, the parameter
 ${\it\nu}$
is of order of a few units, typically four.
Precise measurements (see e.g. Bremond & Villermaux Reference Bremond and Villermaux2006; Villermaux & Bossa Reference Villermaux and Bossa2011; Zhao et al.
Reference Zhao, Liu, Xu and Li2011) support the universal character of (6.1) and have also demonstrated the way the index
 ${\it\nu}$
can be varied experimentally, in various instances. Moreover, Lhuissier & Villermaux (Reference Lhuissier and Villermaux2013), studying the disintegration of a liquid sheet pierced randomly via a Poisson process both in space and time, have shown that the dominant source of disorder explaining the width of the final drop size distribution lies in the intrinsic ligament dynamics which, at breakup, produce a broad collection of drop sizes (according to (6.1)), nearly identical with those found in the overall spray, and this even though the ligaments were themselves distributed in diameter. Similar observations, and conclusions, are made here.
6.1. Fragments size distribution
The drops were measured on focussed images of the atomized shells like the one in figure 14. The corresponding region of the atomized shell is around its equator, thus excluding de-facto the big anomalous fragments from the poles. The drop size distributions were computed by averaging the drop populations over tens of shell bursts in identical operating conditions, representing about a thousand individual drops. These come from the breakup of the liquid shell at its destabilization radius
 $R(t_{\star })$
, whose thickness
 $h_{\star }$
is slightly smaller than the initial one and is given, owing to mass conservation
 $4{\rm\pi}R^{2}h=C^{st}$
, by
 $$\begin{eqnarray}h_{\star }=\left(\frac{R_{0}}{R(t_{\star })}\right)^{2}h.\end{eqnarray}$$
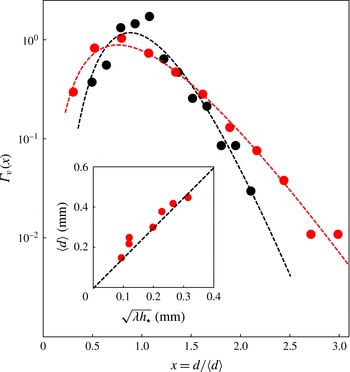
Fragments (droplets) size distributions. Red symbols: distribution obtained at
 ${\it\phi}=4.3$
(
 ${\dot{r}}_{f}=15$
m s
 $^{-1}$
,
 $\langle d\rangle =420~{\rm\mu}$
m) fitted by (6.1) with
 ${\it\nu}=4$
. Black symbols: distribution obtained at
 ${\it\phi}=1.7$
(
 ${\dot{r}}_{f}=65$
m s
 $^{-1}$
,
 $\langle d\rangle =220~{\rm\mu}$
m) fitted by (6.1) with
 ${\it\nu}=8$
. Inset: average droplets size
 $\langle d\rangle$
versus
 $\sqrt{{\it\lambda}h_{\star }}$
, both in millimetres. The line is the expectation from (6.6).

Figure 18 displays two of these drop size distributions, obtained for two different mixture equivalence ratios, namely
 ${\it\phi}=1.7$
and
 ${\it\phi}=4.3$
. If both distributions are well represented by (6.1), their parameter
 ${\it\nu}$
differ however, since we have
 ${\it\nu}=8$
and
 ${\it\nu}=4$
, respectively, as fitted from the experimental distributions. The reason why (6.1) adequately describes the shape of the distributions is that both originate from the breakup of ligaments. The fact that their relative width (the ratio of the standard deviation to the mean is
 $1/\sqrt{{\it\nu}}$
) is different reflects a difference in roughness of the ligaments whose breakup produces the drops.
Breaking ligaments originate from the collision, or impact, of rims originating from more or less distant holes. The Weber number associated to this impact is
 $$\begin{eqnarray}We_{i}=\frac{{\it\rho}(2v_{TC})^{2}\sqrt{{\it\lambda}h_{\star }/{\rm\pi}}}{{\it\sigma}}=\frac{8}{\sqrt{{\rm\pi}}}\sqrt{\frac{{\it\lambda}}{h_{\star }}}\end{eqnarray}$$
since
 $\sqrt{{\it\lambda}h_{\star }/{\rm\pi}}$
is the diameter of the rims from two holes whose centres are separated by
 ${\it\lambda}$
(see Lhuissier & Villermaux Reference Lhuissier and Villermaux2013), and which collide at relative velocity
 $2v_{TC}$
based on
 $h_{\star }$
. The collision is inelastic, meaning that the kinetic energy of the rims is dissipated, through turbulent-like random motions in the core of the ligament, ultimately by viscosity. If the confinement by surface tension is not strong enough, that is, if the rims are big, these motions can corrugate the ligament appreciably. Larger impact Weber number is thus associated to larger ligament corrugations and therefore to a broader drop size distribution.
This is the scenario when the rims actually merge, which is even more pronounced at very large
 $We_{i}$
, where we observe that rims sometimes go off-plane and avoid each other, or collide so violently that they form a sheet transverse to the direction of the collision, which eventually breaks up at its edge, to form even smaller droplets.
The impact Weber number at
 ${\it\phi}=1.7$
is
 $We_{i}=32$
because the instability wavelength is short, while at
 ${\it\phi}=4.3$
we have
 $We_{i}=106$
, a value slightly above the one suggested by Lhuissier & Villermaux (Reference Lhuissier and Villermaux2013) to be characteristic of the onset of secondary sheet formation. This is consistent with the observed fact that the drop size distribution is broader at a larger equivalence ratio, corresponding also to a milder shell expansion, a surprising result which is nevertheless rationalized by the argument above.
6.2. Mean drop size
The ligaments concentrate the liquid which was initially filling the holes. The diameter of a ligament
 $d_{\ell }$
formed by the merging of two rims propagating from hole centres separated by
 ${\it\lambda}$
, the mean instability wavelength, is thus, by mass conservation (Lhuissier & Villermaux Reference Lhuissier and Villermaux2013)
 $$\begin{eqnarray}d_{\ell }=\sqrt{\frac{2{\it\lambda}h_{\star }}{{\rm\pi}}}.\end{eqnarray}$$
The mean drop size
 $\langle d\rangle$
is, strictly speaking, a function of
 $d_{\ell }$
, of the corrugation index
 ${\it\nu}$
of the ligament and of its aspect ratio at breakup
 ${\it\lambda}/d_{\ell }$
(Villermaux Reference Villermaux2007). A simple version consists of using the result of Rayleigh (Reference Rayleigh1879), valid for a smooth infinitely long ligament, giving the value of the fastest growing wavelength of the capillary instability as
 ${\it\lambda}_{\infty }\simeq 4.5\,d_{\ell }$
, to further confuse the average of the drop diameters cubed with the cube of the mean drop size, and to write
 $$\begin{eqnarray}\frac{{\rm\pi}}{6}\langle d\rangle ^{3}=\frac{{\rm\pi}}{4}d_{\ell }^{2}{\it\lambda}_{\infty }\end{eqnarray}$$
thus providing the following prediction for the mean drop size
 $$\begin{eqnarray}\langle d\rangle \simeq 1.5\sqrt{{\it\lambda}h_{\star }},\end{eqnarray}$$
which is verified quantitatively, independently of the detailed shape of the distribution (i.e. of the mixture equivalence ratio
 ${\it\phi}$
and therefore of the index
 ${\it\nu}$
), as shown in figure 18.
7. Conclusion and further remarks
7.1. Summary
A spherical liquid shell expanded by the deflagration of the gas mixture it encloses has been studied as a prototype of explosive fragmentation. The objective of the present study was to illustrate a fragmentation scenario in a particular instance where each step can be documented and rationalized with certitude. We have depicted successively the dynamics of the flame in the gas, inducing that of the shell itself, the stability of the shell in its radially accelerated motion and its final disintegration into stable fragments. All steps, from the initial state to the final dispersion of droplets, have been described quantitatively, and rationalized by simple but accurate arguments. In this respect, the use of the couple hydrogen/oxygen as the reactive gas mixture has been useful since the strong dependence of the propagation velocity of the flame on the relative proportion of the constituents has made possible a systematic parametric exploration (§ 3).
Liquid shells with a centimetric radius and tens of microns thickness have a radial expansion, that is a prelude to their bursting, essentially insensitive to their thickness. Indeed the shell radius trajectories were observed to be identical with those of soap bubbles in the same conditions (§ 4). The reason is that most of the inertia the flame has to push is in the unburnt gas mixture just ahead of it. This is, in fact, true as long as the flame radius is very small compared to the shell radius. When it approaches that of the shell, the liquid shell inertia becomes of the same order of magnitude of that of the gas phase. The phenomenon is seen by inspecting the shell displacement of a soap bubble having aged for some time in the gravity field: its thickness at the pole is thinner that at the equator and it is, there, less accelerated than at the pole. The effect is weak, but noticeable (figure 7). The situation is, for the same reason, opposite for the liquid shells formed by the capillary breakup of a cylindrical liquid envelope. The shell thickness is larger at the pole than at the equator, hence a stronger expansion there than at the poles, explaining the ‘apple’ shape of the expanded shells in that case (illustrated in figures 4 and 12 for instance). A more systematic study of the influence of the liquid inertia would be interesting. With a thick, massive liquid layer, the incompressible description of the flow, marginally justified here due to the weakness of the Mach number, would leave place for a description where the pressure is essentially constant radially in the burnt gases and in the fresh mixture, but much higher than the reference far field pressure (like in the so-called ‘Mach’ problem, and in the limit of an extremely inertial shell, the combustion in closed vessels, see Chap. 6 in Zeldovich et al. (Reference Zeldovich, Barenblatt, Librovich and Makhviladze1985) and Duplat & Villermaux (Reference Duplat and Villermaux2015) for a recent experiment).
Understanding the shell stability properties resorts to the familiar Rayleigh–Taylor argument, in its less familiar small thickness limit which is nevertheless needed to understand the puncture of thin sheets moved perpendicularly to their plane (§ 5).
Drops come from the breakup of liquid ligaments, whose formation is the last but one step of the production of stable fragments. The ligaments are formed from the collision of the rims bordering adjacent expanding holes and, depending on the strength of the collision, are more or less corrugated. These corrugations influence the width of the fragments’ distribution relative to its mean but not its shape, pertaining to an attractive family characteristic of ligament breakup (§ 6). The violent impact of initially very distant rims leads to a different atomization scenario already noticed earlier (Lhuissier & Villermaux Reference Lhuissier and Villermaux2013) which produces very thin droplets via the formation of a tiny sheet at rim impact (see e.g. figures 12 and 16). The intrinsic description of this new fragmentation mechanism remains to be done.
7.2. Misconceptions
It is tempting, faced with a complicated problem where many intermingled effects are at play, to resort to general principles, an attitude sometimes adopted in despair in fragmentation mechanics. Because one must be extremely cautious in retaining the relevant ingredients when working these principles out, their use is most of the time hazardous. Let us examine an example scenario.
In the present problem, the total available energy is that released by the chemical reaction. For a given number of moles
 $m$
of a (stoichiometric, say) mixture enclosed in the bubble with radius
 $R_{0}$
, one knows that the energy released will be
 $E=-{\rm\Delta}H\times (2/3)\,m$
. Then, a temptation can be to equate this energy with the energy necessary to break up the liquid shell, and to further assume that this fracture energy is itself reflected by the final surface energy of the fragments (von Rittinger Reference von Rittinger1867). If
 ${\it\Omega}=4{\rm\pi}R_{0}^{2}h$
is the volume of the liquid shell,
 $N$
the number of fragments and
 $\langle d\rangle$
their average size, we thus have
 ${\it\Omega}\sim N\langle d\rangle ^{3}$
, and from the application of the (flawed) conservation principle stated above,
 $E\sim N\langle d\rangle ^{2}{\it\sigma}$
, from which one would predict
 $$\begin{eqnarray}\langle d\rangle \neq \frac{{\it\Omega}{\it\sigma}}{E},\quad N\neq \frac{(E/{\it\sigma})^{3}}{{\it\Omega}^{2}}.\end{eqnarray}$$
The symbol
 $\neq$
signifies clearly the absurdity of this prediction since, with
 $R_{0}=2$
cm, one has
 $(2/3)\,m\simeq 10^{-3}$
moles at atmospheric pressure, and thus
 $E\simeq 221$
J giving, according to (7.1), a fragment size
 $\langle d\rangle$
of the order of
 $10^{-12}$
m, smaller than the interatomic distance...! The reason for this major failure is that this scenario, which is even wrong in scaling dependencies, disregards several other sinks of energy, like the work done by the burnt gases to push the unburnt gas, the shell and the outside air, thus giving them substantial kinetic energy, but also disregards the highly dissipative dynamics of the rims and ligaments breakup on the liquid shell, in particular.
Other lumped descriptions (Grady Reference Grady1982; Sultanov & Yarin Reference Sultanov and Yarin1990) explicitly invoke the expansion rate of the breaking material (
 ${\dot{R}}/R$
in the present case) and put it in relation with some measure of its cohesion (like
 $\sqrt{{\it\sigma}/{\it\rho}\langle d\rangle ^{3}}$
) to derive fragment sizes, but fail at providing a precise picture for which error does not escape from proof.
7.3. Future direction
Finally, while the inviscid, thin shell limit of the present problem has been discussed here, the viscous corrections, and probably more interestingly the viscoelastic corrections to it, are natural future perspectives. A viscoelastic fluid will respond like a solid to the violent initial radial deformation of the shell, certainly influencing the development of its instability, and will behave like a cohesive fluid in the final stages of ligament breakup. New regimes and insights into the problem of solid fragmentation are certainly to be expected.
Acknowledgement
We thank P. Clavin and J. Graña-Otero for interesting discussions.