1. INTRODUCTION
The rapid development of Global Navigation Satellite Systems (GNSS (Liu et al., Reference Liu, Fang and Wang2015), e.g., BeiDou (Compass) (Liu, Pang et al., Reference Liu, Pang, Liu and Wang2015; Sun et al., Reference Sun, Zheng, Zhang and Liu2014), Galileo, GLONASS and the Global Positioning System (GPS)) brings great opportunities and challenges for signal synchronisation and receivers. Specifically, new modulation technologies have been applied in GNSS, e.g., the Binary Offset Carrier (BOC) modulation. BOC modulation technology has attracted much interest for new GNSS since it can provide a higher positioning accuracy and higher multipath rejection than the conventional Phase Shift Keying (PSK) modulation as well as a spectral separation from the existing GNSS. In BOC modulation, the signal is generated by multiplying a Pseudo Random Noise (PRN) code with a sub-carrier. With the emergence and application of the BOC modulation signal, high efficiency synchronous receiving technology has become the touchstone of research.
In general, the GNSS signal synchronous receiving system primarily includes acquisition and tracking processing. Fast course synchronisation for the frequency and phase is performed in acquisition processing, and the acquisition parameters are then transited. Further precise synchronisation is performed by using the transition parameters in tracking processing. Although the tracking phase precision must be high and the acquisition phase precision is not high, with the high demand for GNSS reception, high precision acquisition is also increasingly receiving more attention. Furthermore, since the repetition rate of the tracking processing in the receiver is high, especially with the receiver in hot start mode, the result is that, if there are higher precision acquisition parameters, the overall efficiency of the tracking system will be greatly improved. Therefore, research on high precision acquisition technology is especially important.
Although acquisition accuracy and the signal autocorrelation function are closely related, only the centre main peak corresponds to the relevant function. The main problem with BOC signals is that their autocorrelation has multiple side-peaks around the main peak, which causes the large error problem of main peak estimation. Furthermore, the more the number of the side peaks increases with the modulation order, the smaller the spacing between the main and side peaks becomes, which causes the low efficiency problem of the main peak decision. Thus, main peak extraction technology has become especially important for high-order BOC signals, for example BOC (14,2) and BOC (15,2·5). Among them, the BOC (14,2) signal has been applied in the Chinese BeiDou B1 band, and the BOC (15,2·5) signal has been applied in the Chinese BeiDou B3 band.
Several techniques that have been reported to avoid these problems include the Bump-Jump (BJ) method (Fine and Wilson, Reference Fine and Wilson1999), Double Estimator (DE) method (Ward et al., Reference Ward2003), and double phase estimator (DPE) method (Hodgart and Simons, Reference Hodgart and Simons2012). The BJ method is not effective for high-order BOC signals or multipath conditions. Although the DE and DPE methods are useful for high-order BOC signals, high sampling frequency and tremendously high computational complexity restrict the low cost and miniaturization design of the receiver. To date, these preferable techniques can be grouped into the following categories: the BPSK-like technique (Martin et al., Reference Martin, Leblond, Guillotel and Heiries2003; Betz Reference Betz2001; Burian et al., Reference Burian, Lohan and Renfors2006), the Autocorrelation Side-Peak Cancellation Technique (ASPeCT) (Julien et al., Reference Julien, MacAbiau, Cannon and Lachapelle2007), Sub-Carrier Phase Cancellation (SCPC) (Heiries et al., Reference Heiries, Avila-Rodriguez, Irsigler, Hein, Rebeyrol and Roviras2005) Technique, and Side Peak Cancellation Technique (SPCT) (Yao and Feng, Reference Yao and Feng2010; Yao et al., Reference Yao, Cui, Lu, Feng and Yang2010; Sanghun et al., Reference Sanghun, Dahae and Seokho2009).
While the BOC signal was treated as the sum of two BPSK signals, the BPSK-like method was proposed to provide an unambiguous correlation; several improved methods such as the Cyclically Shift and Combine (CSC) methods (Mao et al., Reference Mao, Hwang, Hung, Sheen and Chen2013) have subsequently been proposed. This type of method can reduce sub-carrier influence, but the energy and necessary information are lost, and the sharpness of the main-peak is destroyed, severely degrading receiving performance.
The ASPeCT method can overcome the ambiguous characteristic, but it achieves only partial ambiguity mitigation (i.e., reduced but not completely attenuated side-peaks) at the cost of reduced discriminator pulling range. Furthermore, ASPeCT is only useful for BOC (n, n) cases.
Although the Sub-Carrier Cancellation (SCC) and Sub-Carrier Phase Cancellation (SCPC) technologies can ignore the effects of phase, they do not take advantage of the high-accuracy characteristics of the BOC signal. Moreover, the main peak estimation error is large, and the correlation decision efficiency is low; thus, they cannot provide high acquisition for tracking transition parameters.
The essence of SPCT is to minimise the side-peaks of the auto-correlation function since they are the origins of false lock tracking. The methods presented in Feng et al. (Reference Feng, Xu and Xu2014; Reference Feng, Xu and Li2015) have some drawbacks in the tracking stage because the effect of the side-peak is not removed completely. Thus, it can potentially lock onto the false original peak. A high precision process method (Brahim et al., Reference Brahim, Chonavel, Trubuil and Boudraa2015) is provided by combining different correlation functions, and a time-multiplexed double strobe scheme (Liu et al., Reference Liu, Fang and Wang2015) for a Time Multiplexed Binary Offset Carrier (TMBOC) modulated signal is presented to improve synchronisation performance. However, the adaptabilities of these methods are deficient because they are not suited for high-order BOC signals.
2. MAIN PEAK EXTRACTION METHOD
To tackle the abovementioned problems, we propose a new main peak extraction (MPE) method for high-order BOC signals. The essence of the MPE method is as follows: Local shifting sequences are defined according to the relationship between the sub-carrier and PRN code, and the synthesis cross-correlation function is then established to solve the sub-carrier influence in the MPE method. Furthermore, a reference frame is established using the minimum and maximum peaks of the synthesis cross-correlation function, and the geometry graph is formatted to calculate the estimation main peak. We now describe in detail the principle of the new method.
Firstly, the received digital intermediate frequency signal is modelled after the frequency down-conversion, power amplifying, Analog to Digital Converter (ADC), and band-pass filtering. It is approximately given as
 $$R\lpar n\rpar =d\lpar n\rpar C\lpar n\rpar S_{CS}\lpar n\rpar =d\lpar n\rpar C\lpar n\rpar \hbox{sgn}\lpar \sin\lpar 2\pi\omega n+\theta\rpar \rpar $$
where d(n) is the binary navigation data, C(n) is the PRN code, S
CS
(n) is the sub-carrier sequence, which can also be expressed as
 $\hbox{sgn}\lpar \sin\lpar 2\pi\omega n+\theta\rpar \rpar $
, ω is the sub-carrier frequency, and θ is the sub-carrier phase offset. The BOC signal is usually expressed as BOC (f
1, f
2). We then define the sampling frequencies of the BOC signal, the frequency of the sub-carrier and the PRN code as f
S
, f
SC
, and f
C
, respectively. The frequencies are expressed as
 $$f_{SC}=f_1\times 1{\cdot}023\times 10^{6} $$
 $$f_C=f_2\times 1{\cdot}023\times 10^6 $$
Then ε is the number of half sub-carriers in one code chip, and is defined as the modulation order, which is expressed as Equation (4).
 $$\varepsilon=\displaystyle{{2f_1} \over {f_2}} $$
λ is the sampling number for the half sub-carrier
and T is the sampling number in one code chip. These sampling numbers are expressed as Equations (5) and (6), respectively.
 $$\lambda=\displaystyle{{f_S} \over {2f_{SC}}} $$
 $$T=\displaystyle{{f_S} \over {f_C}} $$
From Equation (1), we find that the main and side peaks will be distorted in the BOC autocorrelation function when θ is not equal to zero, that is, sub-carrier phase offset occurs in the received signal.
Thus, the local shifting sequences in the new method are defined to overcome the influence, which is given by
 $$L_L\lpar n\rpar =C\lpar n\rpar S_C\lpar n\rpar E_L\lpar n\rpar =C\lpar n\rpar \hbox{sgn}\lpar \sin\lpar 2\pi\omega n\rpar \rpar E_L\lpar n\rpar $$
 $$L_R\lpar n\rpar =C\lpar n\rpar S_C\lpar n\rpar E_R\lpar n\rpar =C\lpar n\rpar \hbox{sgn}\lpar \sin\lpar 2\pi\omega n\rpar \rpar E_R\lpar n\rpar $$
where E L (n) and E R (n) are expressed as Equations (9) and (10), respectively, in which k is a positive integer from one to infinity.
 $$E_L\lpar n\rpar = \left\{\matrix{1\comma \; & \lpar k-1\rpar \varepsilon\lambda\le n\le \lpar k-1\rpar \varepsilon\lambda + \lambda \cr \hfill 0\comma \; & \lpar k-1\rpar \varepsilon\lambda+ \lambda \lt n \lt k \varepsilon \lambda \cr}\right.$$
 $$E_R\lpar n\rpar = \left\{\matrix{0\comma \; & \lpar k-1\rpar \varepsilon\lambda \lt n \lt k\varepsilon\lambda-\lambda \cr \hfill 1\comma \; & k\varepsilon\lambda- \lambda\le n\le k\varepsilon\lambda\cr}\right. $$
The signal received before processing is executed by circumferential correlation arithmetic function with L L (n) and L R (n), which are expressed as
 $$X_L\lpar n\rpar =R\lpar n\rpar \otimes L_L\lpar n\rpar =d\lpar n\rpar C\lpar n\rpar \hbox{sgn}\lpar \sin\lpar 2\pi\omega n+\theta\rpar \rpar \otimes C\lpar n\rpar \hbox{sgn}\lpar \sin\lpar 2\pi\omega n\rpar \rpar E_L\lpar n\rpar $$
 $$X_R\lpar n\rpar =R\lpar n\rpar \otimes L_R\lpar n\rpar =d\lpar n\rpar C\lpar n\rpar \hbox{sgn}\lpar \sin\lpar 2\pi\omega n+\theta\rpar \rpar \otimes C\lpar n\rpar \hbox{sgn}\lpar \sin\lpar 2\pi\omega n\rpar \rpar E_R\lpar n\rpar $$
where ⊗ is defined as the circumferential correlation arithmetic notation.
Thus, the synthesis cross-correlation function is established as
 $$\Delta X\lpar n\rpar =\displaystyle{{f_{SC}}\over{f_C}}\lpar \vert X_L\lpar n\rpar \vert +\vert X_R\lpar n\rpar \vert -\vert X_L\lpar n\rpar -X_R\lpar n\rpar \vert \rpar \approx \displaystyle{{f_{SC}}\over{f_C}}\left(\wedge_0\lpar n\rpar +\sum^{T/2}_{i=T/2}\wedge_i\lpar n\rpar \right)$$
where ∧0(n) and ∧ i (n) are trigonometric peaks, whose centres are at zero and i, respectively.
From Equation (13), it is possible to obtain the correlation result Δ X(n) which has many peaks. We find that the unadulterated main peak is influenced by some distortion peaks
 $\sum^{T/2}_{i=T/2}\wedge_{i}\lpar n\rpar $
in the correlation result. As there are many peaks in Δ X(n), we calculate the minimum peak in Δ X(n), which is defined as D.
 $$D=\min\lsqb \Delta X\lpar n\rpar \rsqb $$
Where min[] is the minimum peak calculation function, the peak value of D is defined as D x , and the peak position of D is defined as D y .
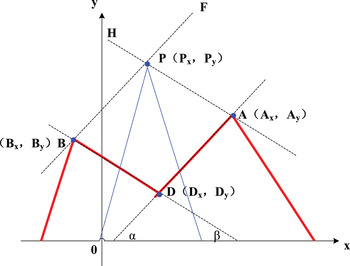
Then the left maximum peak of D is defined as B, whose peak value is defined as B x , and peak position is defined as B y . The right maximum peak of D is defined as A, whose peak value is defined as A x , and peak position is defined as A y . Thus, we utilise D, B, and A to establish a reference frame, in which D x , B x , and A x are used as the abscissa, D y , B y , and A y are used as the ordinate. The reference frame is shown in Figure 1.
The theory of the structure reference frame.

In Figure 1, the angle between line and coordinate X is α, the angle between line BD and coordinate X is β, and the tangent functions of α and β are expressed as
 $$K_\alpha=\displaystyle{{A_y-D_y} \over {A_x-D_x}} $$
 $$K_\beta=\displaystyle{{B_y-D_y} \over {B_x-D_x}} $$
Thus, line BF is established as parallel to line AD. In the same way, line AH is established as parallel to line BD in Figure 1.
 $$P_y-B_y=K_\alpha\lpar P_x-B_x\rpar $$
 $$P_y-A_y=K_\beta\lpar P_x-A_x\rpar $$
Thus, when Equations (17) and (18) are combined, the crossing point P of lines BF and AH is formed, which is the estimation main peak of the MPE method. Then we subtract Equation (18) from Equation (17) to obtain Equation (19), which is the estimation main peak position P x . From the multiplication result of Equation (17) and K β, we subtract the multiplication result of Equation (18) and K α to obtain Equation (20), which is the estimation main peak value P y .
 $$P_x=\displaystyle{{A_y-B_y+K_\alpha B_x-K_\beta A_x}\over {K_\alpha-K_\beta}} $$
 $$P_y=\displaystyle{{K_\beta K_\alpha A_x-K_\beta K_\alpha B_x+K_\beta B_y+K_\beta A_y} \over {K_\alpha-K_\beta}} $$
3. SIMULATION AND ANALYSIS
The MPE method, the SCPC and SPCT methods are simulated and analysed using the following parameters. The high-order BOC signals are selected as BOC (14,2) and BOC (15,2·5). The sampling frequencies, the frequency of the sub-carrier f SC and the PRN code f C are expressed as:
 $$f_S=120\times 10^6 $$
 $$f_{SC}= \left\{\matrix{14\times 1{\cdot}023\times 10^6\comma \; & when\, BOC \lpar 14\comma \; 2\rpar \cr \hfill 15\times 1{\cdot}023\times 10^6\comma \; & when\, BOC \lpar 15\comma \; 2{\cdot}5\rpar \cr}\right. $$
 $$f_{C}= \left\{\matrix{2\times 1{\cdot}023\times 10^6\comma \; & when\, BOC \lpar 14\comma \; 2\rpar \cr \hfill 2{\cdot}5\times 1{\cdot}023\times 10^6\comma \; & when\, BOC \lpar 15\comma \; 2{\cdot}5\rpar \cr}\right. $$
3.1. Main peak extraction analysis
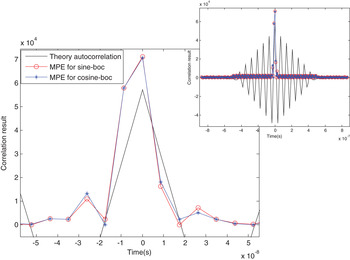
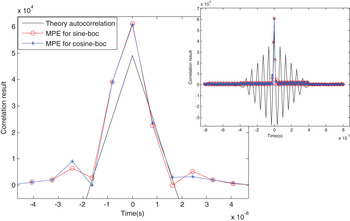
To verify the validity of the MPE method, the main peak extraction ability is analysed. The correlation results and their magnified picture for sine-BOC (14,2) and cosine-BOC (14,2) are shown in Figure 2, and the results for sine-BOC (15,2·5) and cosine-BOC (15,2·5) are shown in Figure 3. The results of the theoretical autocorrelation have multiple side peaks, but the correlation of the MPE method has only one main peak. From the magnified figures, we find that the main peak position of the MPE method is the same as the theory position, and the correlation results for sine-BOC and cosine-BOC are approximately the same. The results demonstrate that the side peaks can be cancelled in the MPE method and that the main peak can be extracted in the correct position.
BOC (14,2) correlation results.

BOC (15,2·5) correlation results.

3.2. Performance comparison analysis
Firstly, we define the maximum peak to average ratio to verify the synchronisation and receiver ability, and the main peak decision efficiency, which, being the ratio of the maximum and average peaks, is expressed as P m /P a . Main peak decision efficiency increases with P m /P a . We then define the main-side peak ratio to test the ability of the side peak inhibition, which, being the ratio of the main and side peaks, is expressed as P m /P s ; side peak inhibition ability increases with P m /P s . Furthermore, since the main peak estimation error is a very important indicator, we will test and express it as P e . Synchronisation ability increases as P e decreases. Based on the definition of P m /P a , P m /P s and P e , the MPE method is compared with other preferable methods, namely, the SCPC and SPCT methods.
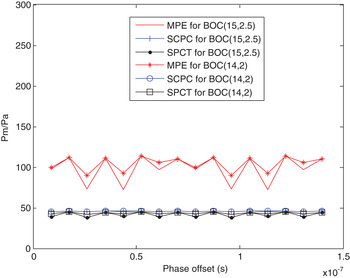
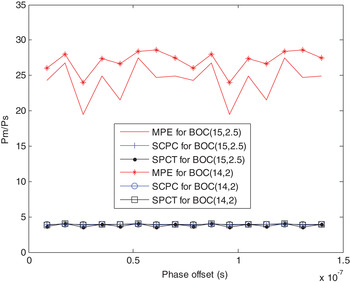
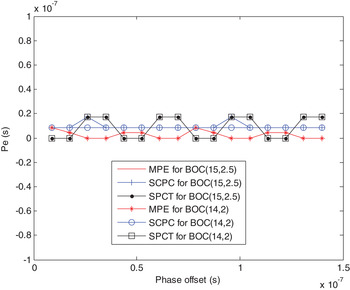
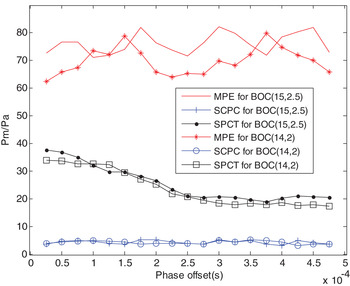
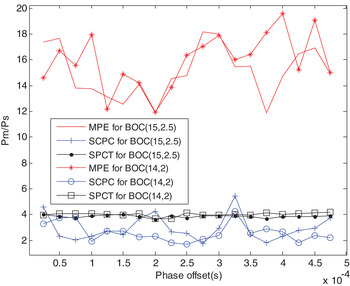
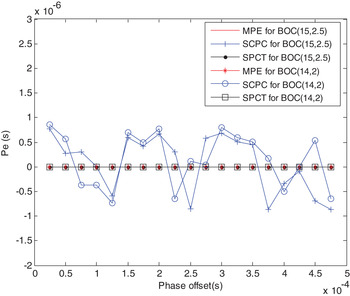
As the effect of phase is smaller, the sub-carrier phase offset can be ignored in certain methods but is inevitable in the receiving signal. Thus, with changing sub-carrier phase offset, P m /P a results for BOC (14,2) and BOC (15,2·5) are shown in Figure 4. The results show that the peak to average ratio of the MPE method is the greatest, demonstrating that the MPE method's main peak decision efficiency and synchronisation ability are the best. With changing sub-carrier phase offset, P m /P s results are shown in Figure 5, whose results show that the main-side peak ratio of the MPE method is noticeably greater than that of the other two methods. Thus, the side peak inhibition ability of the MPE method is demonstrably the best. Furthermore, with changing sub-carrier phase offset, P e results are shown in Figure 6, in which the average phase estimation error of the MPE method is the smallest, which demonstrates that this method's phase estimation performance is the best.
P m /P a results with changing sub-carrier phase offset.

P m /P s results with changing sub-carrier phase offset.

P e results with changing sub-carrier phase offset.

We know the difference between sine-BOC and cosine-BOC is different sub-carrier phase. From Figures 4, 5 and 6, we find that the sub-carrier phase offset has no obvious effect on P m /P a , P m /P s , and P e . Thus, we take sine-BOC as an example to analyse the related results in the following simulations.
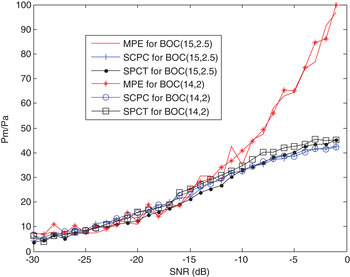
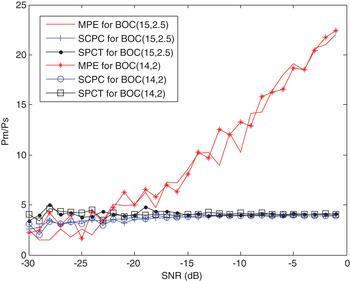
Furthermore, under the various noise conditions, P m /P a , P m /P s and P e are also simulated to verify the environment adaptability. With changing Signal to Noise Ratio (SNR), P m /P a results are shown in Figure 7, and P m /P s results are shown in Figure 8. The results show that the peak to average ratio of three methods increases with SNR, and the MPE method is higher than the other two methods under the same condition. From Figure 8, it can also be observed that the main-side peak ratio of the MPE method noticeably increases with SNR, that change is not noticeable with an SNR increase in the case of the SCPC and SPCT methods, and that the results are higher with the MPE method than with the other two methods. Thus, the MPE method's main peak decision efficiency is the best, and the side peak cancellation ability is also the best under the same SNR condition.
P m /P a results with changing SNR.

P m /P s results with changing SNR.

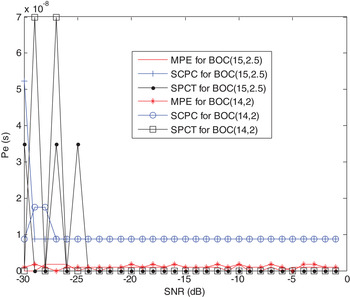
P e results with changing SNR are then shown in Figure 9, whose results show that the phase estimation error of the MPE method is noticeably better than that of the other two methods and that the estimation error of the SCPC and SPCT methods is larger when SNR is less than −25 dB, which demonstrates that the MPE method's phase estimation performance is the best under the same condition.
P e results with changing SNR.

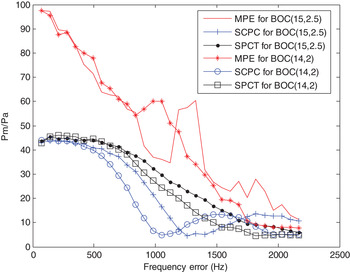
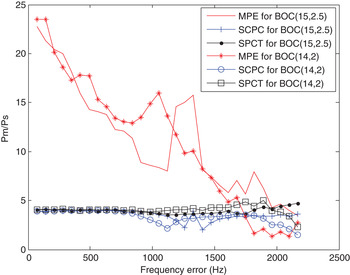
Since the frequency error is inevitable in RF filtering processing and mix-frequency processing, the comparison tests of the three methods are also analysed when there is a frequency error in the receiving signal. P m /P a results with changing frequency error are shown in Figure 10, and P m /P s results are shown in Figure 11. From Figure 10, it can be observed that the peak to average ratio for the three methods decreases as the frequency error increases. When P m /P a is 10, the frequency error adaptive range is 1 KHz for the SCPC method, 1·5 KHz for the SPCT method, and 2 KHz for the MPE method, respectively. Moreover, the MPE method is noticeably better than the other two methods under the same frequency error condition. From Figure 11, it can be observed that the main-side peak ratio of the MPE method noticeably decreases as the frequency error increases, that changes are not noticeable as the frequency error increases in the case of the SCPC and SPCT methods and that the MPE method is noticeably better than the other two methods under the same frequency error condition. Thus, the side peak cancellation ability of the MPE method is noticeably better than that of the other two methods.
P m /P a results with changing frequency error.

P m /P s results with changing frequency error.

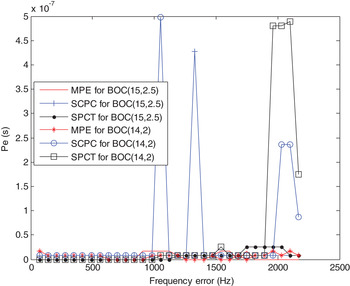
In addition, P e results with changing frequency error are shown in Figure 12, whose results show that the phase estimation error of the SCPC and SPCT methods becomes greater when the frequency error is 1 KHz, 1·8 KHz, respectively. However, the phase estimation error of the MPE method is very small when the frequency error is less than 2 KHz. Thus, these results demonstrate that the frequency error adaptive ability of the new method is the best.
P e results with changing frequency error.

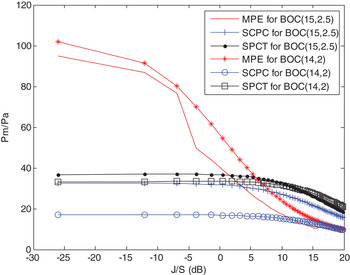
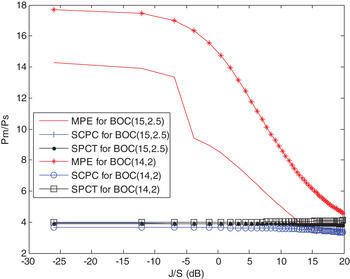
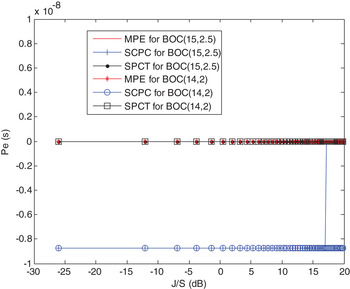
In light of the real complex environmental characteristics, especially with respect to different interference signals and multipath errors, these methods are also tested under the mixed complex signals condition. We defined J/S, which is the power ratio of the mixed complex signals and receiving signal. P m /P a results with changing J/S are shown in Figure 13, and P m /P s results are shown in Figure 14. From Figure 13, it can be observed that the peak to average ratio of the three methods decreases as J/S increases and that the MPE method is better than the other two methods under the same J/S condition. From Figure 14, it can be observed that the main-side peak ratio of the MPE method noticeably decreases as J/S increases, that changes are not noticeable as J/S increases in the case of the other two methods, and that the MPE method is noticeably better than the other two methods. Moreover P e results with changing J/S are shown in Figure 15, whose results show that the phase estimation error of the three methods is very small; however, the phase estimation error of the SCPC method is the largest.
P m /P a results with changing J/S.

P m /P s results with changing J/S.

P e results with changing J/S.

In addition, P m /P a results with changing different phases of indirect signal are shown in Figure 16, P m /P s results are shown in Figure 17, and P e results are shown in Figure 18. It can be observed that the peak to average ratio of the MPE method is better than the other two methods, and that the main-side peak ratio of the MPE method is noticeably better than the other two methods under the same condition. The results also show that the phase estimation error of the three methods is very small; however, the phase estimation error of the SCPC method is the largest. These results demonstrate that the MPE method's main peak decision efficiency, side peak cancellation ability and phase estimation performance are all the best under the same conditions.
P m /P a results with changing phases of indirect signal.

P m /P s results with changing phases of indirect signal.

P e results with changing phases of indirect signal.

3.3. Detection probability analysis
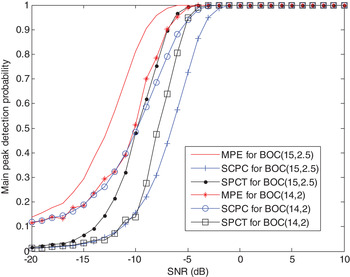
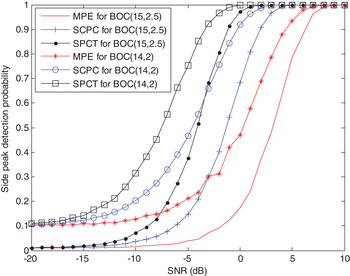
Finally, the detection probability of the main and average side peaks is analysed under the condition of constant false alarm probability, which is
 $1 \times 10^{-5}$
. The main peak detection probability results with changing SNR are shown in Figure 19. The results show that the main peak detection probability of the MPE method is better than that of the SCPC and SPCT methods. The side peak detection probability results with changing SNR are shown in Figure 20. The results show that the side peak detection probability of the MPE method is lower than that of the SCPC and SPCT methods under the same condition. Thus, the MPE method's side peak cancellation ability is demonstrably the best.
The main peak detection probability.

The side peak detection probability.

4. CONCLUSIONS
In this paper, the problems involved with the large main peak estimation error and low correlation decision efficiency for high-order BOC signals are investigated, and the principles of several preferable estimation methods are studied, including the SCPC and SPCT methods. To solve the abovementioned problems, the MPE method is proposed. In this method, the synthesis cross-correlation function is established, and the geometry graph is formatted to calculate the main peak position and value. The side peaks can be cancelled in the MPE method, and the main peak can be extracted in the correct position. Furthermore, in the case of the MPE method, the detection probability of the main peak is the highest, the side peak detection probability is the lowest, and the phase estimation performance are noticeably better than those in the case of the SCPC and SPCT methods under the same test condition. Besides, the peak to average ratio of MPE method is the best under the same test condition, and it is twice that of SCPC and SPCT methods under the best test condition. The side peak cancellation ability of the MPE method is the best under the same test condition, and it is four to five times that of SCPC and SPCT methods under the best test condition.
ACKNOWLEDGMENTS
This work was supported by the National Natural Science Foundation of China (no. 61501309), the China Postdoctoral Science Foundation (no. 2015M580231), the Program for Liaoning Innovative Research Team in University (no. LT2011005).